


 English (pdf)
 Article in xml format
 Article references
 Send this article by e-mail
 Cited by SciELO
  Cited by Google
  Similars in
SciELO
Similars in
SciELO  Similars in Google
 Permalink
INTRODUCTION
Classic multivariate dimensional reduction techniques have been widely used in different fields of science to extract the underlying factors from large sets of data or to build synthetic indicators that range from natural to social sciences, such as Physics, Chemistry, Biology, Medicine, Astronomy, Psychology, Education, Management, Marketing, etc. There is a large amount of literature that focuses on the application of mainly, Principal Component Analysis and Factor Analysis, in different fields of knowledge.1
In previous research, three different dimension reduction or feature extraction techniques for extracting the underlying systematic risk factors driving the returns on equities in a statistical approach to the Arbitrage Pricing Theory (Ross, 1976) have been presented. This approach assumes a priori neither the number nor the nature of either the systematic risk factors or the sensitivity to them; therefore, in this paper, the estimation of both of them is performed by using extraction and econometric techniques in two different stages. The efforts to extract underlying factors with better characteristics led us to advance from classical multivariate techniques, such as Principal Component Analysis (PCA) and Factor Analysis (FA), to more advanced and sophisticated techniques -usually applied in fields like Engineering, Telecommunications, Astronomy, Biochemistry, Bioinformatics, Artificial Intelligence and Robotics- such as Independent Component Analysis (ICA) and Neural Networks Principal Component Analysis (NNPCA).
Although the main objective of each technique is similar -to reduce the dimension or to extract the main features from a set of variables-, they are different in nature, assumptions, principles, and internal algorithms; this makes it difficult and impracticable to compare their results, i.e., the matrices used in the processes of extraction and generation, and the underlying factors extracted. To solve this problem, the main objective of this paper is to propose a methodology to compare the four techniques, based on the degree of accuracy in the reconstruction of the observed variables using the underlying systematic factors extracted using each technique.
To accomplish this objective, first, a theoretical and matrix comparison among techniques is proposed, where their parallelism among their particular mixing and demixing processes is remarked. Then, this paper provides empirical evidence of their reconstruction accuracy using a set of measures usually implemented for forecastings, such as the Mean Absolute Error (MAE), the Mean Absolute Percentage Error (MAPE), The Root Mean Square Error (RMSE), the Theil's U statistic (U-Theil), the Confusion Matrix (CM), the Confusion Rate (CR), The chi-squared contrast of independence (x2), and the Pesaran & Timmermann's directional accuracy statistic (DA).
Comparative studies of all four techniques in literature are scarce, so the main contribution of this paper is precisely to fill this gap in the financial literature, providing a theoretical and empirical comparative study among PCA, FA, ICA, and NNPCA in the field of finance, by way of matrix parallelism among the four techniques and the analysis of the reconstruction accuracy of the observed returns on equities, using the different components or factors extracted through each technique.
In addition, this study contributes to providing evidence in two particular relevant contexts. On the one hand, the financial market studied, that in this case represents an important emergent Latin-American equity market -the Mexican Stock Exchange-, whose studies related to these kinds of techniques are uncommon as well. On the other hand, the time analyzed corresponds to the period previous to the last recognized financial bubble: the subprime crisis. In the current actual situation where is very likely that another financial and economic crisis strikes, derived from the effects of the COVID-19 pandemic, it is considered necessary to test the performance of these techniques in a similar period to show explanatory insights into these kinds of situations.
Although these types of statistical and computational techniques have both explanatory and forecasting attributes, the aim and scope of this paper are focused only on their explanatory power. The forecasting properties are out of the scope of this paper since they are considered in other additional researches. Likewise, the test of these techniques during crisis and post-crisis periods is being studied in other extensions of this research.
The main results of this research reveal, on the one hand, that from a theoretical perspective NNPCA seems to offer the most suitable attributes for the underlying factors in a statistical context of the Arbitrage Pricing Theory. On the other hand, from an empirical scope, although there is no clear supremacy of any of the four techniques, evidence points to NNPCA as the one with the best performance in the reconstruction of the returns on equities.
The structure of this paper is as follows: section 2 makes a review of literature focused on comparative studies of these techniques; section 3 proposes the matrix parallelism among the used techniques, explaining the attributes of the factors extracted with each one of them; section 4 describes the methodology carried out in the study, and section 5 shows the results of the empirical comparative study. Finally, section 6 draws some conclusions and section 7 presents the references.
REVIEW OF THE LITERATURE.
To the best of our knowledge, only Scholz (2006a) uses and compares three of the aforementioned techniques in a single study, i.e. PCA, ICA, and NNPCA, carried over to molecular data in biochemistry to extract biologically meaningful components. The author explains the benefits and drawbacks of each type of analysis to understand biological issues, concluding that, depending on the characteristics of the data and the purpose of the research, one specific technique is more suitable than the others. For the sake of saving space and considering that one of the main contributions of this paper is the application of these four techniques in the financial context, comparative studies in fields different from Finance and Economics are out of the scope of this research. Nevertheless, the interested reader can easily find references of comparative studies between some of these techniques in the literature of Natural and Social Sciences.
Some recent and relevant researches focused on comparative studies of these types of techniques are, for example, Corominas, Garrido-Baserba, Villez, Olsson, Cortés & Poch (2018), where the authors do a description of the state-of-the art computer-based techniques for data analysis in the context of wastewater treatment plants; and Ayesha, Hanif & Talib (2020) where they present the state-of-the-art dimensionality reduction techniques for high dimensional data and their suitability for different types of application areas such as biomedicine, audio, image and video, genetics, signal-processing, pattern-recognition, etc. Comparative studies in Economics and Finance are not very frequent in literature, and they have dealt with only two of these techniques in the same review. Some relevant references in these fields are the following.2
Regarding PCA and FA, Ince & Trafalis (2007) use the components and factors extracted through PCA and FA as the input variables for two different forecasting models to compare their performance for stock price prediction on the NASDAQ. They found that the factors extracted through FA performed better than the components extracted through PCA. More recently, Ibraimova (2019) compares the performance of PCA and FA as dimensionality reduction techniques where the factors extracted by each technique were used as inputs in a model that tried to predict financial distress in companies through machine learning. The best results in predictions were those that used the PCA factors extraction.
Concerning ICA, Bellini & Salinelli (2003) find that the immunization strategies to the US Treasury spot rates curve movements based on ICA perform better than those based on PCA. Lesch, Caille, & Lowe (1999) apply PCA and ICA to perform feature extraction from currency exchange data of the British Pound against the US Dollar, showing that both techniques are capable of detecting deterministic structure in the data, but independent components are much closer in their morphology to the signals.
Back & Weigend (1997) apply ICA and PCA on the Tokyo Stock Exchange, showing that while the reconstruction of the observed stock prices derived from the independent components extracted is outstanding, the reproduction resulting from the principal components is not. Yip & Xu (2000) carry ICA and PCA over to stocks from the S&P 500, finding that ICA gives a better indication of the underlying structure of the US stock market, in terms of the linear relationship between the components extracted through both techniques and some predefined macroeconomic factors.
Rojas & Moody (2001) compare ICA and PCA by investigating the term structure and the interactions between the returns of iShares MSCI Index Funds and the returns of the S&P Depositary Receipts Index; they demonstrate that ICA has more influence on the average mutual information. Lizieri, Satchell & Zhang (2007) compare the ICA and PCA components' capability of capturing the kurtosis in Real Estate Investment Trusts (REIT) in the USA, therefore proving that ICA overcomes PCA. Nevertheless, Wei, Jin & Jin (2005) uncover that, although both techniques produce similar results, PCA outperforms ICA in the reconstruction of mutual funds in the Chinese financial market.
On the other hand, Coli, Di Nisio & Ippoliti (2005), in an application of ICA and PCA to a stocks portfolio of the Milan Stock Exchange, uncover that, although the principal components present a minimum reprojection error when they are used to reconstruct the data, the independent components make it easier to distinguish of the trend and the cyclical components. More recently, Sayah (2016), compares PCA-GARCH versus ICA-GARCH models in the context of Basel's III sensitivity based approach for the interest rate risk in the trading book of Banks, finding that in general, the ICA model produced more restrictive results in the Value at Risk (VaR) computation.
Regarding NNPCA, Weigang, Rodrigues, Lihua & Yukuhiro (2007) compare NNPCA and PCA in terms of their dimensional reduction capability, to extract the main feature explaining the trends of withdrawals from an employment time guarantee fund, thereby showing that NNPCA is more suitable than PCA for dimension reduction in this context.3 On the other hand, Liu & Wang (2011) integrated ICA and PCA with Neural Networks to predict the Chinese Stock Market finding suitable results. In addition, interesting surveys focused on applications of related intelligent computational techniques in financial markets applications can be found in Cavalcante, Brasileiro, Souza, Nobrega & Oliveira (2016), and in machine learning techniques applied to financial market prediction in Miranda, Amorin & Kimura (2019).
On the other hand, there is a working precedent that has undertaken a systematic exploration of dimensionality reduction methods such as Anowar, Sadaoui & Selim (2021). However, the current work aims to find basic factors that can explain the underlying risk factors in the Mexican market. This is why a selection of dimensionality reduction techniques has been made that allows a local approximation to explain the risk. In particular, not all dimensionality reduction techniques allow for explanations. For example, following Scikit-Learn (2021), Multi-dimensional Scaling (MDS) is based on finding a 2D distribution that maintains the metric relationships of the original space, but loses the proportionality relationship when explaining risk and the dynamic aspect that is of interest in this article.
Finally, techniques such as ISOMAP and Local Linear Embedding (LEE), are based on locally generating the manifold using the observed training points. These are techniques related to differential geometry, which generate a graph that allows surfaces to be modelled in a higher-dimensional space, without crossings or mixtures of regions in different parts of the surface. Although this type of technique may be of interest for understanding neighborhood relationships in the trajectories of values, it does not allow expressing risk with a linear relationship. Something similar hap-pens with the t-distributed stochastic neighbor embedding (t-SNE), in this case, it is an embedding, not a projection, so a mesh is found based on a similarity measure based on proximity of probability distributions utilizing the Kullbach Leiber measure. Although this is a method that allows a reliable low-dimensional representation of the mesh that relates the entry points, it does not allow us to capture the dynamic risk relationships through a matrix, which is the objective of our work.
MATRIX PARALLELISM AMONG PCA, FA, ICA, AND NNPCA.
The four techniques used in this study, PCA, FA, ICA, and NNPCA,4 can be classified as latent variable analysis, dimension reduction, or feature extraction techniques, whose main objective is to obtain some new underlying synthetic variables - from a set of observed data - capable of reproducing the behavior of the original data, in this context, returns on equities. Strictly speaking, a latent variable analysis technique tries to infer some unobservable artificial variables from a set of observable ones by using some mathematical models. On the other hand, the objective of a dimension reduction technique is only to reduce the dimensionality of the problem by selecting a fewer number of new artificial variables created by the combination of the original ones, via some mathematical or geometric transformation of the observed variables. Finally, a feature extraction technique seeks that the new variables extracted represent the main or most relevant and meaningful components or factors resulting from specific combinations of the observed ones.
Nevertheless, the purpose of this paper is to obtain a set of factors -hidden in the observed variables- to explain, in the best manner, why the returns on equities in the sample behave as they do. Consequently, any of the three approaches to classify these techniques fits properly as a method for extracting the main factors explaining the behavior of the returns on the equities of the sample. The four classes of analysis include two different processes, the extraction of the underlying factors process and the generation of the original variables process. Table 1 presents matrix parallelism among the extraction and generation processes employed in each technique and the main attributes of their extracted components or factors.
Table 1 Matrix parallelism among techniques to extract the underlying factors of systematic risk.
| Extraction Process | Generation Process | Attributes of the extracted components or factors. | |
| Principal Component Analysis (PCA) | Z = XA | Z = XA' | 1) Linearly uncorrelated components. 2) Linearly mixed. |
| F = XC | |||
| (Bartlett's model) | |||
| Factor Analysis (FA) | C =PQ P = Ψ-1Λ Q = (Λ'Ψ-1Λ)-1 |
X = 1μ + FA' | 1) Linearly uncorrelated common factors. 2) Linearly mixed. |
| Independent Component Analysis (ICA) | S = WX | X = AS | 1) Statistically independent components. 2) Linearly mixed. |
| Neural Networks | Z = W2 g(W1X) | X = W4 g (W3Z) | 1) Nonlinearly uncorrelated components. 2) Nonlinearly mixed. |
| Principal Component Analysis. | |||
| (NNPCA) | |||
| Notes: | |||
| In PCA: | |||
| Z = Matrix of principal components. | |||
| X = Matrix of data. | |||
| A = Matrix of loadings. | |||
| In FA: | |||
| F = Matrix of common factors. | |||
| X = Matrix of data. | |||
| Λ = Matrix of loadings. | |||
| Ψ = Matrix of specific variances or matrix of specificities or uniqueness. | |||
| μ = Vector of means. | |||
| In ICA: | |||
| S = Matrix of independent components or original sources. | |||
| X = Matrix of data. | |||
| W = Demixing matrix. | |||
| A = Mixing matrix. | |||
| In NNPCA: | |||
| Z = Matrix of nonlinear principal components. | |||
| X = Matrix of data. | |||
| W1 = Matrix of weights from the first layer to the second layer. | |||
| W2 = Matrix of weights from the second layer to the third layer. | |||
| W3 = Matrix of weights from the third layer to the fourth layer. | |||
| W4 = Matrix of weights from the fourth layer to the fifth layer. | |||
| g = Transferring nonlinear function. | |||
Source: Author's elaboration.
The same kind of analogy can be made to include PCA and FA in the former parallelism as well, taking the matrices of weights in the extraction process (A and C), the matrices of the extracted components or factors (Z and F), and the factor loading matrices in the generation process (A' and A'), respectively. It is important to remark that, although there is matrix parallelism among the elements of these techniques, in this context, the direct comparison of their values is not homogeneous among all of them, e.g., the generation processes in PCA, FA, and ICA include only a linear mixing of the original data matrix and the demixing matrices; however, in NNPCA the process includes a non-linear combination of two matrices of weights and the original data matrix; thus, this technique does not have a single demixing matrix which, when multiplied directly by the data matrix, might produce the extracted factors. A similar situation occurs with the generation process, so it is necessary to use other methods to compare the four techniques, such as the reconstruction accuracy of the observed variables.
On the other hand, strictly speaking, the FA should not be compared directly with the rest of these techniques since the FA includes an independent term corresponding to the specific factors (U), which is not considered in the rest of them.5 The FA should be compared with the equivalent versions of the other techniques that consider an independent term in the model as well, e.g., the Noisy ICA (N-ICA) or Independent Factor Analysis (IFA) and the Non-linear Factor Analysis (NLFA). Nevertheless, PCA and FA have always been compared and in some cases even confused, since PCA is considered as a method of estimation within the FA, which is incorrect; thus, FA results were included in this review, too. The next step in further research will be to compare FA with the equivalent versions of the independent and non-linear models.
Finally, in the financial context, the most important differences among the four techniques are perhaps the attributes of the components or factors extracted, because they imply a progression from only linearly uncorrelated components in PCA to linearly uncorrelated common factors in FA, then to statistically independent components in ICA, and lastly to non-linearly uncorrelated components in NNPCA. From a theoretical standpoint, the former statement would imply the uncovering of a more realistic latent systematic risk factor structure, as one advance to more sophisticated techniques. This nature of the components or factors extracted through each technique is given mainly for the following conditions: First, while the orthogonal components extracted by using PCA explain the total amount of variance in the observed variables, the orthogonal factors produced by FA explain only the amount of variance explained by common factors, i.e., the covariance among the variables.
Nevertheless, both PCA and FA consider only the second-moment absence of linear correlation; on the other hand, ICA considers higher moment absences of linear correlation, which produce not only linearly uncorrelated components but also statistically independent ones. Finally, while the three former techniques only consider a linear mixing in the extraction and generation processes, NNPCA includes a nonlinear transformation in both processes, which generates not only linearly uncorrelated components but also non-linearly uncorrelated ones.
METHODOLOGY
The data.
The data used in the empirical study correspond to stocks of the Price and Quotation Index (IPC) of the Mexican Stock Exchange (BMV); Table 2 presents the list of the entire sample used in this study. Both the period analyzed and the shares selected respond to the following criteria: 1) the sample used in the cited former studies that allow us to make this comparative study of the results produced by each of the four techniques used in them, 2) the interest in a worldwide recognized pre-crisis period where stock prices were out of the effect of the subprime crisis formation, and 3) the availability of data among the diverse information sources consulted.
Table 2 Stocks used in the study.
| No. | Ticker | Name of the Company | Industrial Sector |
| 1 | ALFAA | Grupo Alfa | Holding |
| 2 | ARA* | Consorcio Ara | Construction: Housing |
| 3 | BIMBOA | Grupo Bimbo | Food processing |
| 4 | CEMEXCP (1) | Cemex | Cement |
| 5 | CIEB | Corporación Interamericana de Entretenimiento | Holding |
| 6 | COMERUBC | Controladora Comercial Mexicana | Commerce: retailing and wholesale |
| 7 | CONTAL* | Grupo Continental | Food and beverage processing |
| 8 | ELEKTRA* | Grupo Elektra | Commercial firms |
| 9 | FEMSAUBD | Fomento Económico Mexicano | Beer and beverage |
| 10 | GCARSOA1 | Grupo Carso | Holding |
| 11 | GEOB | Corporación GEO | Construction: Housing |
| 12 | GFINBURO | Grupo Financiero Inbursa | Financial services |
| 13 | GFNORTEO | Grupo Financiero Banorte | Financial services |
| 14 | GMODELOC | Grupo Modelo | Food, tobacco and beverages |
| 15 | KIMBERA (1) | Kimberly-Clark de México | Cellulose and paper |
| 16 | PE&OLES* | Industrias Peñoles | Ferrous minerals |
| 17 | SORIANAB | Organización Soriana | Commerce: retailing and wholesale |
| 18 | TELECOA1 | Carso Global Telecom | Communications |
| 19 | TELMEXL | Teléfonos de México | Communications |
| 20 | TLEVICPO | Grupo Televisa | Communications |
| 21 | TVAZTCPO | TV Azteca | Communications |
| 22 | WALMEXV | Wal-Mart de México | Commerce: retailing and wholesale |
| Stocks not included in the weekly databases responding to information availability. |
Source: Author's elaboration.
In this context, the basic aim was to build a homogeneous and sufficiently broad database, capable of being processed with the feature extraction techniques used in this study. Four different databases to test different expressions and periodicities of the returns on equities were built. On the one hand, two databases are expressed in returns, and the other two, in returns in excesses of the riskless interest rate. On the other hand, two of them have weekly periodicity and the other two a daily one. The weekly databases range from July 7, 2000, to January 27, 2006, and include 20 stocks and 291 observations; whereas the daily databases, from July 3, 2000, to January 27, 2006, contain 22 assets and 1491 quotations.
Extraction of underlying factors and reconstruction of the observed returns.
According to the models in Table 1, the first step was the extraction of the underlying factors by using Matlab® scripts,6 obtaining also the matrices of weights for the extraction process or demixing matrices and the matrices of loadings of the generation process or mixing matrices. For the estimation of the models, this paper used the following specifications: in PCA, the classic linear version; in FA, the Maximum Likelihood method (MLFA); in ICA, the ICASSO software based on the FastICA algorithm; and in NNPCA, a hierarchical auto-associative neural network or autoencoder.7 Secondly, the observed variables employing the extracted factors and the mixing matrices were reconstructed. This paper includes the experiments for the four techniques, the four databases, and a test window ranging from two to nine extracted factors.8
Measures of reconstruction accuracy.
To obtain a more objective measure of the accuracy of the reconstruction using the systematic risk factors obtained with each technique, some statistics widely employed to evaluate the accuracy of forecasting models in economy and finance were used, which in this context will represent measures of reconstruction accuracy. These measures, taken from Pérez & Torra (2001) and Diebold & López (1996), are the following: mean absolute error (MAE), mean absolute percentage error (MAPE), root mean square error (RMSE), Theil's U statistic (U-Theil), confusion matrix (CM), confusion rate (CR), chi-squared contrast of independence, and Pesaran & Timmermann's directional accuracy statistic (DA).
The first four are measures of reconstruction accuracy, which represent different expressions to compute the error in the reconstruction of the observed returns; these are their mathematical formulations:
Where
H
denotes the total number of observations;
h =
1, …,
H; r
h are the observed returns and
The confusion matrix is a contingency table necessary to compute the contrasts for evaluating the direction-of-change reconstruction measures, namely, confusion rate and chi-squared contrast; it is constructed in this manner:
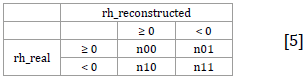
Where n ij . indicates the absolute frequency of occurrence of each condition.
The confusion rate shows the percentage of incorrect reconstructions and is calculated by:
The chi-squared
Where n i. and n.j are the marginal frequencies.
Finally, the DA statistic is another directional accuracy reconstruction measure, with distribution N (0,1), which poses a null hypothesis of independence between the observed and the reconstructed values; its interpretation is similar to the former contrast and is built as follows:
Where SR denotes the success ratio; SRI, the success ratio in the case of independence between the observed and reconstructed values under the null hypothesis, and I is an indicative function denoting the occurrence of the condition imposed inside the square brackets.10
RESULTS
Graphic analysis.
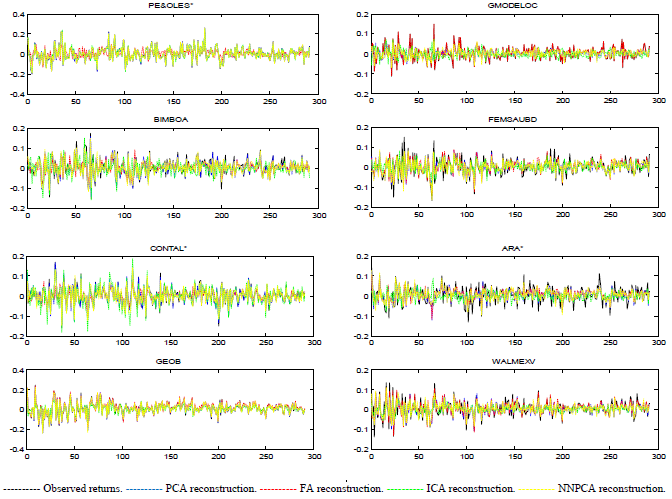
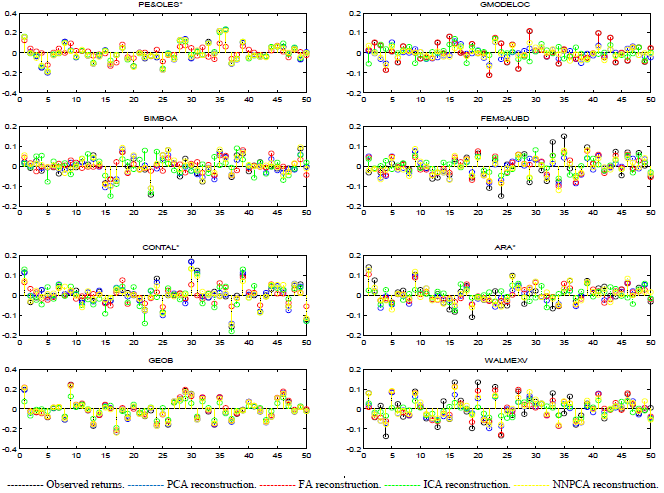
The results obtained in the reconstruction of the observed returns using the four techniques individually were outstanding at first sight for all of them, making it difficult to determine which one was the best. Figures 1 and 2 present the observed versus the reconstructed returns produced by the four techniques, from the first eight stocks of the database of weekly returns when nine factors were extracted.11 The line plots include all the observations, showing that in general, all the techniques reproduce the real values successfully for the entire period; nevertheless, if a zoom of stem plots is done for the first 50 observations, it can be distinguished that FA and ICA present greater errors in the reconstruction.
Source: Author's elaboration.
Figure 1 Observed vs. reconstructed returns. Database of weekly returns. Nine underlying factors were extracted. Line plots.
Source: Author's elaboration.
Figure 2 Observed vs. reconstructed returns. Database of weekly returns. Nine underlying factors were extracted. Stem plots.
Derived from the visual plot analysis it can be detected that, given the number of factors extracted, the four techniques fail to reproduce the highest and lowest peaks in the observations, but, if the number of factors extracted is increased from all the techniques, this problem disappears.12 In addition, it can be observed that in some cases the best reconstruction of each asset is not produced by the same technique, i.e., while some stocks are reconstructed better by one technique, other shares are better reproduced through another method. All the former results are similar for the entire case of the experiments.
Measures of reconstruction analysis.
All the foregoing measures of accuracy for each stock were computed as well as the arithmetic mean, median, and standard deviation for the MAE, MAPE, RMSE, U-Theil, and CR as proposed synthetic global measures to evaluate the errors in reconstruction for all the assets. In addition, this paper also analyses the results of the directional accuracy statistics x2 and DA individually for each stock to test the null hypothesis of independence in the reconstruction process. Therefore, all these calculations for the four extraction techniques, the four databases, and the entire testing window are replicated.
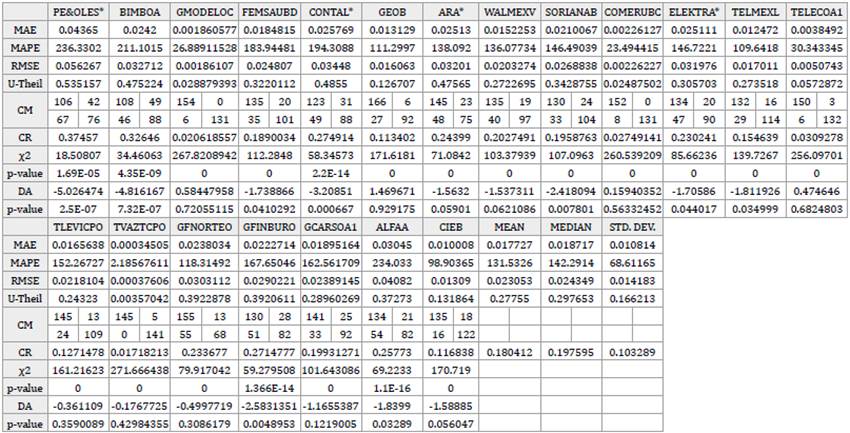
Tables 3 to 6 present the results of the foregoing experiments applied on the database of weekly returns, when nine factors were extracted, for PCA, FA, ICA, and NNPCA, respectively. First of all, it is important to remark that the results for all the techniques are outstanding and reflect a high-quality reconstruction of the returns; however, in trying to find the best of these methods the following distinctions are important. In general, regarding the measures of reconstruction accuracy MAE, MAPE, RMSE, and U-Theil, the smaller errors in the reconstruction - in terms of their arithmetic mean - points to PCA and NNPCA as the best ones. Strictly speaking, PCA scored better results in all the foregoing measures except the U-Theil statistic, but the difference between both techniques in the computed error is really small. However, NNPCA presents a smaller standard deviation of the former statistics, which means less sensitivity to the variations of mean values of the proposed synthetic measures.
Table 3 Measures of reconstruction accuracy. Database of weekly returns. Nine underlying factors extracted by Principal Component Analysis.
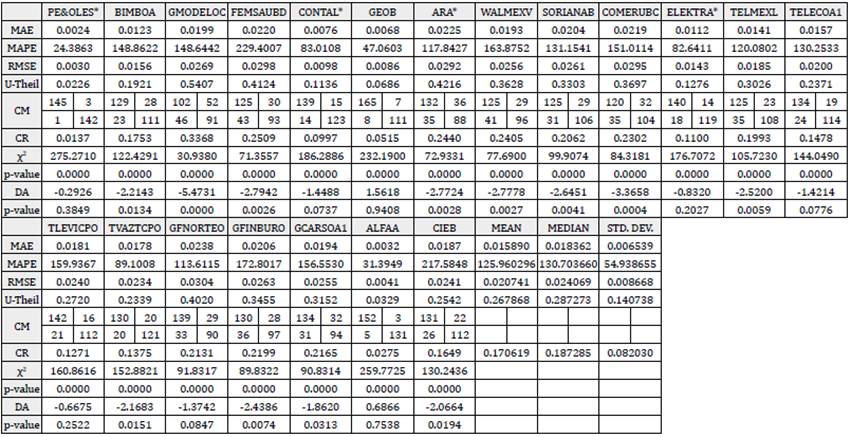
Notes: MAE: Mean absolute error. MAPE: Mean absolute percentage error. RMSE: Root mean square error. U-Theil: Theil's U statistic.
CM: Confusion matrix. CR: Confusion rate. χ2: Chi-squared independence contrast statistic. DA: Pesaran & Timmerman's directional accuracy statistic. Marked cells represent the best results for each statistic across the four techniques.
Source: Author's elaboration.
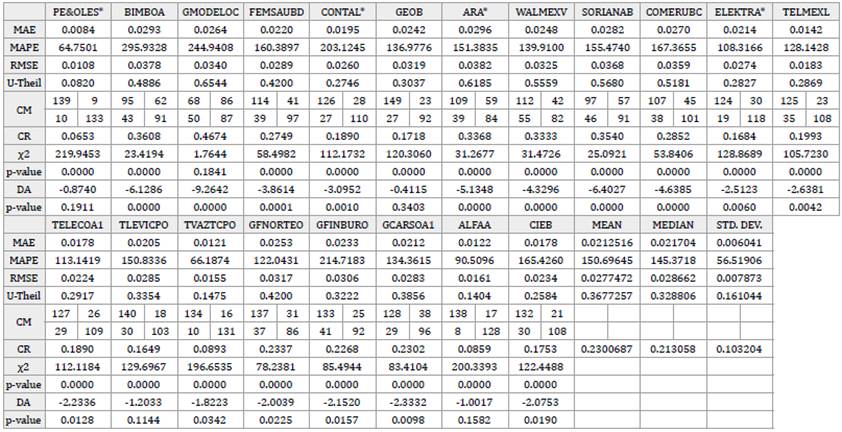
Table 4 Measures of reconstruction accuracy. Database of weekly returns. Nine underlying factors extracted by Factor Analysis.
Notes: MAE: Mean absolute error. MAPE: Mean absolute percentage error. RMSE: Root mean square error. U-Theil: Theil's U statistic.
CM: Confusion matrix. CR: Confusion rate. χ2: Chi-squared independence contrast statistic. DA: Pesaran & Timmerman's directional accuracy statistic. Marked cells represent the best results for each statistic across the four techniques.
Source: Author's elaboration.
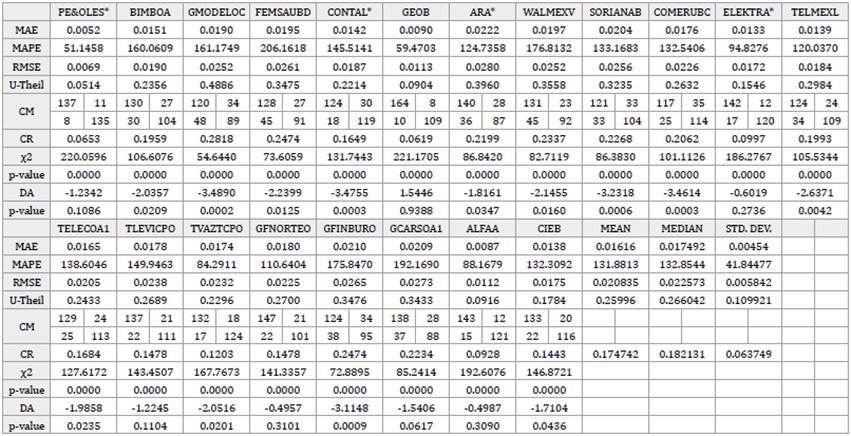
Table 5 Measures of reconstruction accuracy. Database of weekly returns. Nine underlying factors extracted by Independent Component Analysis.
Notes: MAE: Mean absolute error. MAPE: Mean absolute percentage error. RMSE: Root mean square error. U-Theil: Theil's U statistic.
CM: Confusion matrix. CR: Confusion rate χ2: Chi-squared independence contrast statistic. DA: Pesaran & Timmerman's directional accuracy statistic. Marked cells represent the best results for each statistic across the four techniques.
Source: Author's elaboration.
Table 6 Measures of reconstruction accuracy. Database of weekly returns. Nine underlying factors extracted by Neural Networks Principal Component Analysis.
Notes: MAE: Mean absolute error. MAPE: Mean absolute percentage error. RMSE: Root mean square error. U-Theil: Theil's U statistic.
CM: Confusion matrix. CR: Confusion rate χ2: Chi-squared independence contrast statistic. DA: Pesaran & Timmerman's directional accuracy statistic. Marked cells represent the best results for each statistic across the four techniques.
Source: Own elaboration.
In addition, considering that the observed variables are not normally distributed and that the median is a more suitable synthetic measure of the reconstruction accuracy, in this case, NNPCA beat PCA in all the foregoing measures except the MAPE. Regarding the CR, the results are similar; PCA obtained the lowest percentage of incorrect reconstruction in terms of mean, and NNPCA in terms of the median. Concerning the directional accuracy contrasts x2 and DA for each stock, the findings of this research show that in almost all the cases the null hypothesis of independence at 5% level of statistical significance is rejected in both tests; therefore, an association can be established between the signs of the predictions and the real values of the returns.13
In summary, in almost all cases of the study, the results point to NNPCA as the best technique for the reconstruction in terms of the mean when a smaller number of factors is retained; and to PCA, when a larger number of them are extracted, which leads us to think that NNPCA performs better than the other techniques as a dimensional reduction or feature extraction technique. In terms of the median, NNPCA surpasses the rest of the techniques in almost all the cases; besides, in the daily databases, NNPCA shows clearer supremacy over the other techniques in almost all the measures in terms of mean, median, and standard deviation. Nevertheless, this is not a rule, and for some databases, a particular number of factors, and specific measures of accuracy, the results point to other techniques as the best ones.
Additionally, to analyze the performance of each technique in the individual reproduction of the observed variables, the results of the MAE, MAPE, RMSE, U-Theil, and CR obtained in PCA were taken as benchmarks. Then, this set of benchmarks were confronted with the results from the same measures obtained with the rest of the techniques by subtracting the former from the latter. Tables 7 to 9 present said results. The findings of this research reveal that, in terms of the individual reconstruction of the observed returns, in a comparison between FA vs. PCA, ICA vs. PCA, and NNPCA vs. PCA, 50% of the stocks performed equally across these techniques; FA only surpass PCA in 20% of the reproductions -in almost all the measures-, ICA in about 5% - 10% and NNPCA in around 10% - 30%. The former results were similar in the totality of the cases and samples in the study.
Table 7 Factor Analysis (FA) vs. Principal Component Analysis (PCA). Measures of reconstruction accuracy obtained in FA minus measures of reconstruction accuracy obtained in PCA.
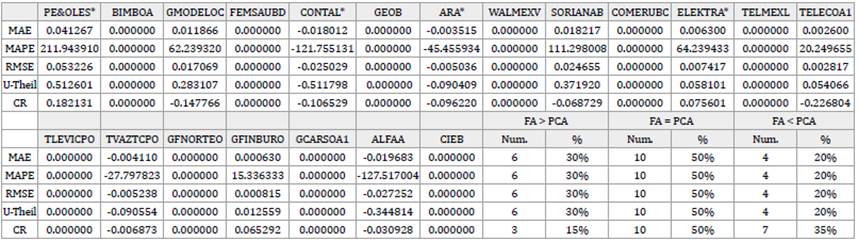
Notes: FA > PCA: Cases where FA reproduces worse than PCA. i.e., FA's error in reproduction is greater than PCA's one.
FA = PCA: Cases where FA reproduce just the same as PCA. i.e., FA's error in reproduction is equal to PCA's one.
FA < PCA: Cases where FA reproduce better than PCA. i.e., FA's error in reproduction is less than PCA's one.
Source: Author's elaboration.
Table 8 Independent Component Analysis (ICA) vs. Principal Component Analysis (PCA). Measures of reconstruction accuracy obtained in ICA minus measures of reconstruction accuracy obtained in PCA.
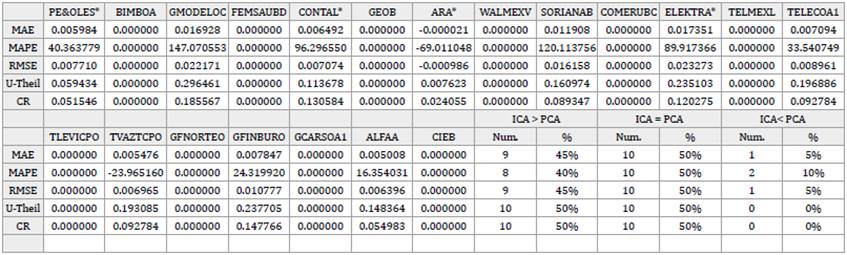
Notes: ICA > PCA: Cases where ICA reproduce worse than PCA. i.e., ICA's error in reproduction is greater than PCA's one.
ICA = PCA: Cases where ICA reproduce just the same as PCA. i.e., ICA's error in reproduction is equal to PCA's one.
ICA < PCA: Cases where ICA reproduce better than PCA. i.e., ICA's error in reproduction is less than PCA's one.
Source: Author's elaboration.
Table 9 Neural Networks Principal Component Analysis (NNPCA) vs. Principal Component Analysis (PCA). Measures of reconstruction accuracy obtained in NNPCA minus measures of reconstruction accuracy obtained in PCA.
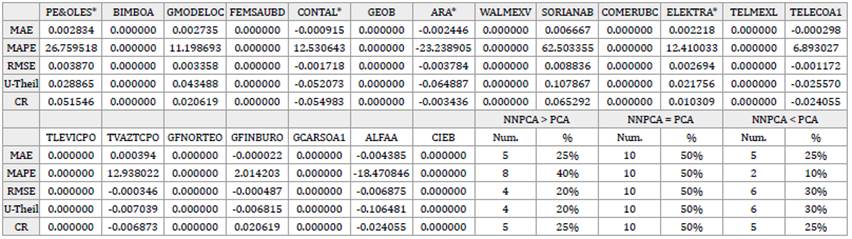
Notes: NNPCA > PCA: Cases where NNPCA reproduce worse than PCA. i.e., NNPCA's error in reproduction is greater than PCA's one.
NNPCA = PCA: Cases where NNPCA reproduce just the same as PCA. i.e., NNPCA's error in reproduction is equal to PCA's one.
NNPCA < PCA: Cases where NNPCA reproduce better than PCA. i.e., NNPCA's error in reproduction is less than PCA's one.
Source: Own elaboration.
CONCLUSIONS
From the theoretical standpoint, NNPCA constitutes the best technique, since the underlying factors extracted present better attributes; they are nonlinearly uncorrelated, warranting not only linearly uncorrelated systematic risk factors for the Arbitrage Pricing Theory (APT) model but also nonlinearly uncorrelated ones.
However, the findings in the empirical study do not demonstrate clear supremacy of one technique over the others since all the techniques successfully reproduce the observed returns; nevertheless, broadly speaking and based on its theoretical supremacy and the evidence uncovered, NNPCA can be pointed out as the best technique to reconstruct the observed returns on equities of the sample.
MLFA was the technique with the worst performance in the reconstruction; although its results were good enough, the other techniques simply performed bet-ter. However, the clarification stated in the section on matrix parallelism about the direct comparison of FA with the other kinds of analysis used in this study must not be forgotten. A future step in the research will be to compare FA to its equivalent versions for the independent and non-linear models.
According to the attributes of the components or factors produced by each technique, it can be expected that the results in the reconstruction should be better as one moves from basic techniques such as PCA and FA to advanced methods like ICA and NNPCA. However, in general, the ICA reconstruction was worse than the PCA in terms of the first four measures of reconstruction accuracy in almost all cases. Further research will be necessary to find out the reasons for these results.
Additionally, it can be concluded that the four techniques performed a successful reconstruction of the observed returns; nevertheless, the supremacy of one of them over the others is very sensitive to the number of components or factors retained, the expression of the model, and the specific asset analyzed. Consequently, it might be stated that the selection of one technique or the other will depend mainly on the number of dimensions to retain and the specific stock object of study; nevertheless, further research concerning this issue will be necessary.
Finally, some natural expansions of this work would be the search for some other measures to evaluate the accuracy of the reproduction - both in univariate and in multivariate terms - and some other methodologies to compare the results of the four techniques; a deeper study regarding the univariate and multivariate statistics and the morphology of the components and factors extracted; and the interpretation of the underlying factors of systematic risk, namely, the risk attribution process. Likewise, after having tested these techniques in a pre-crisis period free of almost any prices distortion originated by natural speculative movements during a crisis period, other extensions of this research would be the testing the accuracy of the reproduction of the observed returns produced by the multifactor generative models of returns generated by each technique in both a crisis and a post-crisis period.

