


 Inglês (pdf)
 Artigo em XML
 Referências do artigo
 Enviar este artigo por email
 Citado por SciELO
  Citado por Google
  Similares em
SciELO
Similares em
SciELO  Similares em Google
 Permalink
INTRODUCTION
In 2020 and 2021, the coronavirus disease 2019 (COVID-19) had a significant influence on people's lives in most countries. Given its widespread distribution, the World Health Organization recognized this infection as a global pandemic (Cucinotta & Vanelli, 2020). During these years, the COVID-19 pandemic radically changed the live of the population and had a great influence on the social and economic spheres of both developed and developing countries (Negrutiu, 2021). The COVID-19 pandemic impacted negatively not only the health of millions of people, but also produced a significant change in the forms and methods of their production activities. Several industries in the sphere of production and services were forced to reduce the volume of their activities, there was a break in many logistics chains, and many workers were transferred to a remote work mode. All this led to the loss of a significant share of the economically active population, layoffs in some enterprises, a decrease in revenue from the sale of finished products, an increase in prices for many goods and services, and an increase in the cost of medicines and medical care. Accordingly, a significant part of the population experienced a reduction in the disposable income of their households, as registered in various scientific publications (McKibbin & Fernando, 2020; Siche, 2020; Nicola et al., 2020). In addition, the opportunities for obtaining affordable loans have decreased, which has worsened the financial conditions for doing business (Nager, 2020). Even though more than two years have passed since the beginning of the COVID-19 pandemic, there has been an insufficient amount of scientific analysis of how this pandemic has affected people's incomes. Several articles (Deaton, 2021; Jorda et al., 2020; Morgan & Trinh, 2021) have indicated the need for a comprehensive study of the economic consequences of the pandemic and for objective and reliable information, including on the prevailing patterns of change in the income of the population in various countries. Such information is necessary for the development and implementation of measures to reduce the negative influence of the pandemic on people's lives. Taking this into account, we can state the relevance of scientifically studying the consequences of the COVID-19 pandemic on household incomes.
The aim of this study is to assess the influence of the COVID-19 pandemic on the incomes of households in various national economies in 2021. The article makes a significant contribution to the knowledge of the consequences of the COVID-19 pandemic for households in 47 countries located in Europe, Asia, Africa, Latin America, and North America.
The article is divided in five sections, including the introduction. The second section provides an overview of previous scientific studies describing the influence of the COVID-19 pandemic on adult incomes. The third section describes the methods and empirical data, as well as the design of the study. The fourth section presents the results of mathematical modeling, the evaluation of the quality of the models, as well as the analysis of variance (ANOVA). The fifth section discusses the results and tests the hypotheses. The fifth section presents the conclusions.
REVIEW OF LITERATURE
The influence of the COVID-19 pandemic on household incomes has been analyzed in scientific publications based on data from various countries. For example, studies have analyzed the differential impact of the pandemic in employment according to demographic groups in the United States (Montenovo et al., 2020). Also, a survey of the economically active population in the United States (Cooper et al., 2021) concluded that 30% of respondents experienced a significant reduction in income as a consequence of the COVID-19 pandemic. The same study showed that the highest unemployment rate (14.7%) was observed at the beginning of the pandemic (April 2020). A year later, a certain adaptation took place and unemployment dropped to six percent.
A survey (Christelis et al., 2020) of ten thousand households in economically developed European countries (Germany, France, Italy, Spain, the Netherlands, and Belgium) proved that in 2020 their income decreased by about 10% compared to 2019. Another article (Buheji et al., 2020) showed that unemployment doubled in 2020 in developing countries, which led to a catastrophic decrease in the incomes of the respective households. Morgan and Trinh (2021) arrived to a similar conclusion in the case of the ASEAN countries. They highlight the existence of a significant differentiation in the reduction of household income by country. Thus, the largest decrease in the income of the population (50%) was observed in Myanmar. Diao and Mahr (2020) also found a sharp drop in the incomes of rural households in this country. As a consequence of the COVID-19 pandemic, in Myanmar the number of households with incomes below the legally established poverty level increased by 200,000.
In the scientific publications of 2021 and 2022 much attention was paid to the types of economic activity with the greatest decrease in the income of employees. Research on the subject (Tan et al., 2022; Chen et al., 2022) concluded that such industries were the service and transport sectors. Considering six industries, Nayak et al. (2022) showed that the maximum decrease in the income of the employed occurred in the tourism and travel sector. Das (2022) also found that among the most affected by the pandemic were the employees of leisure organizations, the hospitality industry, and other services. Using as example the European Union countries, Almeida et al. (2021) showed that households with relatively low incomes were severely affected by the COVID-19 pandemic. In developing countries with low incomes, such negative consequences of the pandemic can also be noted in a decrease in the quality of nutrition (Kansiime et al., 2021), due to a reduction in purchasing power. Accordingly, the incomes of farms in such countries have significantly decreased.
Bruce et al. (2022) provided an overview of household financial assistance measures in the United States and concluded that the use of incentive measures and an expanded variety of payments and benefits proved to be insufficiently effective, since it did not ensure overcoming the long-term consequences of the pandemic.
Along with the negative consequences of the COVID-19 pandemic, positive aspects were also noted. Thus, an increase in the number of employees operating remotely (Bonacini et al., 2021) allowed some people to keep their jobs, provide additional care for children and elderly relatives, and reduce the likelihood of contracting the coronavirus infection. In some industries, the volume of work performed and, accordingly, the wages, have increased as a consequence of the pandemic. These industries include medicine and especially the information and communication technologies (Soni, 2020).
MATERIALS AND METHODS
Our study was based on an assessment of the following five indicators describing the results of a survey of representatives of the adult population of different countries on the influence of the COVID-19 pandemic on their household incomes in 2021: (1) the share of households in which there was a great decrease in income; (2) the share of households in which there was a minor decrease in income; (3) the share of households in which income remained stable; (4) the share of households in which there was a minor growth in income; (5) the share of households in which there was a great growth in income.
The survey of representatives of the economically active adult population (18-64 years old) was conducted in 47 countries within the framework of the Global Entrepreneurship Monitoring Project (2022). A survey of more than two thousand adults was conducted in each country. This project classified the countries in three groups, according to the income level of their households. In 2021 the countries of high household income were Canada, Finland, France, Germany, Ireland, Israel, Italy, Japan, Luxembourg, Netherlands, Norway, Qatar, Republic of Korea, Saudi Arabia, Sweden, Switzerland, United Arab Emirates, United Kingdom, United States. The group of countries with average household income was composed by: Belarus, Chile, Croatia, Cyprus, Greece, Hungary, Kazakhstan, Latvia, Oman, Panama, Poland, Romania, Russian Federation, Slovak Republic, Slovenia, Spain, Turkey, Uruguay. Finally, the countries with low household incomes in 2021 were Brazil, Colombia, Dominican Republic, Egypt, Guatemala, India, Iran, Morocco, South Africa, Sudan.
Five stages were implemented in the research process. The first stage included the creation of databases characterizing the responses about which of the five changes in the household income took place because of the pandemic. The second stage involved the development of mathematical models describing the distribution of the responses for each of the countries, as well as testing the quality of the developed models. The third stage involved determining the average values of each of the five indicators under consideration. Then, lists of countries were compiled, which were characterized by maximum and minimum values of the different indicators. In the fourth stage, the ANOVA analysis was carried out for groups of countries with such indicators. At the fifth stage, the results from a computational experiment were discussed.
In the course of our work, the following three hypotheses were tested:
H1: In 2021, many households experienced a decrease in income caused by the COVID-19 pandemic. The negative influence of the pandemic on the incomes of the population has been discussed in detail in several scientific publications (United Nations Committee for the Coordination of Statistical Activities, 2020; Vitenu-Sackey & Barfi, 2021; Josephson et al., 2021; Sumner et al., 2020);
H2: A small number of adults believe that they are seeing an increase in their household incomes as a result of the COVID-19 pandemic. The possibility of households increasing their income has been analyzed in several studies (Dingel & Neiman, 2020); Estrada & Mario, 2020; Han et al., 2020);
H3: The influence of the COVID-19 pandemic on household incomes has significant differences in different countries, that is, the values of the five indicators are differentiated by country. Assumptions about the existence of such differentiation have been expressed in various scientific publications (Murakami et al., 2021; World Bank, 2020; Sedegah & Odhiambo, 2021).
The development of mathematical models included the construction of normal distribution density functions in accordance with the authors' methodology (Pinkovetskaia, Nuretdinova, et al., 2021; Pinkovetskaia, Lebedev, et al., 2021). The methodology described in these articles assumes a normal distribution of the values of the indicators by country. The use of this methodology requires that the amount of empirical data for each indicator should be more than 40. In our study, the number of observations exceeded 40, as we considered 47 countries. To assess the quality of the developed functions, that is, the level of approximation to the empirical data, we used the Pearson, Kolmogorov-Smirnov and Shapiro-Fork statistical tests (con-sent criteria). The Kolmogorov-Smirnov agreement test is used to compare two distributions: empirical and theoretical. It is based on determining the sum of the accumulated discrepancies between two such distributions. If the differences bet-ween them are not significant and do not reach a critical value, it can be concluded that the approximation is of high quality. The Pearson agreement test is based on grouped data and allows the comparison of an empirical distribution describing a specific indicator with the density function of the normal distribution corresponding to this indicator. The criterion answers the question of whether different values of the indicator occur with the same frequency in empirical and theoretical distributions. The greater the discrepancy between the two distributions, the greater the empirical value of the Pearson criterion. The Shapiro-Wilk agreement test is used to verify that the distribution of empirical data corresponds to the normal law. A comprehensive assessment of the quality of the developed functions using the three specified tests of agreement with their simultaneous implementation allows us to evaluate the quality of the approximation of the initial data.
The main advantage of the developed functions is that estimates of the studied indicators as averages and standard deviations are displayed directly in the formulas.
As is known from the theory of normal distribution functions, using these two estimates it is possible to determine the ranges in which the values of the considered indicators are located for the majority (68%) of the countries studied. In addition, countries can be identified where the indicators under consideration take values larger than the upper limits of these ranges (maximum values) and smaller than the lower limits of the ranges (minimum values). Accordingly, the maximum values are those that are greater than the sum of the average values and standard deviations, and the minimum values are those that are less than the difference between the average value and the standard deviation. Considering this, in the course of the computational experiment lists of countries were formed in which the maximum and minimum values of the indicators under consideration were observed. Then, for each of the indicators, a comparative analysis of two groups of countries was carried out, respectively, with the minimum and maximum values of the indicators. At the same time, a one-factor analysis of variance based on the ANOVA method was used (Ostertagova & Ostertag, 2013). The analysis included an assessment of the existing differences between intra-group variance and inter-group variance for groups of countries with maximum and minimum values of indicators. The analysis of variance allowed us to check how much the variance caused by the difference between groups of countries was greater compared to the variance caused by intra-group differentiation. That is, it allowed us to establish the existence of significant differences between groups of countries with maximum and minimum values of each of the indicators.
RESULTS OF THE CALCULATION EXPERIMENT
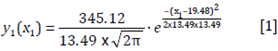
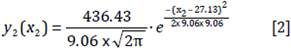
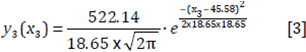
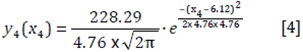
The modeling of the data characterizing the values of the considered indicators was based on the development of normal distribution functions. Such functions (y) describe the distribution of specific weights (x, %) in the forty-seven studied countries of the number of adults who chose one of the five answers to the question about changes in their household incomes in 2021. The corresponding functions are demonstrated below:
• the share of households in the surveyed population in which there was a great decrease in income
• the share of households in the surveyed population in which there was a minor decrease in income
• the share of households in the surveyed population in which income re-mained stable
• the share of households in the surveyed population in which there was a minor growth in income
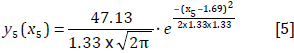
• the share of households in the surveyed population in which there was a great growth in income
After the normal distribution functions were developed, the accuracy of the approximation of the initial empirical data, namely the distribution of the values of each indicator by country, was evaluated using three tests. A comprehensive assessment showed that for all three tests (Shapiro-Wilk, Pearson and Kolmogorov-Smirnov) there was a high quality of approximation of the empirical data.
The developed functions [1]-[5] allowed us to formulate patterns characterizing the distribution of each of the indicators by country. Some of them are shown in Table 1. The second column of this Table shows the average values of the indicators for all the countries studied. The third column of Table 1 describes the boundaries of the ranges in which the values of indicators for most of the studied countries are located.
Table 1 Values of Indicators Describing the Influence of the Pandemic on Household Incomes
| Indicator | Mean values | Values for most countries |
|---|---|---|
| 1 | 2 | 3 |
| Share of households in the surveyed population in which there was a great decrease in income | 19.48 | 5.99-32.97 |
| Share of households in the surveyed population in which there was a minor decrease in income | 27.13 | 18.07-36.19 |
| Share of households in the surveyed population in which income remained stable | 45.58 | 26.93-64.23 |
| Share of households in the surveyed population in which there was a minor growth in income | 6.12 | 1.36-10.88 |
| Share of households in the surveyed population in which there was a great growth in income | 1.69 | 0.36-3.02 |
Source: The calculations are carried out by the authors based on functions [1]-[5].
Of considerable interest is the identification of countries in which the maximum and minimum values of each of the studied indicators were observed in 2021. As mentioned earlier, the maximum values are those that are greater than the upper limits of the ranges described in the third column of Table 1. The minimum values are those that are less than the lower limits of the ranges described in the third column of Table 1. The lists of countries for which such indicator values were noted are shown in Table 2.
At the next stage of the study, the ANOVA analysis was performed. It is based on a comparative analysis of two groups of countries. The first group includes countries with maximum values of the indicator, and the second group includes countries with minimum values of the same indicator. An ANOVA analysis was carried out for each of the five indicators considered by us. The results of the ANOVA analysis are displayed in Table 3. The Table shows statistical estimates for groups of countries with maximum and minimum values, for each of the indica-tors. The average values of the indicators are shown in the first and second rows. The variances for each group of countries with maximum and minimum values of indicators are shown in the third and fourth rows of this Table. In the fifth and sixth rows, respectively, the intergroup and intragroup variances are presented. The calculated and critical statistics according to the Fisher criterion, as well as the significance levels, are shown below.
Table 2 Countries with Maximum and Minimum Values of Indicators
| Indicator | Maximum values | Minimum values |
|---|---|---|
| 1 | 2 | 3 |
| Share of households in the surveyed population in which there was a great decrease in income |
Brazil [36.0] Kazakhstan [37.1] Dominican Republic [38.8] Panama [40.5] South Africa [41.3] Morocco [42.0] Colombia [42.5] Egypt [45.2] India [48.7] Sudan [61.4] Two countries are in Asia, four in Latin America, and four in Africa. Household income: medium [two countries], low [eight countries]. |
Republic of Korea [1.5] Norway [2.6] Germany [4.3] Finland [4.6] Netherlands [4.9] Sweden [5.6] Switzerland [5.6] Luxembourg [5.7] Seven of these countries are in Europe, one in Asia. All eight countries have high household income. |
| Share of households in the surveyed population in which there was a minor decrease in income |
Poland [37.0] Panama [37.5] Slovak Republic [37.9] India [42.1] Kazakhstan [55.7] Located in Europe [two countries], Asia[two countries], Latin America [one country]. The income of the households is medium [four countries], low [one country]. |
Norway [8.8] Finland [13.1] Netherlands [13.2] Luxembourg [15.0] Sweden [15.1] Germany [16.5] Switzerland [17.4] All seven countries are in Europe and all have high household income. |
| Share of households in the surveyed population in which income remained sTable |
Japan [65.5] Germany [68.0] Switzerland [70.5] Luxembourg [71.9] Finland [72.4] Netherlands [72.4] Norway [81.3] Six countries are in Europe, one in Asia. All seven countries have high household income. |
Kazakhstan [6.7] India [7.7] Panama [16.4] Sudan [16.8] Colombia [17.3] Dominican Republic [17.4] Egypt [19.9] Morocco [24.7] Guatemala [25.8] Two countries are in Asia, four in Latin America and three in Africa. Two countries have middle household income and seven low. |
| Share of households in the surveyed population in which there was a minor growth in income |
Canada [11.1] Sweden [17.1] Republic of Korea [17.5] Croatia [25.6] Three countries are in Europe, one in Asia. Two are of high household income and one of middle. |
Morocco [0.5] Kazakhstan [0.6] Oman [0.7] India [0.9] Iran [1.0] Four countries are in Asia and one in Africa, three with middle household income and one with low. |
| Share of households in the surveyed population in which there was a great growth in income |
Canada [4.2] Dominican Republic [4.2] Croatia [4.3] South Africa [4.3] United Arab Emirates [4.4] United States [4.8] One country is in Europe, two in North America, one in Asia, one in Latin America, and one in Africa. Household income: high [three countries], medium [one country], low [two countries]. |
Kazakhstan [0.1] Republic of Korea [0.1] Cyprus [0.1] Iran [0.1] Morocco [0.1] Oman [0.2] Slovak Republic [0.2] Two of these countries are in Europe, four in Asia, and one in Africa. High household income occurred in one country, middle income in four, and low income in two. |
Source: Developed by the authors with data from Table 1 and from the Global Entrepreneurship Monitoring project.
Table 3 Statistical Characteristics Describing Groups of Countries with Maximum and Minimum Values of Indicators
| N.° | Statistical characteristics | Household income indicators by country | ||||
|---|---|---|---|---|---|---|
| Indicator 1 | Indicator 2 | Indicator 3 | Indicator 4 | Indicator 5 | ||
| 1 | Average for countries with maximum values of indicators, % | 43.35 | 42.04 | 71.71 | 17.83 | 4.37 |
| 2 | Average for countries with minimum values of indicators, % | 4.35 | 14.16 | 16.97 | 0.74 | 0.1 |
| 3 | Variance for countries with maximum values | 54.06 | 62.44 | 24.46 | 35.44 | 0.05 |
| 4 | Variance by country with minimum values | 2.36 | 8.06 | 42.30 | 0.04 | 0.01 |
| 5 6 | Variance between groups of countries with maximum and minimum values | 6760.02 | 2267.57 | 11801.88 | 648.66 | 58.81 |
| Variance inside groups of countries with maximum and minimum values | 31.44 | 29.81 | 34.65 | 15.21 | 0.03 | |
| 7 | Fisher criterion | 215.03 | 76.07 | 340.60 | 42.64 | 2205.54 |
| 8 | Critical value according to the Fisher criterion | 4.49 | 4.96 | 4.60 | 5.59 | 4.84 |
| 9 | Significance level | less 0.01 | less 0.01 | less 0.01 | less 0.01 | less 0.01 |
Source: Calculated by the authors based on household income indicators
DISCUSSION
For the countries under consideration, the average value of the proportion of adults surveyed who indicated a strong decline in their household incomes in 2021 was almost 19.5%, almost one in five. It should be noted that in 28 countries the values of the first indicator were lower than the average level, while in 19 countries they were higher. The national average value of the second indicator, namely the proportion of the adult population that indicated a slight decrease in their household income, was 27.1%. This was almost 1.4 times more than the average value of the first indicator. In 24 countries the value of the second indicator was below the average level. In one country, namely Cyprus, the value of this indicator coincided with the average value. Values above the average level were observed in 22 countries. The percentage of adults surveyed who reported a strong or a slight decrease in household income was 46.6% in 2021. Consequently, almost half of the households had a certain decrease in income. Thus, the first hypothesis was confirmed. A decrease in household dis-posable income, as described in Handriyani et al. [2018], negatively affects people's livelihoods, since it reduces their expenses and their opportunities to invest.
The average proportion of the adult population who did not feel the influence of the COVID-19 pandemic on their household incomes in 2021 was 45.6%. That is, the average value of the third indicator for the countries under consideration approached the sum of the average values of the first and second indicators. The values of the third indicator in 22 countries were lower than the average, and in 25 they were higher. In our opinion, the relatively high values of the third indicator in most countries are due to the following factors: a large number of adults work in organizations and enterprises such as state and municipal administrations, higher and secondary education, scientific activities, transport, communications, mining, in which there is a fixed salary; in many countries, in particular economically developed ones, governments have implemented measures to compensate for the loss of income of their workers; also, a significant number of people, including entrepreneurs and employees, performed their functions online.
The average value of the proportion of surveyed adults in the countries under consideration who indicated a slight increase in their household incomes in 2021 was almost 6.1%, that is, approximately one in sixteen respondents. It should be noted that the values of the fourth indicator were lower than the indicated average level in 30 countries, while in 17 countries they were higher. The national average value of the fifth indicator, namely the proportion of the adult population that indicated a significant increase in their household income, was 1.7%. This was almost four times less than the average value of the fourth indicator. In 27 countries the values of the fifth indicator were below the average level for the countries under consideration, while in 20 countries were lower. The number of adults surveyed who reported a significant or slight increase in their household income was 7.8% in 2021. This leads to the conclusion that an absolute minority of adults surveyed indicated a positive influence of the COVID-19 pandemic on their household incomes. Therefore, the second hypothesis was confirmed. The industries that saw an increase in household incomes in 2021 included healthcare, online trade, courier delivery of goods, including food, and services in the field of information and communication technologies.
The level of differentiation of the values of the considered indicators for different countries was checked using the average values and standard deviations given in Table 2. The calculated variation indices were 69.2% for the first indicator, 33.4% for the second indicator, 40.9% for the third indicator, 77.8% for the fourth indicator, and 78.7% for the fifth indicator. Since all the variation indices are greater than 33%, it can be concluded that there is a significant differentiation of values for all five indicators under consideration. Thus, the third hypothesis was confirmed.
The information given in the second and third columns of Table 2 allows us to draw conclusions about the geographical location of the countries with maximum and minimum values for each of the five indicators under consideration, as well as about the level of income of the population in these countries. Analysis of this information showed that the minimum values of the household weights in which both a strong and a slight decrease in income was observed [the first and second indicators] were in countries located in Europe. Only one country, Republic of Korea, is in Asia. All these countries are characterized by a high level of income of the population. The maximum values of the third indicator describing the specific weights of households that retained their incomes were observed in European countries, as well as in Japan. All these countries are characterized by high income levels. The maximum and minimum values of the fourth and fifth indicators, the maximum values of the first and second indicators, as well as the minimum values of the third indicator were registered in countries located in different parts of the world and characterized by different levels of income.
The analysis of the data in the first and second rows of Table 3 indicates large differences in the average values between groups of countries characterized by maximum and minimum values of indicators. In general, the analysis of the information given in Table 3 shows that there are significant differences between the groups of countries with maximum and minimum values of each of the five indicators considered in the article. This conclusion follows from the comparison of the intergroup and intragroup variances given in the fifth and sixth rows of Table 3. The data presented in the last three rows of this Table indicate the high quality of the ANOVA analysis. This is confirmed by the fact that the calculated values of the Fisher criterion [seventh line] are much larger than the critical values of this test [eighth line]. In addition, for all indicators, the significance levels are less than 0.01, that is, with a probability of 99%, the assumption of a significant difference between the groups of national economies with extreme values of each of the five indicators is confirmed.
CONCLUSIONS
Our article demonstrates the results of the assessment of the effects of the COVID-19 pandemic on household incomes in 47 countries in 2021. This article is scientifically original and contributed to generate new knowledge about the changes in household incomes caused by the pandemic in the following ways:
It implemented the authors' methodological approach to assess five types of impact of the pandemic on household incomes based on the functions of normal distribution;
it proved that almost half of the households [46.6%] had a certain decrease in household income due to the pandemic. Slightly less [45.6%] was the proportion of households in which income remained stable. An absolute minority [7.8%] of households experienced income growth;
it showed that there are significant differences between countries for each of the five indicators;
it compiled lists of national economies, in whose households there were extreme [highest and lowest] values of indicators, and it also proved that the groups including these countries had significant differentiation in terms of indicators.
The new knowledge gained as a result of our research contributes to understand the impact of the COVID-19 pandemic on household incomes in 47 national economies. These results are of interest to governments, financial and credit organizations, and the society as a whole. The methodology of modeling the territorial distribution of the values of indicators described in our article can be applied to a comparative analysis of the consequences of the pandemic on household incomes by region in each of the countries under consideration.
Overcoming the consequences of the COVID-19 pandemic associated with a decrease in household incomes requires urgent political decisions. First, it is necessary to implement comprehensive measures to resume production processes and create jobs for people who have become unemployed in recent years. To do this, investments in basic industries should be stimulated, grants should be allocated to small businesses and the self-employed, and free retraining of workers employed in the most affected types of economic activity should be provided. A second set of measures should aim at preventing future pandemics, for example by reducing the accumulation of a large number of transport passengers during peak hours in large cities, by allowing greater flexibility in the schedules of work and study, by transferring workers and students to remote forms of activity based on intelligent offices, or by reducing the risks of cross-infection. Digital technologies and informatization can play a special role by solving many tasks by automating processes based on the Internet of Things, introducing robots, cloud computing and processing large amounts of data. In industries where there was a maximum decrease in the production of goods and the provision of services, governments should reduce taxes, fees, and social and health insurance rates, especially for small businesses.
The study had limitations on empirical data because only 47 countries were considered. Further research could assess the consequences of the pandemic in 2022

