


 Español (pdf)
 Articulo en XML
 Referencias del artículo
 Enviar articulo por email
 Citado por SciELO
  Citado por Google
  Similares en
SciELO
Similares en
SciELO  Similares en Google
 Permalink
INTRODUCTION1
The onset of the COVID-19 pandemic led to a series of social distancing measures (closure of bars, restaurants, shopping centers and schools, suspension of mass events, and residential confinement) aimed at preventing an increase in the number of cases and, in the absence of accurate treatment, deaths in the vulnerable population. This series of measures, including residential confinement or better known as stay-at-home, implemented by the vast majority of countries around the world, are known as non-pharmaceutical interventions (NPIs). Several studies have analyzed the effectiveness of this policy (Andersen, 2020; Ferraresi et al., 2020; Kong & Prinz, 2020; Yilmazkuday, 2020), as well as the determinants that motivate people to residential confinement (Bargain & Aminjonov, 2020; Müller & Rau, 2020).
However, these public policy measures are also affected by the employment situation in each country. One of the main challenges, regarding the labor market, is the population with informal jobs. It is important to mention that informal employment is of particular concern when evaluating the impact of the economic and health crisis caused by the COVID-19 pandemic, as recent research and international organizations have shown (Altamirano et al., 2020; International Labour Organization ILO, 2020; OECD, 2020). On the public health side, informal workers lack social security, making them especially vulnerable to lack of access to medical services in case of infection. In addition, in terms of the health situation in countries with higher rates of informal labor, it is this lack of access to medical services that makes their populations less healthy and therefore more likely to have the co-morbidities that increase coronavirus mortality (hypertension, diabetes, obesity).
On the economic side, informal workers and their households are highly dependent on the income they generate on a daily basis, as their situation of informality deprives them of job stability and income. This is especially important in times of the coronavirus, since this sector depends on going out to work daily to cover the basic needs of the household (Loayza & Pennings, 2020). This makes it impossible for them to stay out of work for long periods of time and, since most of these jobs cannot be done at home (Dingel & Neiman, 2020), a public policy of staying at home puts their daily subsistence at risk.
Additionally, governments face another economic problem due to the large portion of informal workers. The fiscal and institutional capacity of these countries is less effective in responding to the pandemic. This is because informal employment does not pay taxes as much as formal employment does.
According to ILO's2 estimates, the impact of the emergency closure of the economy during the first month of the confinement on the income of informal workers has been a 60% reduction globally. In sectors with higher rates of informality, such as Africa and Latin America, the estimated reduction is 81%. This is of enormous concern for countries in these regions, where poverty rates could increase considerably in the face of less social assistance and job security.
Likewise, there have been several social implications due to characteristics such as resilience, flexibility and economic tensions within a country. For example, the short-term consequences for the informal labor market depend on the country's level of socioeconomic development. The lack of control over these jobs reduces the room for maneuver by federal and local governments in public budgets (Loayza & Pennings, 2020). Similarly, there is an additional issue to consider when segmenting labor force by gender. The informal employment sector has a larger portion of women than men. More than 60% of the women who work in countries with a low to medium income level do so in the informal sector (Gausman & Langer, 2020; Langer et al., 2015).
In a context of job instability, household cash flow becomes vital for survival during pandemic lockdowns. This is relevant because households that suddenly see their income drop try to smooth their consumption by using available savings. However, even in developed countries, there is evidence of a lack of savings for household expenses over very long periods (Catherine et al., 2020). Therefore, a public policy of emergency closure that doesn't consider the labor context of each region could aggravate the effects in the informal sector. This accentuates the economic impact of the pandemic as the informal sector is also integrated with formal employment, and it has been proposed to gradually incorporate both sectors (formal and informal) in order to record and plan short- and medium-term public policies that help, first, contain the effects of the lack of social protection of the informal sector and, second, improve the quality of the labor market (Narula, 2020).
Mexico is one of the 20 largest economies in the world. Despite this, it is also a developing country, with 41.9% of the population living below the national poverty line and more than half of the workers in the informal sector (INEGI, 2020b; The World Bank, 2015). Nevertheless, these informal workers are not homogeneous. In fact, at the income level there is also enormous heterogeneity. Additionally, it is important to mention that Bloomberg published a ranking of the 53 largest economies in the world ordered by level of resilience at the time of the current pandemic. Mexico is in the 53rd place, that is, the least resilient. This makes it, according to the study, the worst place to be during the coronavirus era (Bloomberg, 2020a, 2020b). This is of particular concern because, as discussed in other papers on COVID-19 (Tejedor Estupiñán, 2021), the problems related to pandemic and vaccination reveal the weaknesses of health care systems.
LITERATURE REVIEW
This paper is not the first to consider the effects of the current COVID-19 pandemic on Mexico. For example, the effects of COVID-19 on the Mexican economy have already been discussed (Esquivel, 2020). Similarly Esquivel and Campos-Vázquez (2020) calculated the effect of the crisis on the population in different ways, seeing as consumption has been affected by restrictions on urban mobility. Additionally, several studies have been conducted, using input-output matrices, on how different sectors, regions and vulnerable populations of the Mexican economy will be affected (Chapa, 2020). The effect of residential confinement has been studied in other papers for Mexico, such as Rangel et al. (2021) or for some other countries, such as in Testa et al. (2021). However, the latter does not consider the cross effects or the informality separations examined in our paper. We can also find in the literature other contributions looking for answers to similar questions, such as food security and the impacts it has on agriculture, as shown in Luque Zúñiga et al. (2021) and Moreno Salazar Calderón (2021), where these phenomena can be understood due to the link between food production and informality.
It has also been studied how the temporary closure of the construction, service and manufacturing industries leads to an increase in the number of economically active people joining the informal sector (Mendoza Cota, 2019). Furthermore, Mexican households that depend on informal labor income, coupled with low access to formal credit, are substantially less likely to work from home, which may contribute to increased inequality (Peluffo & Viollaz, 2020).
However, these studies have not considered the effect that residential confinement has on the growth of the number of confirmed COVID-19 cases and vice versa and the role of informality in how people have responded to public policy on staying at home and how people choose to isolate themselves residentially in the face of the rising pandemic.
The main contribution of this article to the literature is to evaluate, through the regions separated by levels of informality, the effect of the policies of social distancing, especially residential isolation, implemented to reduce the spread of the virus. In addition, our approach allows us to visualize whether the growing number of confirmed cases causes, within the employment possibilities of households, an increased need to stay at home.
METHODOLOGY
Residential confinement and the number of COVID-19 cases are closely related (Andersen, 2020; Engle et al., 2020; Yilmazkuday, 2020; Zhu et al., 2020). Among the first works to understand this relationship is that of Maloney and Taskin (Maloney & Taskin, 2020), who used a panel regression to identify the determinants of social distancing and economic activity. One of their main findings is that the greater the number of registered cases, the more people tend to stay at home, trying to reduce the probability of contagion. This suggests that, as cases and deaths increased during the COVID-19 pandemic, people perceived a greater risk of being infected and thus limited their outward movements.
Moreover, Milani (2020) shows the endogenous effects between these two variables by using GVARs (global autoregressive vectors). This is done mainly because obtaining a beta coefficient in the regressions does not consider the interdependence of these two variables. That is, an increase in effective residential confinement should decrease infections. While an increase in cases should generate incentivize staying at home to avoid infection.
Model
As mentioned above, each category (very low, low, high and very high) is made up of 8 states in the Mexican Republic. A PVAR system of order L is estimated for each category, represented by the following systems of equations:
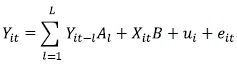
Where Y it is a (1x3) vector of endogenous variables, viz.: change in residential confinement, daily growth in confirmed cases, the mood on Twitter. X it is a (1x3) vector of exogenous variables made up of paydays, weekends, and weather alerts. u i . and e it are (1x3) vectors representing the specific fixed effect of the endogenous variables and the idiosyncratic errors, respectively. The (3x3) A ¡ and B matrices are the parameters to be estimated.
Modeling the system using the VAR panel will allow us to capture the effect of the increase in confirmed daily cases on residential concentration and vice versa. In fact, the purpose is to identify an inverse effect. That is, while an increase in the number of cases of infection should alert people and increase their concentration in residential areas, the increase in concentration in residential areas should cut off the channels of spread of the pandemic and decrease the growth in daily cases. This will not be captured by a simple regression where one variable remains dependent on the other. For our case, having in the endogenous PVAR the variables that we want to calculate their effects, we expect to obtain these effects in different directions.
Additionally, separating the sample by informality for each PVAR will allow us to evaluate the average effect for each set. It is expected that, despite the level of informality, an increase in residential confinement will decrease the transmission of the virus. Conversely, in the face of an increase in the number of cases, states with less informality would have greater opportunities to react and stay at home.
For each PVAR, estimates were made using the library developed by Abrigo and Love (2016) and the selection of the model by Akaike's criteria (Akaike, 1969). In the generation of the impulse-response functions (IRF), it was verified that all the systems of equations complied with the stability condition, and the graphs for the orthogonal and accumulated IRF were generated to visualize the aggregate effect (Lütkepohl, 2005; Sims, 1980).
Also, consistent results must be obtained for the exogenous variables. Intuitively, it is expected that weekends and paydays will decrease the concentration in residential areas, and, on the other hand, storm warnings will increase it. The former is due to the fact that on weekends and paydays people go out to buy basic necessities, even when mobility restrictions exist. In addition, with these dummy variables, a large part of the seasonal effects is controlled on a weekly basis. The latter is expected even for regions with high informality, since storms generate rain and winds that make economic activity impossible.
DATA
Three databases are used for the analysis. First, the daily confirmed cases by state (Gobierno de México & Secretaría de Salud, 2020). It is understood that Mexico only tested people with symptoms or who had contact with confirmed cases. This may substantially affect the true number of cases because of the number of asymptomatic infections not counted in this indicator. However, for the first objective of the analysis, which is to identify the reaction of staying at home due to the increasing number of infections, the indicator of daily cases per state is still useful because such data has been reported and socialized by federal and local governments. For our second objective, which is to evaluate the public policy implemented for the so-called "stay-at-home", it is expected that the population has socialized the symptoms, people respond by doubting that they have been infected, and therefore try to get the government to test them.
Our second source of information is Google's Mobility Reports (Google LLC, 2020). On the concern that the amount of people who have smartphones might not be enough to validate this statistic, Google assures that for the days and/or regions that do not have the necessary information to generate each indicator (due to the anonymization and privacy protection of the data), a lost value is reported. For the database used and the indicator of concentration of residential areas, we have complete panels. The residential zone indicator helps to evaluate the stay-at-home policy. It is not combined or entered into any model that includes another Google Mobility Reports indicator (retail, grocery, parks, transportations and workplaces) because it is noted that the residential indicator has a different measurement methodology.
For the first five indicators, the number of visitors recorded in the classification of these places is used, while for residences the main indicator used is the time people stay at home. This is helpful for this work because people already spent a considerable amount of time at home prior to the pandemic, mostly for rest and leisure, and, presenting the indicator differently, there would be no way to control for this effect of time spent at home with the data available for Mexico.
Third, the mood of the Mexican Twitter users is used (INEGI, 2020c). This indicator is provided and generated by the National Institute of Geographic and Statistics (INEGI) of Mexico for all states on a daily basis. This makes a perfect match between the level of frequency and disaggregation of the two previous databases. This indicator is used because it approximates the amount of news, ideas, and collective encouragement regarding the pandemic. All these three indicators are included in the Panel Vector Autoregression model (PVAR) as endogenous variables.
Additionally, three exogenous variables are added in the form of dummy variables: weekends, paydays, and weather alert days (for each state and day that the National Weather Service issued hurricane, storm or tropical depression warnings) (CONAGUA, 2020).
These indicators are used not only because they are appropriate for our analysis, but also because they have been used in other articles with similar objectives and have been reviewed nationally and internationally by experts in the field. For example, the number of COVID-19 cases in Mexico has already been used to frame discussions on the effects of certain population behaviors on them. In the case of Gasca et al. (2022), for example, statistical inferences are made about vaccination against COVID-19. The Google mobility reports indicator has also been used in other studies to understand economic phenomena, as seen in Milani (2021) and Yilmazkuday (2020). Moreover, it has been shown that the use of the indicator "Mood of Twitter" for Mexico is useful for identifying how information is transmitted through social networks, as shown in Leyva (2020).
Table 1 shows Mexican states separated by their level of informality (Very Low, Low, High & Very High). For each panel, the first column shows the state, the second column shows the proportion of workers who are in the informal sector, the third column shows the state's GDP per capita in international dollars in 2019, and the fourth column gives an international comparison (with respect to GDP per capita in 2019). The last two columns are intended to show the heterogeneity of wealth across states. At the end of each panel the mean and standard deviation of each group is reported, and at the end of the table these two descriptive statistics are also reported for the 32 states. It is important to mention that Campeche has those values for oil production.
For example, Aguascalientes is a Mexican state with an informality ratio of 40.94% and a GDP per capita of $23,390 international dollars per year, matching that of Argentina. On the other hand, Guerrero has an informality ratio of 77.63% and a GDP per capita of $6,546 international dollars, which makes it comparable to India. In terms of production per person and informality, Mexico is highly heterogeneous.
Table 1 Mexican States by Groups of Informality
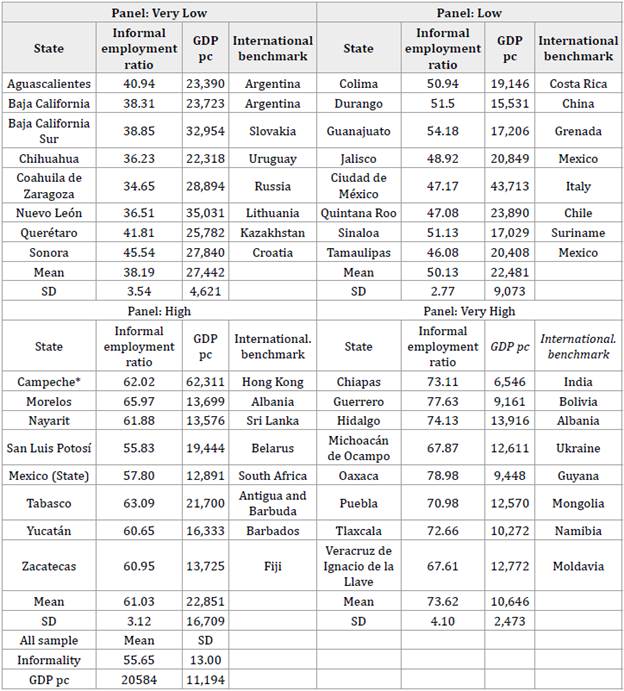
Source: Authors' own elaboration with with INEGI (2020b) and World Bank (2015) data.
Figure 1 shows on the map of Mexico the groups of states by level of informality described in Table 1. It can be seen that the northern region of Mexico is home to a large number of states in the Very Low informality group. The greater number of formal jobs with respect to the total labor market is largely due to the presence of the manufacturing sector in the region. On the other hand, the south and southeast of Mexico have a greater number of informal jobs than the other regions. This is due to the fact that there is more informal trade and tourism-related activities in the region.
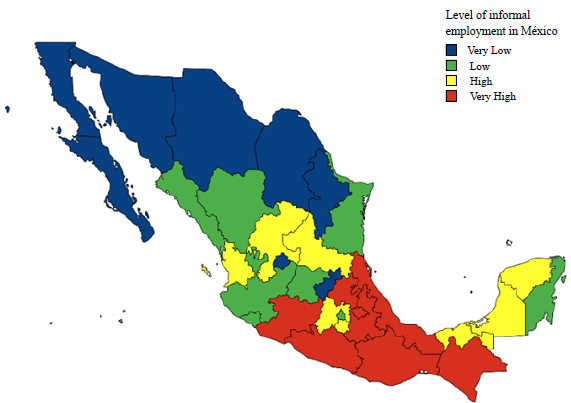
For the southern states, it is important to note that, in the presence of their informal sector, they also have a greater primary activity than the northern states with less informality. For example, according to the Economic Information Bank (INEGI, 2020a), Nuevo León is a northern state with 36.51% of informal workers with respect to its total labor market, and the primary activity sector (which includes agriculture, animal husbandry, forestry, fishing and hunting) represents 0.46% of its gross state domestic production.
On the other hand, Oaxaca, being a southern state with a 78.98% rate of informality, has a primary activity sector that represents 6.05% of its total gross domestic product. In the case of tourism, it has been reported that the southern states, where the most informal activities are concentrated, have been the most affected by the pandemic in this sector (Banxico, 2020).
RESULTS3
Effects on the aggregate for the 32 states of Mexico
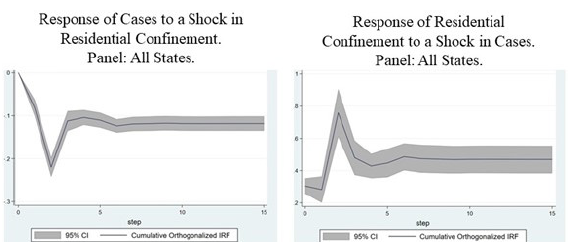
Figures 2, 3, and 4 show the cumulative orthogonalized impulse response functions (COIRF) for the panels referred to in each figure. For each graph, the x-axis represents 15 periods (in this case, days) forward from the unexpected shock known as impulse. The blue line is the response to an unanticipated impulse of one variable over another. The gray region of the graph is the 95% confidence intervals.
For the first graph in Figure 2, the COIRFs were made by including all 32 states in the panel. We can see that the unanticipated momentum of residential concentration causes a negative response in cases that stabilizes in the seventh period. It is important to note that, for this graph, the response starts from zero, indicating that a higher concentration in residential areas does not have immediate effects, but rather they tend to appear and stabilize after one week. On the other hand, the second graph in Figure 2 represents the response of the residential concentration to an unanticipated surge of cases. In this case, the response is positive and different from zero since the beginning of the shock. This confirms the importance of clearly communicating the surge in cases so that people can become aware of the pandemic. Importantly, for the COIRFs to be statistically significant, the confidence interval must exclude zero over the estimated time horizon. This confirms that staying at home has combated the spread of the virus, and for an increase in the number of cases, people respond by staying more in residential areas. Modeling with PVAR the relationships between infections and residential isolation offers the possibility of verifying the direction of the effects, while a linear model would not be clear about causality.
Effects on groups of states by informality
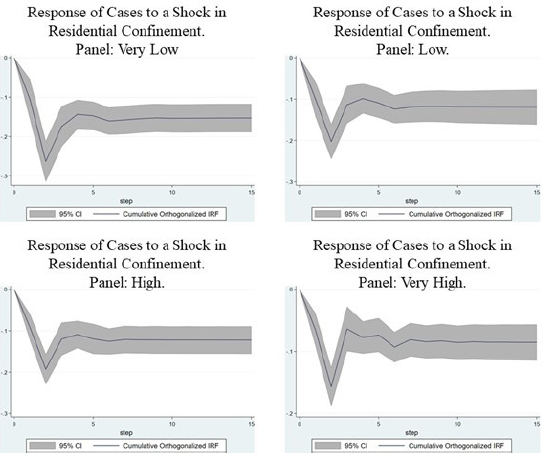
Separating states by groups of informality produces heterogeneous results. Figure 3 shows the impulse response functions of the growth in cases of residential isolation shock.
It can be seen that, although for all groups this response is negative, for states with less informality this response is greater than for those with greater informality. As the group's informality increases, the response is even smaller. This indicates that the "stay home" public policy has been effective, as also shown in the PVAR with all states. However, staying home has been more effective for those states with less informality.
This result is in line with the fact that states with a large informal labor market have fewer people who are likely to stay home and that efforts by people who have been able to isolate themselves residentially have had less effects in terms of mitigating contagion.
Source: Authors own elaboration.
Figure 3 Response of Residential Confinement to a Shock in Cases by Group of Informality
As noted in Figure 3, where staying at home helps combat the spread of the virus, it is important to assess the possibilities of sheltering at home where there is a large informal sector.
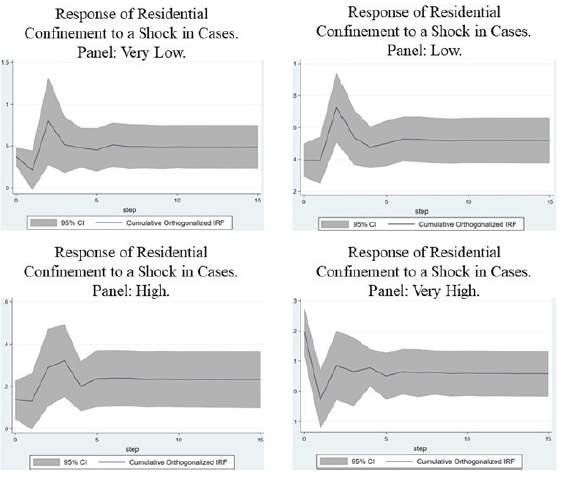
In this direction, when evaluating how the impulse to residential confinement responds to a growth shock in the confirmed cases of COVID-19, Figure 4 shows that only the groups of high, low, and very low informality register a positive effect. That is, as the spread of the virus increases, people tend to stay more at home. Again, it can be seen that as informality decreases in the groups, the effect is greater. That is, the lesser the informality, the greater the possibility of staying at home to avoid infection. Unfortunately, for the group with very high informality there is no clear evidence.
Although the response is positive, which is expected, this cumulative effect is not statistically significant.
Source: Authors' own elaboration.
Figure 4 Response of Cases to a Shock in Residential Confinement by Group of Informality
Although the indicator of daily confirmed cases could be underreported due to the low amount of testing done by the Mexican government, the main idea of the work holds since the objective is to identify the immediate effects on the spread of the virus and residential isolation. It is also important to mention that, as of March 17, 2020, actions were taken by the federal government to reduce urban mobility by suspending formal education (Estados Unidos Mexicanos, 2020a) and, as of early April, also suspending non-essential activities (Estados Unidos Mexicanos, 2020b). This dynamic approach by the government is largely solved with the PVAR approach, which evaluates the model dynamically and controls for exogenous variations such as paydays, weekends, and weather alerts to avoid biases due to leaving the home because of these causes.
Finally, it is also important to understand the lack of response to an impulse to stay at home in the face of a growth shock in confirmed cases for the group with the highest informality. The above analysis does not allow us to identify the characteristics that prevent the informal sector from staying at home. These could be, but are not limited to, the impossibility of working from home, the lack of savings to survive long periods without working and earning daily incomes, and the lack of access to job security and stability or unemployment insurance4. In any case, the study has provided evidence for the states where the average rate of labor informality in the group is 73.62%, which is comparable to the labor market situation in less developed economies. Something important to emphasize is how the effect of the cases is dissipated with residential confinement. As informality grows in the group of states, this effect becomes smaller and smaller. This shows the key role that informality plays in the labor market's ability to adapt to confinement conditions. It was also expected that in the middle groups, i.e., high and low informality, these effects would not change abruptly, or the trend would reverse. Hence, the results are consistent with our hypotheses.
CONCLUSIONS
The "stay-at-home" policy in Mexico has slowed the spread of the pandemic and, as the number of cases increased, people stayed home more. However, the effect is heterogeneous among states grouped by levels of informality.
While for states with lower rates of informality, "stay-at-home" has had a greater effect and more people have been able to stay home as the pandemic spread, for states with higher rates of informality, staying at home has had a lesser effect and the people have been unable to increase their residential isolation, even though measures to suspend formal education and non-essential activities have been adopted since the onset of the pandemic in the country. Some public policy alternatives focused on populations with a higher rate of informality are income transfers and support to households that depend on this type of activity. This should be done considering two important points. The first is to provide resources and public policies that encourage the informal population to stay at home and, above all, provide them with that possibility. The second is to provide effective hygiene measures to prevent the spread of the virus, such as the use of masks and the recommendation of their use, access to public washing facilities, and efficient remote care lines for suspected cases of infection to isolate them from the rest of the population.
"Stay-at-home" is important (if you can) because, in the present work, it has been shown that even when the informal labor market is large, it helps slow the spread of the pandemic. On the other hand, the heterogeneity shown in the results suggests that the context of each region and its labor market must be considered when designing health policies to mitigate the spread of diseases as in the current pandemic. Other ways of attacking the pandemic under these circumstances could by the adoption of heterogeneous policies by age groups (Brotherhood et al., 2020), such as policies focused on mass testing and limiting the mobility of young people, since their age group takes more risks and the mortality rate of older people is way higher. The exposure of younger people to the virus generates a negative externality to older people. Something similar happens between formal and informal employees. The states with high levels of informality face two problems: not receiving income because their work activities are informal and not having a constant source of income. Therefore, being confined at home means not earning that day's pay or suffering the ravages of the pandemic, getting sick from COVID-19, and facing it without social security, given the condition of informality.
In addition, this work provides insight into how to design public policies in regions where informality is very high. There is a growing concern that, in informal employment, the jobs and income of young workers could be the most affected. Also, the application of mass testing to effectively detect first cases at an early stage of the spread of the virus has been seen as a substitute for quarantine and succeeds in reducing the economic impacts of generalized quarantine public policies (Piguillem & Shi, 2020). The consideration of the informal labor market has been relevant in the discussion surrounding the damage caused by the COVID-19 disease. Field (Acevedo et al., 2021) shows that the labor dynamics and the economic impact of the closure of activities are strongly associated with informality, where alternative sources of information, such as surveys, have been used. Also, as discussed in Busso et al. (2021), public policies aimed at protecting the most vulnerable households have been, for the most part, insufficient. This has prompted organizations such as the World Bank (Ohnsorge & Yu, 2022) to focus their efforts on understanding the problem of informality during the pandemic. All these studies admit that there are still phenomena associated with these issues that we do not know about, so the results of this article contribute to the discussion.
Finally, this study provides a framework for various countries to assess whether their populations have responded to "stay-at-home" policies, especially where informality is of major concern and has similar characteristics to Mexico's in terms of its heterogeneity.

