


 English (pdf)
 Article in xml format
 Article references
 Send this article by e-mail
 Cited by SciELO
  Cited by Google
  Similars in
SciELO
Similars in
SciELO  Similars in Google
 Permalink
Introduction
Developing countries in general and African nations in particular are increasingly becoming victims of climate change as global temperatures rise. The Intergovernmental Panel on Climate Change (IPCC) has attributed the temperature increases to human activities, including releases of the greenhouse gases, carbon dioxide, methane and nitrous oxide into the atmosphere. They have requested nations to quantify the amounts of gases they produce and to develop research to limit further gaseous emissions (Moss et al. 2000).
Ruminants are a major source of methane (CH4) emissions, and France et al. (1993) estimated that the world's cattle emit about 100 Mt of CH4 into the atmosphere annually, constituting 12.5-20% of the total global CH4 emissions. More than half of the global cattle population are located in the tropics (McCrabb and Hunter 1999), a large proportion of which are supported on relatively low-quality, highly fibrous feed resources. This constitutes a significant source of global CH4 emissions. Moreover, enteric CH4 emissions in ruminants represent a loss of 2-12% of gross energy of feeds (McCrabb and Hunter 1999). As a result, CH4 emissions from livestock have become a focus of research activities, especially in countries where agriculture is an important economic sector.
A wide diversity of forage sources are used in feeding livestock in the tropics. Improving the feed resource base by identifying alternative and more nutritious feeds with low CH4 production would both reduce greenhouse gas emissions and increase the efficiency of energy utilization in forage. There is a lack of data describing and identifying those tropical grass and legume forages with low CH4 production potential when fed to ruminant animals.
Since in vivo studies of methanogenesis by ruminants are time-consuming and expensive, and require largescale specialized facilities and resources, there has been growing interest in using in vitro techniques to simulate the in vivo process (Blümmel et al. 2005; Bhatta et al. 2008; Soliva et al. 2008; Melesse et al. 2013). Use of in vitro gas-production techniques allows the screening of significant numbers of species rapidly and at relatively low cost (Soliva et al. 2008; Singh et al. 2012).
We used in vitro techniques to assess: a) the chemical and mineral compositions; and b) ruminal fermentation characteristics and CH4 emission potentials, of some common Ethiopian green forages (9 grasses and 3 legumes) for their subsequent use in formulating diets for ruminants with lower potential emissions of CH4.
Materials and Methods
Feed sample collection
Samples of grasses and legumes were collected during the small rainy season (March-May) in 2013. Samples of Avena sativa and Vicia sativa were collected from the first stage of growth on the forage farms of College of Agriculture, Hawassa University, Hawassa (7°03'43.38" N, 38°28'34.86" E; 1,700 masl). Samples of Pennisetum purpureum, Chloris gayana, Panicum maximum, Panicum coloratum, Hyparrhenia cymbaria, Desmodium intortum and Medicago sativa were collected at the pre-flowering stage of plants from ILRI's (International Livestock Research Institute) Forage Seed Multiplication Center located at Debre-Zeit (8°45'8.10" N, 38°58'42.46" E; 2,006 masl). Samples of Brachiaria mutica, Cenchrus ciliaris and Cynodon dactylon were collected at the pre-flowering stage of plants from ILRI's Forage Seed Multiplication Center located at Zeway (7°55'59.99" N, 38°43'0.01" E; 1,640 masl). All samples were dried on plastic sheets kept in shade, ground to pass a 1 mm sieve and transported in air-tight plastic containers to the University of Hohenheim, Germany, for analyses.
Chemical analyses
Chemical analyses of proximate nutrients, fiber fractions and minerals were performed as outlined by Verband Deutscher Landwirtschaftlicher Untersuchungs- und Forschungsanstalten (VDLUFA 2007). The samples were analyzed at the Institute of Animal Science, University of Hohenheim, for dry matter (DM, method 3.1), ash (method 8.1), crude protein (CP, method 4.1.1; N x 6.25), petroleum ether extract (EE, method 5.1.1) and crude fiber (CF, method 6.1.1). Neutral detergent fiber (aNDFom) was assayed on an organic matter basis after amylase treatment (method 6.5.1) and acid detergent fiber on an organic matter basis (ADFom, method 6.5.2). Acid detergent lignin (ADL) was analyzed according to method 6.5.3. Cellulose and hemicellulose were computed as ADFom minus ADL and aNDFom minus ADFom, respectively. Non-fiber carbohydrate (NFC) concentration was calculated as 100 -(aNDFom + CP + crude fat + ash) according to NRC (2001). Nitrogen free extract (NFE) was computed as OM - (CF + EE + CP). Minerals [Ca, P, magnesium (Mg), potassium (K), sodium (Na), iron (Fe), copper (Cu), manganese (Mn) and zinc (Zn)] were determined according to methods 10 and 11 of VDLUFA (2007) using an Inductively Coupled Plasma spectrometer (ICP-OES).
Four species with possible anti-nutritional factors (Chloris gayana, Desmodium intortum, Medicago sativa and Vicia sativa) were selected from the collection and analyzed for concentrations of total phenols and non-tannin phenols using the Folin-Ciocalteu method [Jayanegara et al. (2011) with modifications as described by Wischer et al. (2013)]. Extractable condensed tannins were analyzed according to Jayanegara et al. (2011). Concentrations of tannin phenols were then calculated as differences between total phenol and non-tannin phenol concentrations. The absorbance of total phenols and non-tannin phenols was recorded at 725 nm using a UV-VIS spectrophotometer (Perkin Elmer Instruments, Norwalk, CT, USA). Condensed tannins were analyzed by the butanol-HCl-iron method according to Jayanegara et al. (2011). The absorbance was read at 550 nm using the same UV-VIS spectrophotometer as for total phenols and non-tannin phenols and was expressed as leucocyanidin equivalents.
All analyses were run in duplicate and were averaged. If deviation between duplicates was above the level specified for each analysis, the analyses were repeated.
In vitro gas production
Gas production (GP) was determined according to the VDLUFA official method (VDLUFA 2007, method 25.1) (Menke and Steingass 1988). About 200 mg of feed sample was weighed and transferred into 100 ml calibrated glass syringes, fitted with white Vaseline-lubricated glass plungers.
A buffer solution was prepared and maintained in a water bath at 39 °C under continuous flushing with CO2. Rumen fluid was collected before the morning feeding from 2 rumen-cannulated, lactating Jersey cows, fed a total mixed ration consisting (DM basis) of 20% maize silage, 20% grass silage, 20% hay and 40% dairy concentrate. The rumen fluid from both cows was mixed, filtered and added to the buffer solution (1:2 v/v) under constant stirring. Thirty mL of buffered rumen fluid was injected into each syringe, which was then immediately placed into a rotating disc and oven-incubated at constant temperature of 39 °C. Three syringes with only buffered rumen fluid, termed as blanks, plus 3 syringes with hay standard and 3 with concentrate standard with known GP were included in each run. The GP of samples, blanks and standards was recorded at 2, 4, 6, 8, 12, 24, 32, 48, 72 and 96 hours of incubation. The plunger of the syringe was reset to 30 ml after the 6 and 24 hour readings. For metabolizable energy (ME) estimation, the GP of the feed samples was recalculated as 24 h GP on 200 mg DM using results from the blanks, with the corrections determined by the standards of hay and concentrate, the sample weight and its DM concentration.
The estimations of organic matter digestibility (OMD) and ME were carried out according to Menke et al. (1979) and Menke and Steingass (1988) by using the following equations:
ME (MJ/kg DM) = 1.68 + 0.1418*GP + 0.0073*CP + 0.0217*XL - 0.0028 XA
OMD (%) = 14.88 + 0.889*GP + 0.0448*CP + 0.0651*XA
where: GP, CP, XL and XA are 24 h gas production (ml/200 mg DM), crude protein, crude fat and ash (g/kg DM) of the incubated feed samples, respectively.
The corrected GP recorded between 2 and 96 h of incubation and the kinetics of GP were described by using the exponential equation: y = b*(1-e(-c(t-lag))), which assumed one pool of asymptotic GP (b, ml/200 mg DM) with a constant fractional rate of GP (c, per hour) with a lag phase (lag, hours) in the onset of GP; parameter "y" is GP at time "t" (Blümmel et al. 2003; 2005).
Methane production
For CH4 determination, 6 separate in vitro runs were performed. Based on the previous in vitro GP results for each feed sample, we calculated the quantity of each feed sample to be incubated for 24 h without having to remove the gas produced in the syringes during the incubation period. After 24 h of incubation, total GP was recorded, and the incubation liquid was carefully decanted, while leaving the gas inside the syringes. The CH4 content of the total gas in the syringes was then analyzed using an infrared methane analyzer (Pronova Analysentechnik, Berlin, Germany) calibrated with a reference gas (13.0% CH4 by volume, Westfalen AG, Münster, Germany). Syringes were directly connected to the analyzer and about 20 ml of gas was injected for about 20 seconds until the displayed CH4 concentration was constant. The CH4 produced by each sample was corrected by the amount of CH4 produced by blank syringes (containing only the rumen fluid) and by the factors of reference hay and concentrate feed, which were included in each run.
Statistical analyses
Results of chemical and mineral composition are expressed as means of duplicate analyses of a bulked sample. Model fitting for gas production kinetics and parameter estimation was done according to Blümmel et al. (2003) by using the computer program GraphPad Prism 5.0 (2007) for Windows (GraphPad Software Inc., La Jolla, CA, USA). Data on 24 h gas and methane productions were subjected to the GLM of the Statistical Analysis System (SAS 2010). Analysis of variance was conducted according to the following model: yij = ¡x + Pi + Rj + eij, where: yij is the independent variable, ¡x is the overall mean, Pi is the effect of the i th plant material, Rj is the effect of the j th experimental run of the i th plant material and eij is the residual error. All multiple comparisons among means were performed with Duncan's multiple range tests.
Results
Crude nutrients and anti-nutritional factors
Crude nutrient concentrations in the studied grass and legume plants are presented in Table 1. The CP concentrations in grass species ranged from 70 g/kg DM (Panicum coloratum) to 220 g/kg DM (Avena sativa), while those in legumes ranged from 257 g/kg DM (Medicago sativa) to 346 g/kg DM (Vicia sativa). For grasses, CF concentrations ranged from 281 g/kg DM (A. sativa) to 322 g/kg DM (Cenchrus ciliaris and Chloris gayana), while values for legumes ranged from 213 g/kg DM (Desmodium intortum) to 249 g/kg DM (M. sativa). Similarly, grasses contained more aNDFom (484-651 g/kg DM) than legumes (364-404 g/kg DM). Concentrations of ADL in grasses (25.3-41.3 g/kg DM) were lower than those in legumes (48.2-89.8 g/kg DM).
Table 1 Crude nutrient concentrations (g/kg DM) in some common grass and legume forages grown in Ethiopia.
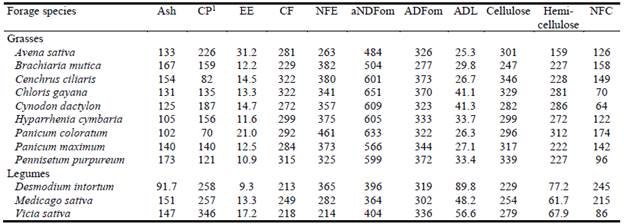
1CP = crude protein; EE = crude fat; CF = crude fiber; NFE = nitrogen free extract; aNDFom = neutral detergent fiber on organic matter basis after amylase treatment; ADFom = acid detergent fiber on organic matter basis; ADL = acid detergent lignin; NFC = non-fiber carbohydrates.
As shown in Table 2, concentrations of total phenols were comparable for M. sativa, V. sativa and C. gayana, while those for D. intortum were higher by a factor of 10. No tannin phenols or extractable condensed tannins were detected in either M. sativa or V. sativa, while C. gayana contained very low concentrations of these compounds. Both tannin phenols and extractable condensed tannins were at high concentrations in D. intortum.
Table 2 Concentrations (g/kg DM) of total phenols, tannin phenols and extractable condensed tannins in some selected forage species in Ethiopia.
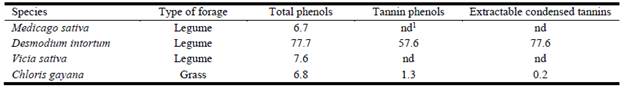
1nd = not detected.
Minerals
As presented in Table 3, among the grasses Brachiaria mutica had the highest concentrations of Ca, Mg, Fe and Mn, while P concentration was highest in A. sativa, Pennisetum purpureum and Panicum maximum. In leguminous forages, M. sativa and V. sativa had Ca concentrations of about 9 g/kg DM, while V. sativa had the highest P concentration (5.6 g/kg DM). Sodium concentrations varied widely in both legumes and grasses, with ranges of 0.06-8.01 g/kg DM for grasses and 0.104.26 g/kg DM for legumes.
Table 3 Mineral composition of some common grass and legume forages grown in Ethiopia.
| Forage species | Major (g/kg DM) | Trace (mg/kg DM) | ||||||||
| Ca1 | P | Mg | K | Na | Fe | Cu | Mn | Zn | ||
| Grasses | ||||||||||
| Avena sativa | 3.69 | 5.24 | 2.18 | 38.0 | 8.01 | 104 | 2.44 | 46.9 | 78.4 | |
| Brachiaria mutica | 8.55 | 3.49 | 4.63 | 26.0 | 1.83 | 716 | 7.02 | 84.7 | 29.9 | |
| Cenchrus ciliaris | 4.30 | 2.54 | 2.95 | 24.3 | 0.45 | 430 | 4.21 | 31.7 | 18.6 | |
| Chloris gayana | 3.88 | 2.94 | 1.98 | 35.6 | 0.50 | 210 | 4.75 | 68.7 | 28.9 | |
| Cynodon dactylon | 5.11 | 2.07 | 2.46 | 24.9 | 0.15 | 181 | 5.09 | 57.5 | 35.0 | |
| Hyparrhenia cymbaria | 4.27 | 1.40 | 2.41 | 20.6 | 0.06 | 150 | 5.87 | 44.3 | 28.1 | |
| Panicum coloratum | 3.20 | 2.78 | 3.66 | 11.0 | 1.82 | 191 | 3.98 | 21.7 | 15.2 | |
| Panicum maximum | 4.14 | 4.56 | 4.38 | 23.9 | 3.54 | 420 | 8.27 | 40.6 | 26.3 | |
| Pennisetum purpureum | 3.09 | 4.49 | 3.49 | 38.9 | 0.16 | 267 | 7.50 | 27.5 | 25.5 | |
| Legumes | ||||||||||
| Desmodium intortum | 6.85 | 2.37 | 6.25 | 18.8 | 0.10 | 486 | 7.14 | 58.7 | 34.8 | |
| Medicago sativa | 9.32 | 3.24 | 3.02 | 45.9 | 4.26 | 494 | 2.42 | 55.2 | 65.3 | |
| Vicia sativa | 9.05 | 5.57 | 3.12 | 46.0 | 2.64 | 441 | 3.37 | 61.3 | 388 | |
1Ca = calcium; P = phosphorus; Mg = magnesium; K = potassium; Na = sodium; Fe = iron; Cu = copper; Mn = manganese; Zn = zinc.
In vitro gas production profiles and fermentation kinetics
As shown in Table 4, metabolizable energy (ME) concentrations in grasses ranged from 7.4 MJ/kg DM in Panicum coloratum to 10.6 MJ/kg DM in A. sativa and in legumes from 8.1 MJ/kg DM in D. intortumto 10.2 MJ/ kg DM in V. sativa. Organic matter digestibility in grasses ranged from 56.1% in P. coloratum to 79.6% in A. sativa, and from 64.6 to 82% in legumes. The highest asymptotic GP (parameter b) values for grasses were observed in Hyparrhenia. cymbaria (58.6 ml) and P. maximum (59.2 ml) with the lowest in B. mutica (49.2 ml). Values for legumes were generally lower with a range of 39.0-45.2 ml. The fractional rates of GP per hour (parameter c) for grasses ranged from 0.0387 (P. coloratum) to 0.0667 (A. sativa). The range for legumes was 0.0537 (D. intortum) to 0.0851 (V. sativa). As shown in Table 4, the values for the goodness of fit (R2) of the exponential model were above 94% for all species.
Table 4 In vitro estimates of metabolizable energy (ME), organic matter digestibility (OMD) and kinetics of gas production (ml/200 mg DM) in some common grass and legume forages grown in Ethiopia.
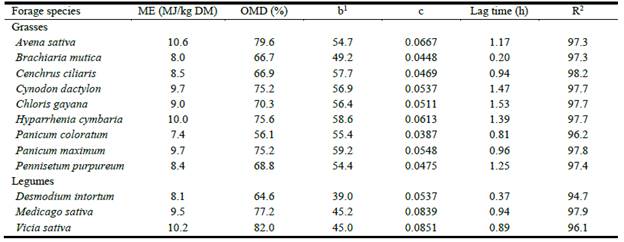
1b = total asymptotic gas production (ml/200 mg DM); c= the rate at which b is produced per hour with a lag phase in the onset of gas production.
Patterns of gas production for the grasses are shown in Figure 1 and for legumes in Figure 2.
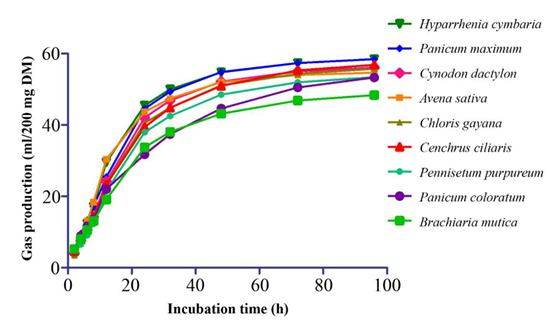
Figure 1 Patterns of gas production of some tropical grass forages during in vitro incubation for 96 h.
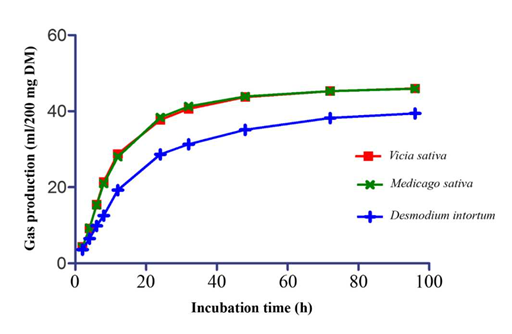
Figure 2 Patterns of gas production of some tropical legume forages during in vitro incubation for 96 h.
Methane production
Most grass species produced significant amounts of methane during digestion, but P. coloratum produced about half that of other species (P<0.05) (Table 5). Total gas production followed a similar pattern with highest values for H. cymbaria, P. maximum, A. sativa and Cynodon dactylon and lowest for P. coloratum (P<0.05). Methane:total gas ratios (CH4:GP) ranged from 0.18:1 (B. mutica) to 0.11:1 (P. coloratum) (P<0.05).
Desmodium intortum produced much less CH4 than V. sativa and M. sativa (P<0.05) differing significantly from these other legumes (Table 5). While differences between species for total gas production were not so marked, the lowest CH4:GP ratio was observed in D. intortum (0.12:1), which differed significantly from those for the other 2 legumes (0.16:1). In general, grasses produced comparatively higher (P<0.05) GP, CH4 and CH4:GP ratios than legume forages.
Table 5 In vitro methane and total gas production profiles (±SD) in some common grass and legume forages grown in Ethiopia.
| Forage species | CH4 (ml/200 mg DM) | GP (ml/200 mg DM) | CH4:GP (v |
| Grasses | |||
| Avena sativa | 6.16±1.00ab1 | 44.0±5.34abc | 0.140d |
| Brachiaria mutica | 5.80±0.53b | 33.5±1.41e | 0.178a |
| Cenchrus ciliaris | 6.92±0.45a | 40.9±1.62cd | 0.169b |
| Chloris gayana | 6.44±0.68ab | 41.8±3.20bcd | 0.159bc |
| Cynodon dactylon | 7.01±0.53a | 43.6±4.38abc | 0.161bc |
| Hyparrhenia cymbaria | 6.78±0.68a | 47.0±2.10a | 0.145d |
| Panicum coloratum | 3.18±0.47c | 31.4±1.02e | 0.107e |
| Panicum maximum | 7.01±1.06a | 44.9±2.00ab | 0.159bc |
| Pennisetum purpureum | 6.94±1.06a | 39.7±2.15d | 0.165bc |
| Legumes | |||
| Desmodium intortum | 3.67±0.39b | 29.9±1.03b | 0.123b |
| Medicago sativa | 5.90±0.72a | 37.5±2.86a | 0.157a |
| Vicia sativa | 5.73±0.51a | 36.1±3.25a | 0.159a |
| Grasses vs. legumes | |||
| Grasses | 6.23±1.42a | 40.3±5.52a | 0.156a |
| Legumes | 5.34±1.21b | 36.9±6.15b | 0.144b |
1Means within columns and plant types followed by different letters differ significantly (P<0.05). CH4 = methane production; GP = total gas production at 24 h incubation of feed samples.
Discussion
Crude nutrient and mineral concentrations
The generally lower CP concentrations in the grasses than in the legumes were consistent with the reports of Singh et al. (2012) for Indian green forages. Consistent with the reports of Tessema and Baars (2006), all forages studied had protein concentrations above 8%, suggested by Van Soest (1982) as the critical level, below which intake may fall due to lack of sufficient nitrogen for effective proliferation of rumen micro-organisms. Higher CP values in leguminous forages than in grasses might be related to the N-fixing abilities of the legumes. Our current findings are in good agreement with those of Tessema and Baars (2006) from Ethiopia, that pure legume stands and grass-legume mixtures produced forage with higher CP and lower fiber concentrations than pure stands of grass. The CP concentrations in C. gayana and P. maximum in the present study are lower than those reported by Tessema and Baars (2006). However, those authors also reported lower CP for M. sativa than found in the present study. These differences in CP concentrations could be explained due to stage of maturity, N profile of the soils where they had been grown and differences in efficiency of protein accumulation during growth. Moreover, differences in nutrient concentrations in the feeds may be due to variations in the stage of growth and plant parts (i.e. twigs, leaves, soft stem) when sampled.
All leguminous forages had higher lignin concentrations than grasses as reported by Singh et al. (2012). This might be explained by the fact that the leguminous forages synthesize lignin for strength and rigidity of plant cell walls. Singh et al. (2012) reported 310 and 58.8 g/kg DM for ADF and ADL concentrations, respectively, in M. sativa, which are comparable with the present findings.
Except for B. mutica, grass species in the present study had higher aNDFom, ADFom, cellulose and hemi-cellulose concentrations than legumes, which is in accordance with the findings of Tessema and Baars (2006) and Singh et al. (2012). The threshold level of NDF in tropical grasses, beyond which DM intake of cattle is affected, is suggested to be 600 g/kg DM (Meissner et al. 1991) and all legumes and some grasses (B. mutica, P. maximum, P. purpureum and C. ciliaris) had lower NDF values than this critical level. Since animals, when allowed to selectively graze, can select a better quality diet than feed on offer, these issues may not be a major problem under a grazing situation. However, where a cut-and-carry system operates, they become quite relevant. All leguminous forages contained less fiber than grasses, which might be explained in part by lower hemicellulose concentration in the legumes at comparable levels of cellulose (Table 1). Cellulose and hemicellulose in forages represent the main sources of energy to ruminants (Merkel et al. 1999).
The aNDFom, ADFom and ADL concentrations in V. sativa were comparable with those reported by Berhane et al. (2006) from the lowlands of northern Ethiopia. While the CP concentration in P. coloratum was similar to the observation of the same authors, they reported higher NDF, ADF and ADL values than those we found. Such variations might be induced by the stage of maturity of the forage at harvest as grasses increase stem proportions with age, resulting in higher NDF, ADF and lignin and lower CP values (Mero and Udén 1997; 1998).
Except for P. coloratum, lipid concentrations in the forages investigated here were much lower than observations reported by Singh et al. (2012) and Pamo et al. (2007). These variations might be attributed mainly to stage of maturity of the forage at the time of sampling and different environmental conditions. While lipids do not constitute a major source of energy from forages, forages with high lipid concentrations may be a tool to modify milk fatty acid profile towards more long-chain and unsaturated fatty acids (Elgersma 2015).
Phosphorus is one of the most important minerals for many metabolic processes in animals and a deficiency of P in the diet can retard growth and reproductive performance of livestock (Paterson et al. 1996). While V. sativa and A. sativa were found to be the richest sources of P in our study (>0.5% P), all forages had P concentrations above 0.2%. Brachiaria mutica, V. sativa and A. sativa proved to be the richest sources of Ca, which is closely related to P metabolism in the formation of bones. The calculated average Ca:P ratio for legume forages in the present study was 2.0:1, while for grasses it was 1.7:1, both of which fall within the recommended range for Ca:P ratio in feedstuffs of 1:2 to 2:1 (NRC 2001), indicating that the studied forages are likely to be a well-balanced source of both minerals.
In vitro gas and methane production
The study has shown that methane production from all forages tested was relatively uniform, with the exception of P. coloratum and D. intortum, which produced much less CH4 than the remaining species. The observed low in vitro GP pattern in D. intortum (Figure 2) might be explained by the presence of high concentrations of total phenols (77.7 g/kg DM) and condensed tannins (77.6 g/kg DM), which have the ability to complex with protein and are a major cause of the resistance of this legume to bacterial decomposition.
Consistent with the current observations, Mero and Udén (1998) reported in vivo OMD values between 61.5 and 64.8% for C. ciliaris hay harvested at 6 weeks of age. They also reported comparable OMD values for P. coloratum harvested at 6 weeks of age. Berhane et al. (2006) reported values of 65.5 and 68.3 ml for in vitro GP (parameter b) of fresh-cut V. sativa and P. coloratum, respectively, which were higher than those observed in the current study. Panicum coloratum in the present study had the lowest ME and OMD values. Except for D. intortum, legumes produced more gas than grasses within 96 h of incubation, which is consistent with the findings of Singh et al. (2012).
The observed variations in CH4 production among the investigated forages may be due to variations in their chemical composition. Such variations in in vitro CH4 production have been observed in straws, forages and food industry byproducts (Santoso and Hariadi 2009; Singh et al. 2012). In the current study, except for P. coloratum and B. mutica, all investigated grasses had higher CH4 values than leguminous forages, which is in agreement with the findings of Boadi et al. (2004) and Navarro-Villa et al. (2011). At 12 h fermentation, Widiawati and Thalib (2007) found that in grasses CH4 production per unit of OM degraded was twice that in legume forages. Moreover, hydrolysis of legumes such as lucerne and red clover generates less CH4/g DM than hydrolysis of grasses (Ramirez-Restrepo and Barry 2005). The lower CH4 values in legumes vs. grasses might be attributed to less extensive in vitro rumen fermentation of legumes as suggested by Navarro-Villa et al. (2011). When CH4 emissions are expressed as a proportion of gross energy intake (Waghorn et al. 2006), values are lower for animals fed forage legumes (Waghorn et al. 2002) than for those receiving a predominantly grass diet. Beauchemin et al. (2008) proposed that the lower CH4 emissions of legume-fed animals is a result of a combination of factors including the presence of condensed tannins, lower fiber concentration, higher DM intake and an increased passage rate from the rumen. In the current study, no extractable condensed tannins were detected in M. sativa and V. sativa. Beauchemin et al. (2008) also reported that, although differences in CH4 emissions reflect compositional differences between grasses and legumes, stage of maturity at the time of harvest can be a confounding factor.
Fermentation of cell wall carbohydrates produces more CH4 than fermentation of soluble sugars, which produce more CH4 than fermentation of starch (Johnson et al. 1996) and legume forages are digested more quickly than grasses. This was demonstrated for M. sativa and V. sativa in the current study, which means that intake and productivity on leguminous pasture can be higher than on grasses. In tannin-containing forages, excess plant proteins that become bound to tannins leave the rumen without being digested. However, some leguminous forages containing tannins, such as D. intortum, can release these proteins in the abomasum in response to low pH. This allows the protein to be digested and absorbed in the small intestine (Waghorn et al. 1987), resulting in high productivity in both sheep (Douglas et al. 1995) and cattle (Wen et al. 2002).
Legumes contain higher CP than grasses at the same stage of maturity and protein fermentation in vitro has been shown to be associated with lower CH4 production than fermentation of carbohydrates (Cone and Van Gelder 1999). In vitro studies conducted by Soliva et al. (2008), Tiemann et al. (2008), Bekele et al. (2009) and Archimède et al. (2011) have shown that a large portion of the variability of CH4 production in legumes can be associated with the presence of secondary metabolites (condensed tannins, saponins) in some legume species, which can inhibit CH4 formation (Beauchemin et al. 2007; Jouany and Morgavi 2007). In the present study, D. intortum had the highest phenols and extractable condensed tannins, which possibly contributed to the reduction of CH4 production in this species. In other studies, prolonged feeding of tanniniferous forage legumes showed that animals receiving D. intortum had the lowest total worm burdens, the lowest female:male parasite ratios, the lowest numbers of eggs in the uterus of each female worm and the lowest per capita fecundity (Debela et al. 2012). There is high variability among legumes, particularly regarding the presence of secondary metabolites such as tannins, which are more common in tropical legumes (Waghorn 2008).
Tropical legumes show promise as a means of reducing CH4 production, partly because of their lower fiber concentration and faster rate of passage than grasses, and in some cases, the presence of condensed tannins as observed in D. intortum in this study. Various studies have reported that condensed tannins in legume forages are able to suppress ruminal methanogenesis directly through their antimethanogenic activity and indirectly through their antiprotozoal activity (Goel and Makkar 2012). Patra and Saxena (2010), Pellikaan et al. (2011) and Goel and Makkar (2012) indicated that condensed and hydrolyzable tannins extracted from a diverse array of plant materials reduced CH4 production in vitro. Similarly, Puchala et al. (2005) demonstrated that the presence of condensed tannins in forages can decrease CH4 production in vivo. This was confirmed by Animut et al. (2008), who observed decreased CH4 emissions in sheep fed a ration supplemented with different condensed tannin sources.
The CH4 values measured at 24 h in vitro forM. sativa, P. purpureum and P. maximum reported by Singh et al. (2012) are generally higher than those obtained from the current study. These variations could be due to quality and maturity stage of the forages, soil type and climate in which forages have been grown.
Enteric CH4 production could be influenced by the nature of carbohydrates fermented, such as cellulose, hemicelluloses and soluble residues of the diets. In the present study, grasses had higher aNDFom, ADFom, cellulose and hemicellulose concentrations than legumes and produced more CH4 per unit weight. Similarly, Moss et al. (1994) reported that digestible ADF, cellulose and hemicellulose are important fiber fractions influencing CH4 production in the rumen.
Many studies (Santoso et al. 2003; Santoso and Hariadi 2009; Singh et al. 2012) have reported correlations between chemical constituents and CH4 production. In the current study, CH4 was negatively correlated with non-fiber carbohydrates (NFC) only (data not shown) as fermentation of NFC produces less hydrogen due to relatively higher propionate production. Accordingly, increments in NFC in forages should depress CH4 production. This has been clearly observed in the current study, in which both P. coloratum and D. intortum had high NFC values and produced lower CH4 levels than other forage species. These results are consistent with the observations of Grainger and Beauchemin (2011), who reported that increasing NFC levels in feeds reduces CH4 production by lowering pH and increasing rate of ruminal passage to favor propionate production, and reduce rumen protozoal populations.
Conclusions
The CP concentrations were lower in the grasses than in the legumes, while the reverse was the case for aNDFom, ADFom and cellulose. Methane production was numerically higher in grasses than legumes. Thus, feeding of grasses in combination with legumes should result in enhanced productivity, while reducing CH4 emissions by ruminants, especially per unit of product. Despite their lower OMD, it appears that P. coloratum and D. intortum could be fed alone or in combination to supplement tropical feed resources for practical mitigation of CH4 emissions from ruminants. We recommend animal-based experiments to validate the actual feeding values of these forages, which showed reduced CH4 production in vitro, and to assess their production potential.

