


 English (pdf)
 Article in xml format
 Article references
 Send this article by e-mail
 Cited by SciELO
  Cited by Google
  Similars in
SciELO
Similars in
SciELO  Similars in Google
 Permalink
Introduction
Livestock play a crucial role in the socio-economic development of many developing countries in tropical and subtropical regions of the world. Year-round availability and supply of forages have always been a huge challenge for sustainable livestock production at the household level, where smallholder farmers are dependent on small plots of land for mixed farming (Ayantunde et al. 2005; Smith et al. 2013). The challenge is becoming even more difficult with the current trends of climate change, increasing population density per unit area with the associated growing demand for meat, milk and eggs, an alarming rate of urbanization and consequently limited availability of arable land (Smith et al. 2013). Achieving the sustainable development goals of eradicating poverty, ending hunger, enhanced food security and promoting climate-smart action at the household level of smallholder farmers would be very difficult without addressing the feed and forage component of livestock production. The lack of sufficient forage negatively affects livestock production and productivity with consequences for smallholder farmers' incomes and their everyday livelihood. Consequently, forage species which can produce high yields per unit area, particularly under stressed conditions (reduced water availability, increased diseases and insect pests, producing on marginal land, etc.), are in greater need than ever to address the increasing demand for forage.
Napier grass [Cenchrus purpureus (Schumach.) Morrone (syn. Pennisetum purpureum Schumach.)] is an allotetraploid (2n=4x=28, A'A'BB) perennial C4 flowering plant (Harris et al. 2010; Kandel et al. 2016) native to Sub-Saharan Africa and widely grown across the tropical and subtropical regions of the world (Singh et al. 2013). Selection and breeding in the Americas have resulted in new higher-yielding genotypes, such as the elite lines from the Empresa Brasileira de Pesquisa Agropecuária (EMBRAPA) Napier grass breeding program (Pereira et al. 2017). These elite lines are adapted to their local climate and farming system but could also have potential for use by smallholder farmers in Sub-Saharan Africa. Napier grass is a multi-purpose crop used primarily for feeding animals (Farrell et al. 2002; Ishii et al. 2013; Heuzé et al. 2016) but also as a biofuel crop (Singh et al. 2013), for the control of weeds and soil erosion (Kabirizi et al. 2015) and as a trap plant in an integrated pest management strategy (Khan et al. 2006; 2007).
The conservation and use of the available germplasm requires an understanding of the level and structure of genetic diversity of a crop (Laidò et al. 2013). To enhance the conservation and use of Napier grass germplasm, a number of studies have been conducted to characterize its genetic diversity using various types of molecular markers (Negawo et al. 2017 and the references therein) revealing a moderate level of diversity in the studied populations. Molecular information has also been used to support the identification of duplicates and incorrect labeling during the handling of accessions maintained in a genebank (Lowe et al. 2003). A recent review paper by Negawo et al. (2017) provides an up-to-date summary of the molecular, agronomic and feed quality information collected on Napier grass to date and suggests some of the areas where current advances in molecular genetics could be used to enhance the research, conservation and use of the available genetic resources.
Napier grass germplasm is usually distributed as stem cuttings because of poor seed set and the outcrossing nature of seed production (Negawo et al. 2017). Movement of cuttings across borders increases the risk of spreading pests and diseases and requires extensive and expensive testing to ensure the materials are free of diseases for phytosanitary clearance before dispatch and extensive quarantine on arrival. This is especially important when transferring germplasm between continents, where plants may be subjected to different pests and diseases. Gap filling, a targeted acquisition or collection to fill the trait and genetic diversity gaps identified from gap analysis, is also an important activity in genebanks and molecular studies that can identify genotypes that are genetically distinct can be used to reduce the numbers introduced and the associated risks and costs of disease testing and transfer as vegetative cuttings, capturing expanded diversity while minimizing risks.
In the current study, simple sequence repeat (SSR) markers were used to assess the Napier grass collections held in the International Livestock Research Institute (ILRI) forage genebank and the Brazilian Agricultural Research Corporation, Embrapa Gado de Leite. The aim of the study was to assess the genetic diversity and allelic richness in both collections and to use the generated information to assist in the identification of genetically distinct accessions from the collections to supplement those already held by both genebanks.
Materials and Methods
Plant materials
A total of 171 accessions of Napier grass: 83 accessions from the EMBRAPA Napier grass active genebank at Embrapa Gado de Leite; 28 elite lines from the EMBRAPA breeding program; and 60 accessions from the ILRI genebank collection, were studied at ILRI, Addis Ababa, Ethiopia using SSR markers. Eight of the accessions in the ILRI collection are hybrids (P. purpureum x P. glaucum).Table 1 shows the origin and/or sources of the accessions in both collections.
Table 1 Origin and/or source of the accessions in both collections.
| Origin/collected from | ILRI1 | EMBRAPA2 |
| Brazil | 39 | |
| Brazilian elite lines | 28 | |
| Burundi | 1 | |
| Colombia | 5 | |
| Costa Rica | 1 | |
| Cuba | 1 | 4 |
| Ethiopia | 1 | |
| India | 3 | |
| Malawi | 1 | |
| Mozambique | 2 | |
| Namibia | 1 | |
| Nigeria | 1 | |
| Panama | 1 | |
| Swaziland | 6 | |
| Tanzania | 6 | |
| USA | 17 | 1 |
| Zimbabwe | 11 | |
| Unknown | 12 | 29 |
| Total | 60 | 111 |
1ILRI: International Livestock Research Institute.
2EMBRAPA: Brazilian Agricultural Research Corporation.
DNA extraction
Leaf samples of each germplasm accession from the ILRI genebank were collected and dried in silica gel. The dried leaf samples were ground to a fine powder using a tissue grinder (Geno grinder, SPEX SamplePrep, Metuchen, NJ, USA) and DNA was extracted from 30-50 mg of ground leaves using a modified CTAB method (Doyle and Doyle 1987). Briefly, DNA was extracted from the leaf powder with a CTAB buffer followed by chloroform/isoamyl alcohol (24:1) and then precipitated with isopropanol. The re-suspended DNA was treated with RNAse A at 37 °C for 1 h, and then purified using chloroform/isoamyl alcohol followed by sodium acetate precipitation. Following centrifugation (20,000 g) for 30 min at 4 °C the resultant pellet was washed with 100% ethanol (EtOH), followed by 70% EtOH (ice-cooled) and then air-dried for 5 min at room temperature. Finally, the pellet was dissolved in 40 uL TE buffer. The DNA from EMBRAPA accessions was also extracted using the CTAB method and shipped to ILRI in 96 well plates (1ug dry DNA per sample) at room temperature, where it was re-suspended in sterile deionized water. The quantity and purity of the DNA were determined using a Nano Drop spec-trophotometer and, to determine quality and integrity, the DNA of a few random samples was also separated by gel electrophoresis. Finally, the DNA was diluted to a working concentration of 50 ng/uL.
SSR markers
Twenty SSR markers, previously developed for pearl millet (Allouis et al. 2001; Budak et al. 2003; Mariac et al. 2006) and demonstrated to be transferable to Napier grass (Azevedo et al. 2012) were used for genotyping accessions from ILRI and EMBRAPA (Table 2).
Table 2 SSR markers used for the study: marker code; chromosome number, location of the markers on chromosomes of pearl millet; marker type, source from which the marker was derived; sequence of forward and reverse primers; repeat motif and length; annealing temperature (Ta); and source reference.
| Marker Code | CN1 | Marker Type | Forward Primer (5'-3') | Reverse Primer (5'---3') | Repeat motif and length | Ta (°C) | Reference |
| CTM10 | 32 | Genomic | GAGGCAAAAGTGGAAGACAG | TTGATTCCCGGTTCTATCGA | (CT)22 | 54 | Budak et al. 2003 |
| CTM12 | 12 | Genomic | GTTGCAAGCAGGAGTAGATCGA | CGCTCTGTAGGTTGAACTCCTT | (CT)12 | 53 | Budak et al. 2003 |
| CTM27 | 12 | Genomic | GTTGCAAGCAGGAGTAGATCGA | CGCTCTGTAGGTTGAACTCCTT | (CT)71 | 53 | Budak et al. 2003 |
| CTM59 | NK | Genomic | TCCTCGACATCCTCCA | GACACCTCGTAGCACTCC | (CT)11 | 53 | Budak et al. 2003 |
| CTM8 | 72 | Genomic | GCTGCATCGGAGATAGGGAA | CTCAGCAAGCACGCTGCTCT | (CT)8 | 54 | Budak et al. 2003 |
| PGIRD21 | 13 | EST | GCTATTGCCACTGCTTCACA | CCACCATGCAACAGCAATAA | (ACC)8 | 54 | Mariac et al. 2006 |
| PGIRD25 | 63 | EST | CGGAGCTCCTATCATTCCAA | GCAAGCCACAAGCCTATCTC | (GA)9 | 58 | Mariac et al. 2006 |
| PGIRD46 | 33 | EST | GAACAATTGCTTCTGTAATATTGCTT | GCCGACCAAGAACTTCATACA | (CTC)6 | 48 | Mariac et al. 2006 |
| PGIRD5 | 13 | EST | CAACCCAACCCATTATACTTATCTG | GCAACTCTTGCCTTTCTTGG | (GA)7 | 58 | Mariac et al. 2006 |
| PGIRD56 | 33 | EST | ATCACTCCTCGATCGGTCAC | ACCAGACACACGTGCCAGT | (TG)6 | 58 | Mariac et al. 2006 |
| PGIRD57 | 73 | EST | GGCCCCAAGTAACTTCCCTA | TCAAGCTAGGGCCAATGTCT | (AG)7 | 56 | Mariac et al. 2006 |
| PRIRD13 | 13 | EST | CAGCAGCGAGAAGTTTAGCA | GCGTAGACGGCGTAGATGAT | (AGC)8 | 60 | Mariac et al. 2006 |
| PSMP2235 | 53 | Genomic | GCTTTTCTGCTTCTCCGTAGAC | CCCAACAATAGCCACCAATAAAGA | (TG)9 | 54 | Allouis et al. 2001 |
| PSMP2248 | 62 | Genomic | TCTGTTTGTTTGGGTCAGGTCCTTC | CGAATACGTATGGAGAACTGCGCATC | (TG)10 | 58 | Allouis et al. 2001 |
| PSMP2255 | 62 | Genomic | CATCTAAACACAACCAATCTTGAAC | TGGCACTCTTAAATTGACGCAT | (TG)34 | 54 | Allouis et al. 2001 |
| PSMP2266 | 72 | Genomic | CAAGGATGGCTGAAGGGCTATG | TTTCCAGCCCACACCAGTAATC | (GA)17 | 58 | Allouis et al. 2001 |
| PSMP2267 | 33 | Genomic | GGAAGGCGTAGGGATCAATCTCAC | ATCCACCCGACGAAGGAAACGA | (GA)16 | 60 | Allouis et al. 2001 |
| Xipes0219 | 42 | EST | GGGGAAGAGATAGGGTTGGT | AGCTGGGCAATAGCGAGAT | TTT(CT)8TT | 57 | Raiaram et al. 2013 |
| Xipes0093 | 52 | EST | GGATCTGCAGGTTTGGACAT | CCAAGCACTGAAACATGCAC | (TGA)10 | 57 | Raiaram et al. 2013 |
| Xipes0191 | 52 | EST | GAAGAACCTCCAGCTTTCCC | TTCTTTCCTTCAGCCTCTGC | (AG)13 | 53 | Raiaram et al. 2013 |
1CN=Chromosome number.
2Genetic location of the markers based on pearl millet linkage groups (Raiaram et al. 2013); NK=Not known.
3Predicted location of the markers on pearl millet chromosomes (https://www.ncbi.nlm.nih.gov/assembly/GCA 002174835.1/)based on blast alignment of the primers.
Amplification and electrophoresis
The PCR was performed in a reaction volume of 15 uL containing 1 x PCR Taq polymerase buffer (Fermentas), 0.2 mM dNTPs (Fermentas), 0.5 uM primers [labeled with different fluorescent dyes: 6-FAM (blue), VIC (green), NED (black), and PET (red)] (Applied Bio-systems, Foster City, CA, USA), 0.6 U Taq polymerase (Fermentas) and 150 ng DNA.
The PCR program consisted of an initial denaturation step at 95 °C for 3 min followed by 35 cycles of denat-uration at 95 °C for 30 sec, annealing using primer-specific annealing temperatures for 1 min and elongation at 72 °C for 2 min. The final elongation step was performed at 72 °C for 30 min followed by a holding step at 4 °C.
The PCR products were assessed by capillary gel electrophoresis. PCR products (1.2 uL each) were mixed with 8.87 uL Hi-Di-formamide and 0.107 uL fluorescent-labeled GeneScan™ LIZ size standard (Applied Bio-systems, Foster City, CA, USA) in a 96-well microtiter plate. Then, the aliquot solution was denatured at 95 °C for 3 min and quickly chilled on ice for 5 min to avoid the formation of double-stranded DNA. The products were loaded and run on a 3730 x l DNA Analyzer (Applied Biosystems, Foster City, CA, USA).
Data scoring and analysis
The marker data were captured using Genescan® collection software (Applied Biosystems, Foster City, CA, USA) and the resulting fragments (allele sizes in nu-cleotides) were scored using Genemapper® software version 4.1 (Applied Biosystems, Foster City, CA, USA). The allelic data were scored (rearranged) taking into account the ploidy level of the Napier grass genome (= tetraploid) where a maximum of 4 copies of alleles per locus would be expected. Where there was a single allele, 4 copies were scored and where 2 alleles per locus were observed, an equal dosage (2 copies for each allele) was recorded. Where there were 3 alleles per locus, 2 copies of an allele were scored for the allele with the largest peak area, while the other alleles were scored as a single copy, and whenever there were 4 different alleles, each allele was scored as a single copy. Then, the data were used to calculate the different measures of genetic variability as suggested by Laurentin (2009) for co-dominant markers. The calculated measures include allele size range, the number of alleles per locus and effective number of alleles. In addition, genetic diversity (heterozygosity), a measure of genetic variation of a population, was calculated from the allele frequency using the formula: H=1-£P2 j (where P2 j is frequency of i allele at j locus) as described by Nei (1973).
A Bayesian clustering approach implemented in STRUCTURE software (Pritchard et al. 2000) was used to infer presence of population stratification in the population. Burn-in period as well as Monte Carlo Markov Chain (MCMC) iteration number were set to 100,000 testing the probability of 20 K, each with 10 repetitions. An admixture model with correlated allele frequencies was selected. The results of the run were uploaded to the online software, Structure Harvester (Earl and von Holdt 2012), and the most likely number of subpopulations was determined by the Evanno Ak method (Evanno et al. 2005). The SSR data were also subjected to hierarchical cluster analysis using the Ward hierarchical clustering based on the Euclidean distance method in the R package pvclust (Suzuki and Shimodaira 2006). Principal coordinate analyses (PCoA) were conducted using the genetic distance, TriDistance matrix and covariance-standardized options of the software GenAIEx v.6.5 (Peakall and Smouse 2012).
Results
SSR marker polymorphism
SSR data for 166 of the 171 accessions were obtained with missing data points constituting around 13% of the generated data. Table 3 shows the number of alleles (Na), effective number of alleles (Ae) and heterozygosity (H) of each marker for the EMBRAPA active genebank collection, the ILRI genebank collection and both collections combined. The number of alleles per marker ranged from 1 to 15 and 1 to 22 with averages of 4.65 and 7.0 in the EMBRAPA and ILRI collections, respectively. For the whole collection, the number of alleles per marker ranged from 1 to 23 with an average of 7.45. The effective numbers of alleles were 5.011, 5.058 and 5.138 with averages of 2.518, 2.544 and 2.512 in the collections from EMBRAPA, ILRI and combined, respectively. Similarly, the level of heterozygosity ranged from 0.000 to 0.800 and from 0.000 to 0.821 in the EMBRAPA and ILRI collections with averages of 0.436 and 0.456, respectively. Across the whole collection, the heterozygosity value ranged from 0.000 to 0.808 with an average of 0.463. Of the 20 markers, marker PSMP2248 displayed no heterozygosity across the whole collection and markers PGIRD5 and Xipes0191 displayed no hetero-zygosity for the EMBRAPA collection.
Table 3 Number of alleles (Na), effective number of alleles (Ae) and heterozygosity (H) for each marker from the EMBRAPA active genebank collection, the ILRI genebank collection and both collections combined.
| Marker code | Fragment length (bp) | EMBRAPA collection | ILRI collection | Both collections | ||||||
| Na | Ae | H | Na | Ae | H | Na | Ae | H | ||
| CTM10 | 120-201 | 3 | 1.015 | 0.015 | 6 | 1.178 | 0.151 | 7 | 1.073 | 0.068 |
| CTM12 | 292-299 | 2 | 2.000 | 0.500 | 3 | 2.066 | 0.516 | 3 | 2.027 | 0.507 |
| CTM27 | 291-324 | 2 | 1.999 | 0.500 | 7 | 2.204 | 0.546 | 7 | 2.084 | 0.520 |
| CTM59 | 170-175 | 2 | 1.124 | 0.110 | 3 | 1.084 | 0.078 | 3 | 1.108 | 0.098 |
| CTM8 | 233-280 | 9 | 4.189 | 0.761 | 13 | 3.470 | 0.712 | 13 | 4.080 | 0.755 |
| PRIRD13 | 217-271 | 8 | 3.614 | 0.723 | 11 | 4.723 | 0.788 | 11 | 4.547 | 0.780 |
| PGIRD21 | 184-220 | 4 | 2.247 | 0.555 | 6 | 2.439 | 0.590 | 6 | 2.326 | 0.570 |
| PGIRD25 | 149-169 | 2 | 1.116 | 0.104 | 5 | 1.179 | 0.152 | 5 | 1.071 | 0.067 |
| PGIRD46 | 85-193 | 4 | 1.932 | 0.483 | 4 | 2.366 | 0.577 | 5 | 2.126 | 0.530 |
| PGIRD5 | 160-164 | 1 | 3.580 | 0.000 | 2 | 1.048 | 0.046 | 2 | 1.509 | 0.337 |
| PGIRD56 | 136-155 | 5 | 3.580 | 0.721 | 8 | 2.928 | 0.658 | 8 | 3.437 | 0.709 |
| PGIRD57 | 106-136 | 2 | 1.904 | 0.475 | 6 | 2.928 | 0.530 | 6 | 2.009 | 0.502 |
| PSMP2235 | 134-243 | 4 | 1.533 | 0.348 | 6 | 1.186 | 0.157 | 8 | 1.390 | 0.280 |
| PSMP2248 | 159 | 1 | 1.000 | 0.000 | 1 | 1.000 | 0.000 | 1 | 1.000 | 0.000 |
| PSMP2255 | 210-313 | 15 | 5.011 | 0.800 | 22 | 5.058 | 0.802 | 23 | 5.134 | 0.805 |
| PSMP2266 | 158-176 | 7 | 3.890 | 0.743 | 6 | 4.443 | 0.775 | 7 | 4.175 | 0.761 |
| PSMP2267 | 172-229 | 11 | 4.769 | 0.790 | 14 | 5.571 | 0.821 | 15 | 5.208 | 0.808 |
| Xipes0219 | 124-137 | 3 | 1.696 | 0.410 | 4 | 1.473 | 0.321 | 4 | 1.602 | 0.376 |
| Xipes0093 | 112-135 | 7 | 3.158 | 0.683 | 6 | 3.274 | 0.695 | 7 | 3.236 | 0.691 |
| Xipes0191 | 99-127 | 1 | 1.000 | 0.000 | 7 | 1.269 | 0.212 | 7 | 1.097 | 0.088 |
| Average | 4.65 | 2.518 | 0.436 | 7 | 2.544 | 0.456 | 7.45 | 2.512 | 0.463 | |
Allelic richness and uniqueness of the collections
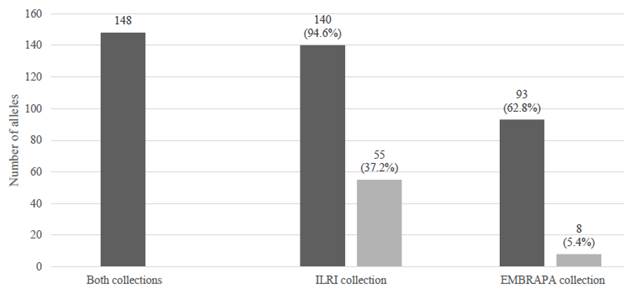
A total of 148 alleles representing 20 SSR markers were scored in the whole collection, with 93 and 140 alleles in the EMBRAPA and ILRI collections, respectively. Eighty-five of the alleles were shared between both collections, while 8 (5.4%) and 55 (37.2%) alleles were unique to the EMBRAPA and ILRI collections, respectively (Figure 1). Of the 140 alleles observed in the ILRI 21 alleles recorded for hybrid accessions, 18 alleles collection, 21 and 56 alleles were recorded for the hybrid contributed to the unique allelic richness of the ILRI and pure Napier grass accessions, respectively. Of the collection.
Population structure and cluster analysis
In the population stratification assessment and cluster analysis, accessions with more than 30% missing data points were removed and the resultant analysis was performed on 148 accessions (89 from EMBRAPA and 59 from ILRI). As shown in Figure 2, the distribution of the AK (Evanno et al. 2005) gave the highest peak at K=2 suggesting the presence of 2 major subpopulations. However, bar plots showed that up to 4 subpopulations, with both the EMBRAPA and ILRI collections represented in each subpopulation, are possible.
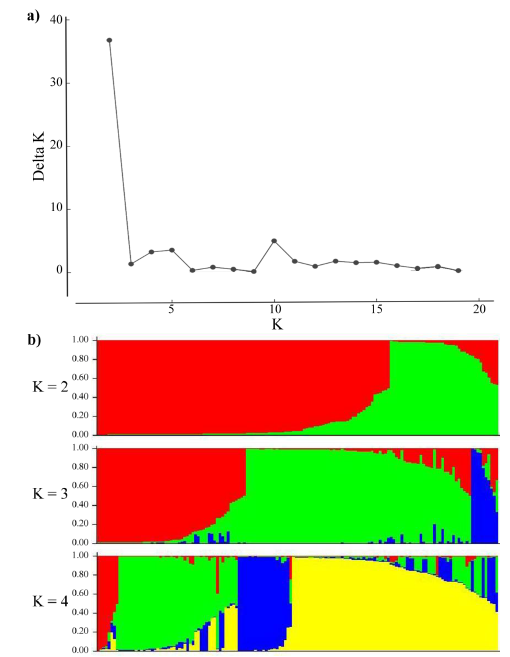
Figure 2 Population structure analysis: (a) Inferred using the Evano AK method; and (b) Bar plots showing the inferred subpopulations (K=2 to K=4) and their probability of group membership.
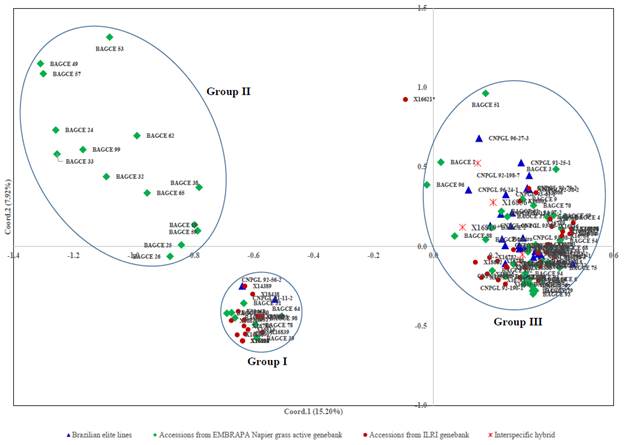
The hierarchical cluster analysis assembled the collections into 4 main clusters with further subclusters (Figure 3). Most of the EMBRAPA accessions were captured in Clusters II and IV, while the majority of the individuals in the other 2 clusters came from the ILRI genebank collection. A principal coordinate analysis (PCoA) was plotted based on the first 2 coordinates, which explained approximately 23% of the genetic variation. Here, 3 main groups were identified (Figure 4). Two of the groups (Groups I and II) were similar to Clusters I and II identified by the hierarchical cluster analysis with a few outliers, while the third group contained accessions in Clusters III and IV. Some genotypes (e.g. 16822, 16818, 16809 and 16810 in Cluster I; 16800 and 16801 in Cluster III; and 16785 and 16787 in Cluster IV) appeared to have very similar profiles and could not be discriminated by either analysis.
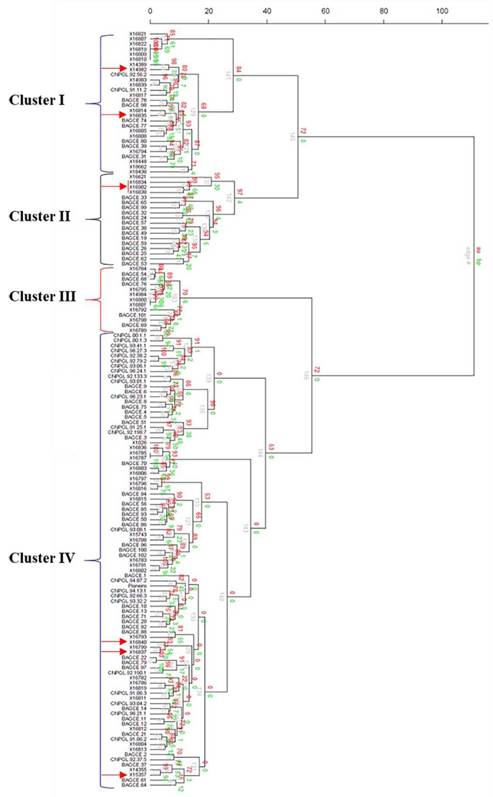
Figure 3 Cluster analysis of 148 accessions of Napier grass from the ILRI and EMBRAPA collections using 20 SSR markers based on Ward hierarchical clustering (Euclidean distance) method in the R package pvclust (the red arrows indicate the hybrid accessions). Au = Approximately Unbiased p-value, bp = Bootstrap probability value, and edge# = numeric vector of edge numbers. Accession codes starting with X are for accessions from the ILRI genebank, CNPGL are for Brazilian elite lines and BAGCE are for accessions from the EMBRAPA Napier grass active genebank.
Discussion
Efforts to explore Napier grass genetic diversity in support of better livestock performance and productivity are crucial in order to reduce poverty and enhance food security. By integrating advances in molecular biology, we can support and enhance the process of exploring the available genetic resources for efficient decision making during conservation and utilization. In this study, SSR markers were used to fingerprint a Napier grass collection maintained at the ILRI forage genebank as well as accessions from EMBRAPA, Brazil. The results revealed the existence of diverse genetic resources in the collections maintained by both centers and the presence of some distinct material in each of the collections. These results were used to support the transfer of some materials, representing greater genetic diversity, between Brazil and Ethiopia in order to enhance both genebank collections.
Comparing the two collections, greater allelic richness was discovered in the ILRI genebank collection, despite the fact that it contains only 59 accessions compared with 107 accessions from the EMBRAPA collection. This could be explained by the diverse origins of the accessions maintained in the ILRI genebank, as they were collected from 13 different countries, 8 of which are in Africa from where Napier grass is believed to have originated (Cook et al. 2005; CABI 2013), and the presence of hybrid accessions which contributed a number of unique alleles (12% of the observed alleles) to the collection. The EMBRAPA collection was obtained from only 7 different countries, mainly in Central and South America, where Napier grass has been introduced and become naturalized (Cook et al. 2005; Singh et al. 2013; CABI 2013) and presence of elite lines developed through the plant breeding process. Since most of these accessions were represented in 2 clusters, we assume that a limited range of genetic material was introduced to produce the naturalized material, resulting in a genetic bottleneck of material in this region. However, interestingly there was no clear correlation of clustering of the accessions based on their geographical origin across the 2 collections. Previous studies have provided conflicting results on this point with clustering of genotypes according to their geographical origin using Random Amplification of Polymorphic DNA (RAPD) and Amplified Fragment Length Polymorphism (AFLP) markers (Lowe et al. 2003; Harris et al. 2010) and no such observation using AFLP markers (Struwig et al. 2009; Wanjala et al. 2013). There were also 8 hybrid Napier grass accessions in the ILRI collection and, unlike in the study of Lowe et al. (2003) using RAPDs, where 6 of the hybrids clustered separately from the pure Napier grass accessions, the hybrids were dispersed into different clusters on the phylogenetic tree.
A literature search on Napier grass pedigrees and variety descriptions yielded little information that could be used to enhance our understanding of the relationship between genotypes and guide the selection of distinct genotypes for gap filling. There is also limited information available on the history of germplasm transfer from institutes that supplied the original samples and only a single accession (the dwarf elephant grass, cv. Mott) could be definitively identified as being in both collections. Molecular markers have been used to assist in the conservation and management of plant genetic resource collections over the last few decades (Spooner et al. 2005) with a positive cost-benefit implication indicated. In this study, a number of accessions with novel DNA fingerprints were identified in each collection and this information was used to support the decision of which accessions to exchange between the centers. From a genebank management perspective, the use of DNA fingerprint information to support this decision helps to avoid the acquisition of duplicates and/or very similar accessions as well as the identification of distant accessions and novel clusters.
In the future, the generated information could also be used to help establish a 'core' collection with the minimum number of accessions representing the maximum possible diversity in the species and to select parent material for future crosses in plant breeding programs. By undertaking this research, the cost of confirming a large collection of materials is free of diseases, and/or of importing duplicates and closely related accessions could be avoided. For example, DNA of 83 accessions from EMBRAPA were acquired and fingerprinted alongside the ILRI genebank collection. Based on the DNA profile, a decision was made to import planting materials of 25 accessions which were found to be distinct from the accessions held in the ILRI genebank collection in order to capture the maximum genetic diversity possible, together with the elite lines which are likely to have potential for production in East African countries such as Ethiopia and Kenya. Furthermore, 8 distinct accessions from the ILRI collection were also added to the EMBRAPA collection. Thus, there was no need to import all accessions and establish them in the field, which would be expensive in terms of time, space and labor required. In addition, confusion among lines is common as they are moved around and given new names and identification numbers so that the same genotype may be found under different names and even different genotypes can be found under the same name. This underscores the multitude of benefits of using molecular information in the management of genetic resources.
In the current trend of genetic resource utilization, where plant variety rights and intellectual property have become of growing importance, it is also necessary to document the genomic profile of accessions maintained in the genebanks where the materials are held as an international public good. The DNA profile is very useful for tracing the distribution and use of true-to-type accessions held in these genebanks. Consequently, the result of the SSR profile analysis can contribute substantially to management, conservation, research and use of the Napier grass accessions. The marker panel used in this work could be applied to further exchanges of Napier grass accessions between genebanks.
In conclusion, the study has been able to identify the presence of diverse genetic variability in the two collections of Napier grass while also demonstrating the importance of integrating molecular tools in the cost-effective determination of genetically distinct germplasm for gap filling, germplasm exchange and enhancing collections of Napier grass.

