


 English (pdf)
 Article in xml format
 Article references
 Send this article by e-mail
 Cited by SciELO
  Cited by Google
  Similars in
SciELO
Similars in
SciELO  Similars in Google
 Permalink
Introduction
Acid-base disorders are frequent, especially in the critical patient. Although most of the cases derive from a preexisting pathology, they can also manifest themselves in a primary context.1,2 The proper identification of the acid-base disorder allows to characterize the causative pathological process.1-4 Classically, different authors: Siggard, Andersen, Henderson, Emmett, Hasselbalch and Stewart have contributed to the understanding of the acid-base balance.3-6 In clinical practice, three models are currently used: (A) The Henderson-Hasselbalch equation to classify the acid-base disorders.6 (B) The base excess concept by Siggaard-Andersen7 as a parameter to assess the magnitude of the metabolic abnormality.6 (C) The strong ion difference proposed by Stewart, 8,9 which offers more information about extreme acid-base conditions observed in the critical patient. 4 The correct interpretation of the blood gasometry requires the integration of the above mentioned three models in order to specify a diagnosis, quantify a therapeutic response and monitor the severity or the progression of a pathological process. 3-5 The aim of this article is to originally propose a diagnostic algorithm for guiding physicians to perform an adequate correlation between the clinical condition of critical patients and their acid-base parameters, in order to achieve an accurate characterization of the patients' acid-base disorders.
Material & Method
A review of the literature was performed in the PubMed, Scopus and Science Direct databases. The following MESH terms were used for the advanced search, such as "acid-base equilibrium" or "acid-base imbalance" or "acidosis "or " alkalosis", which were included in the articles title, abstract or key words. The search was restricted to articles published after 2000, although some previous articles were reviewed in order to describe traditional approaches. The articles were selected according to the title and the abstract and sorted by topics considered relevant by the authors for performing a detailed review, including pathophysiology, divergences, clinical approach (according to different authors), diagnosis, and management.
Blood gasometry
The blood gasometric study is indicated when there is the need to evaluate the ventilatory status, the oxygenation and the acid-base balance in order to establish a diagnosis, measure the therapeutic response to oxygen-therapy and monitor the severity of a pathological process. 10 The blood gas analyzers use three types of electrodes for the direct measurement of the hydrogen-ion potential (pH), the partial pressure of oxygen (pO2) and the partial pressure of carbon dioxide (pCO2), from these measurements it is possible to mathematically calculate other parameters such as the bicarbonate ion (HCO3 -), the base excess (BE), and the oxygen saturation (SaO2) (Table 1). 6,11,12
Table 1 Normal serum parameters
| Parameter | Normal Value |
|---|---|
| pH | 7.35-7.45 |
| pCO2 (mmHg) | 35-45 |
| HCO3 - (mmol/L) | 20-24 |
| pO2 (mmHg) | 80-100 |
| SaO2 (%) | 95-100 |
| BE | -2 to +2 |
| Lactate (mmol/L) | <2 |
| Na+ (mEq/L) | 135-145 |
| K+ (mEq/L) | 3.5-5.5 |
| Cl- (mEq/L) | 95-105 |
pH: hydrogen-ion potential; pCO2:: partial pressure of carbon dioxide; HCO3 -: bicarbonate ion; pO2: partial pressure of oxygen; SaO2: arterial oxygen saturation; BE: base excess; Na+: sodium ion, K+: potassium ion, Cl: chloride ion.
Source: own elaboration.
Importance of pH regulation
The hydrogen-ion (H+) is one of the most important parameters in the acid-base balance and its concentration depends on the interaction between the pCO2, the plasma concentration of HCO3- and the dissociation constant of H2CO3. 12-14 The pH at physiological levels is essential for biological processes, including the supply of oxygen to the tissues, the correct structure of the proteins and countless biochemical reactions that depend on a neutral pH to be in equilibrium. 12,15,16 In addition, cell functions such as glycolysis, gluconeogenesis, mitosis, DNA synthesis, among others, are altered by acute changes in pH. Therefore, a series of compensatory mechanisms is required to respond quickly to the changes in the concentration of H+ in all cellular compartments. 12,16,17
Compensation systems
The concentration of H+ within the plasma and other aqueous solutions is tightly regulated. The cell metabolism produces about 70 mmol/day of H+, but under physiological conditions, the concentration remains balanced between 36-43 nmol/L, 9,17 due to the following regulation systems:
Buffering: It is a rapid physicochemical response. A buffer is a solution that resists the changes in pH when acids or alkalis are added. The buffers that regulate the pH in intracellular and extracellular fluids include sodium bicarbonate (NaHCO3), carbonic acid (H2CO3), phosphates, proteins (albumin, globulins), hemoglobin and oxyhemoglobin. 12,16-18 The dynamics of the system is predominantly of HCO3-/ H2CO3 as follows:

Le Chatelier principle establishes that when the concentration, pressure or temperature variables change, the systems in equilibrium react accordingly to reestablish a new equilibrium state, which indicates that if more H+ are produced, the equation will shift to the left so that more reagents are formed and the system remains in equilibrium. 12,17 The conversion of CO2 into H2CO3 is slowly catalyzed by the carbonic anhydrase present in the pulmonary and renal tissues. The H2CO3 is slowly ionized to produce H+ and HCO3-, while the NaHCO3 is completely ionized to produce HCO3-.4,5,14
The respiratory system, increases or reduces the concentration of H+ or CO2, through changes in alveolar ventilation (hypoventilation or hyperventilation, respectively) mediated by chemoreceptors. From the quantitative point of view, it is the predominant system and depends on the complete oxidation of the anions during the Krebs cycle. 3,16,19,20
The renal system, eliminates the H+ produced in the amino acids metabolism, through the formation of urea or ammonium ion, at the same time that the secretion of H in the proximal tubule increases or decreases; in addition, it reabsorbs around 80% of the HCO3-. There is an important relationship between the transport of HCO3- and the excretion of acid because during acidosis, the excretion of titratable acid (phosphate buffer) is modified inversely with the administered amount of HCO3-. The distal acidification is constituted not only by the titratable acidity, but fundamentally by the ammoniacal acidity, which is regulable as it can be induced by aldosterone. 3,12,13,18,21
Therefore, the acid-base balance disorders will have a compensatory response: renal, mediated by HCO3- in respiratory disorders, and respiratory, mediated by CO2 in metabolic disorders (Table 2).
Table 2 Primary disorders and expected compensations
| Primary disorder | pH | pCO2 | HCO3- | Compensatory change | ||
| Respiratory acidosis | <7.35 | >45 | - | HCO3 - | < | |
| Metabolic acidosis | <7.35 | - | <20 | pCO2 | < | |
| Respiratory alkalosis | >7.45 | <35 | - | HCO3 - | < | |
| Metabolic alkalosis | >7.45 | >24 | pCO2 | < | ||
pH: hydrogen-ion potential; pCO2: partial pressure of carbon dioxide; HCO3-: bicarbonate ion
Source: own elaboration
In addition, acid base disorders can be characterized according to the increase or decrease of the pH/ HCO3-/pCO2 variables in order to identify the evolution time as acute, subacute and chronic. (i.e., if a metabolic alkalosis have increased pH, HCO3- and pCO2 it indicates a subacute metabolic alkalosis) (Table 3). 4,6,16
Table 3 Evolution of acid-base disorders
pCO2: partial pressure of carbon dioxide; HCO3-: bicarbonate ion
In the table 4, useful formulas are provided for acid-base interpretation that allow to calculate the compensatory response of the renal and respiratory systems. (i.e., if a metabolic acidosis produces HCO3- of 15 mEq/L, the expected pCO2 is (1.5 x 15 + 8) ± 2= 30.5 ± 2 mmHg). If the measured pCO2 is equivalent to the expected pCO2, the respiratory compensation is adequate and the condition is called compensated metabolic acidosis. 12,18,22
Table 4 Primary disorders and compensatory responses
| Primary Disorder | Expected result |
| Metabolic acidosis | Expected pCO2 = (1.5 x HCO3 - + 8) ± 2 |
| Metabolic alkalosis | Expected pCO2 = (0.7 x HCO3 - + 23) ± 2 |
| Acute respiratory acidosis | Expected HCO3 - = 24 + 0.1 x (pCO2 - 40) |
| Chronic respiratory acidosis | Expected HCO3 - = 24 + 0.4 x (pCO2 - 40) |
| Acute respiratory alkalosis | Expected HCO3 - = 24 - 0.2 x (40 - pCO2) |
| Chronic respiratory alkalosis | Expected HCO3 - = 24 - 0.5 x (40 - pCO2) |
pCO2: partial pressure of carbon dioxide; HCO3- : bicarbonate ion
Acid-Base Interpretation Models
(A) Henderson-Hasselbalch equation
The traditional Henderson-Hasselbalch approach defines the pH in its non-logarithmic variant as [H+] = 24 + pCO2/HCO3-. The model is based on the application of the mass action law in equilibrium of CO2 and the existing relationship between the plasma HCO3- and the concentration of strong acids, 20,23 through the following formula:
pH = pKa + log10 [HCO3-] / (0.03 x pCO2)
In this equation, pKa is the negative logarithm of the acid dissociation constant of the weak acid. The equation allows to infer that the CO2 and the HCO3- are variables that determine the system that corrects the alterations of the H+, which allows to classify the acid-base disorders according to the primary type of acid that is increased or decreased. 16,24
Although it is mathematically accurate, it does not consider aspects such as the presence of buffers other than HCO3- (plasma proteins), the intervention of weak acids such as phosphates and the directly proportional correlation that exists between HCO3- and pCO2. 8,22,24
Metabolic acidosis can be induced by two main mechanisms: bicarbonate consumption secondary to buffer activity, or body bicarbonate loss. Both conditions can be distinguished by evaluating the patient's anion gap (AG) value.
Acid-base imbalance: a review with proposed unified diagnostic algorithm
Running head: acid-base imbalance
Anion gap
The AG is the difference between plasma anions and cations, based on the electroneutrality principle. The resulting value is usually positive (12 ± 2 mEq/l), and reflects anions such as proteins, phosphates and sulfates. 20,23,25
The mnemonic to remember the causes of metabolic acidosis with increased AG is "MUDPILES": Methanol, Uremia, Diabetic ketoacidosis (DKA), Paraldehyde, Isoniazid and Iron, Lactic acid, Ethylene glycol and Ethanol induced ketoacidosis, Salicylates. It is used to establish the differential diagnosis of the metabolic acidosis because it allows to distinguish the causes. 5,25 For the metabolic acidosis with normal AG is used the mnemonic
"ACCRUED": Aldosterone inhibitors, Compensation for respiratory alkalosis, Carbonic anhydrase inhibitors (acetazolamide), Renal tubular acidosis (RTA), Ureteral diversion, Extra alimentation and Diarrhea4. Regarding the limitations of the AG, they include: assumption of normal concentrations of albumin and phosphates, exclusion of unmeasured ions, therefore, in the critical patient26 the corrected AG must be used:
(Na+ + K+) - (Cl- + HCO3-) + 2.5 (Normal albumin - Measured albumin)
A corrected AG value above 12 indicates metabolic acidosis with increased AG, and a corrected AG value under 12 indicates metabolic acidosis with normal-decreased AG. There may be situations where concurrent metabolic disorders exist. To identify if mixed metabolic disorders are present, the delta Gap should be calculated ( Gap = Corrected AG - Calculated AG). An AG delta > 6 is a metabolic acidosis with increased AG and an AG delta <6 is a metabolic acidosis with normal AG. When there is a suspicion that the origin of the metabolic acidosis is a toxic agent, it will be indispensable to calculate the osmolar gap (OG) by applying the following equation. 4,5,25
OG = measured serum osmolarity - calculated serum osmolarity
In a case of increased AG metabolic acidosis secondary to intoxication, the OG value would be higher than 10. In case of a normal AG metabolic acidosis, the urinary AG should be obtained by applying the following equation: 5,25
Urinary AG = (urinary sodium + urinary potassium) - urinary chloride
A positive urinary AG value (>20) suggests a normal AG metabolic acidosis secondary to distal renal tubular acidosis, while a negative urinary AG value (<-20) suggests a normal AG metabolic acidosis secondary to proximal tubular acidosis or bicarbonate loss due to diarrhea.
Base Excess
In order to understand how the pH and the concentration of HCO3- are altered independently of the pCO2, Siggard-Andersen proposed the concept of base excess (BE) as the amount of acid-base or strong base required to maintain the pH in 7.4 and a temperature of 37 °C with a pCO2 of 40 mmHg. 3,15,25-27. The BE normal value is -2 to +2. The BE limitation is that it does not allow to determine the metabolic acidosis cause and assumes that patient's serum albumin and phosphate levels are normal. Since serum albumin and phosphate levels in the critical patient are frequently decreased, thus the corrected BE equation should be used. 27
BE = (HCO3- - 24.4) + (8.3 x albumin x 0.15) + (0.29 x phosphate x 0.32) x (pH - 7.4)
Peter-Stewart model
The Stewart model7 includes the analysis and the relationship of the components of human fluids (water, strong ions in water, weak acids in water and CO2) through the following fundamental physicochemical principles: electroneutrality principle, conservation of mass law, and equilibrium of electrochemical dissociation. In addition, it adds the HCO3 as a dependent variable, establishing that the changes in the H+ and therefore, in the pH, can only occur through the modification of three independent factors: (¡) pCO2 (ii) strong ion difference (SID) and (iii) total weak acid concentration (ATOT). 2,7,9,22 (i) The pCO2 is defined as the pressure exerted by the CO2 in the arterial blood, independently from each arterial gas. (ii) The SID is the difference between the sum of the plasma concentrations of cations and anions; the normal value is 36 to 40 mEq/L and it has a great electrochemical value on the dissociation of water: as the SID increases, the H+ decreases and consequently the pH increases to balance the electroneutrality. (iii) ATOT: body fluid compartments have varying concentrations of nonvolatile weak acids. The most important weak acids in plasma are proteins and phosphates. The same applies to interstitial fluid, although total concentrations here are very small. In red cells the predominant source is hemoglobin. 28
The ATOT represents the total amount of weak acids other than CO2 in plasma. Albumin (normal value: 3.5 to 5 g/dl) is the most important protein that acts as a weak acid. Organic phosphates (normal value: 2.5 to 4 mg/dl) represent 5% when their levels are normal. Therefore, albumin concentrations can be used to estimate plasma ATOT. 2,29,30
The non-dissociated acids are described as [HA] and the dissociated acids as [A-]. Then the weak acid dissociation reaction is:
HA
 H+ + A-
Based on the law of conservation of matter, if HA and A- do not participate in other reactions in the solution, the sum of [HA] and [A-] will remain constant, then:
[ATOT] = [HA] + [A-]
Although [A-] varies with pH, ATOT does not, and as such it is an independent variable. 28,29
From Peter-Stewart model, it can be concluded that the pH variations depend on the degree of dissociation of the plasma water (H+, OH-) as a source for H+ production and in turn, this dissociation depends on the three independent factors (pCO2, SID, and ATOT). 30,31
Clinical application: Diagnosis of the acid-base disorders in 7 steps
The approach to the acid-base disorders, requires to establish a clinical correlation between the medical record of the patient (anamnesis and physical examination) and the gasometric parameters. 3,14 In this review, we recommend the use of a systematic approach to problem solving through a diagnostic algorithm (Figure 1 and Figure 1.1), in order to guide the correct interpretation and the diagnosis of the acid-base disorders through the following analytical sequence:
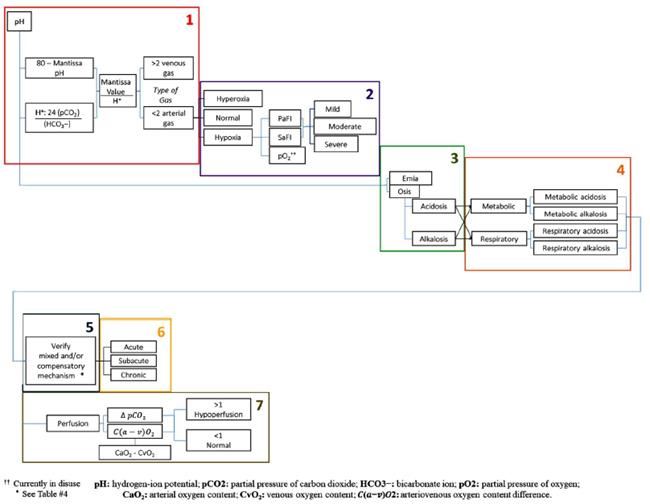
Step 1. Identify the type of gas: the correct reading of the blood gasometry requires the verification of the arterial gas, through the ratio between the formula (80 -Mantissa pH) and the calculation of hydrogen ions (H+= 24 (pCO2)/HCO3-), where the mantissa refers to the decimal fraction of a logarithm that follows the characteristic or whole part (example. 7.34, the whole part is 7 and the mantissa is 0.34). If the result is <2, then we confirm arterial gas and the analytical sequence is continued.
Step 2. Degree of Oxygenation: the Pa/Fi index, which relates the arterial oxygen pressure and the fraction of inspired oxygen (pO2/FiO2) is assessed, the alteration in gas exchange is measured as mild (200-300), moderate (<200 - > 100) and severe (<100) respiratory distress. The Pa/Fi index allows the non-invasive monitoring of the oxygenation without requiring a gasometric study.
Step 3. Evaluate the pH status: determine if the blood pH indicates acidosis (<7.35), alkalosis (>7.45) or if it is within the normal range (7.35-7.45). The suffix "emia" is used when the pH is outside the normal range and "osis" when there is an acid-base alteration in which the pH is within the normal range.
Step 4. Characterize the primary disorder, which is the component that can explain the pH value: through the analysis of the metabolic (HCO3-) or respiratory (pCO2) component, in order to determine the origin or the predominance of the acid-base disorder (Table 2).
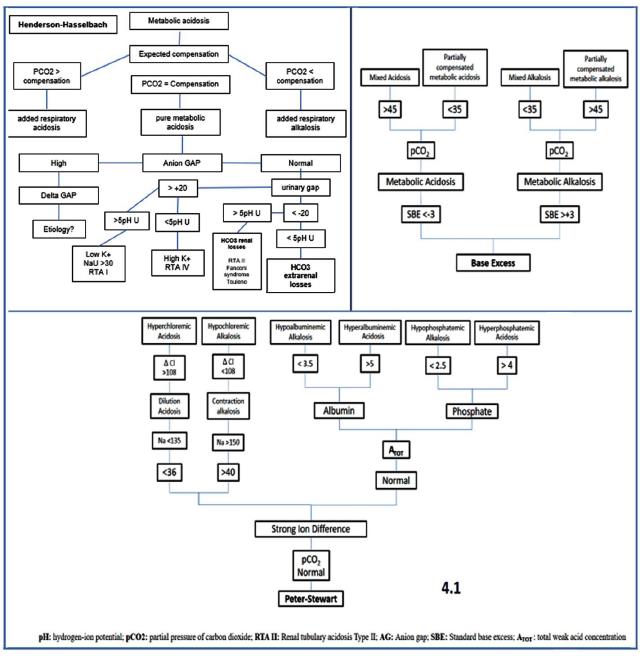
Step 4.1. If the disorder is metabolic, the three theories (Henderson-Hasselbalch, base excess and Peter-Stewart) should be applied in order to establish the differential diagnosis, assess the magnitude of the alteration and characterize the metabolic disorder (see Figure 1.1).
Step 5. Determine the compensatory response or the mixed disorder: subsequent to the identification of the primary disorder (metabolic or respiratory), it should be verified if the other component makes the compensation of the pH or if actually adds some other acid-base disorder. If both the measurement of the pH and the pCO2 are abnormal it is considered a mixed acid-base disorder (Table 2 and Table 4).
Step 6.Calculate gap delta. This provides very important information for the diagnosis of mixed disorders. it is calculated with the following formula (real AG - ideal AG) / ideal HCO3 - real HCO3). values less than 0.4 correspond to hyperchloremic acidemia. between 0.5 and 1 to pure metabolic acidosis, 1.1 to 1.5 is equivalent to lactic acidosis and greater than 1.6 explains an over-added metabolic alkalosis.
Step 7. Identify the evolution of the disorder: through the increase or decrease of the pH/HCO3-/ pCO2 variables it is possible to determine the time of evolution of the acid-base disorder as acute, subacute and chronic (Table 3)
Step 8. Evaluate the perfusion: the ratio between the CO2 delta (arterial CO2 - venous CO2) and the arteriovenous oxygen content difference, C(a-v)O2 (arterial oxygen content, CaO2, and venous oxygen content, CvO2). The C(a-v)O2 depends on the SaO2, the SvO2 and the hemoglobin, 1 g of hemoglobin transports 1.34 mL of O2. 3,7,16,18,29,30,32-38
Illustrative Case
Below, the diagnostic algorithm for the diagnosis of the acid-base disorders proposed in Figure 1 is applied to the following clinical case:
Clinical Case: A 52-year-old female is admitted to the ICU, with a history of high blood pressure, type II diabetes mellitus, heart failure with left ventricular ejection fraction of 35%, the patient underwent a surgical intervention consisting of an open cholecystectomy, and in the first postoperative day she presented signs of hemodynamic instability associated with anemia requiring a new intervention due to bleeding of the gallbladder bed. Two days later, she presented fever, tachycardia, tachypnea, disorientation, and a decrease in diastolic blood pressure with requirement of oxygen with FiO2: 0.5. The presumptive diagnosis was a septic shock with tissue hypoperfusion, associated with subphrenic abscess. The following are the laboratory parameters:
Arterial Gases
pH: 7.17
pCO2: 25 mmHg
pO2: 84 mmHg
HCO3 -: 11 mEq/L
SaO2: 78%
BE: - 14
Venous Gases
pH: 7.1
pCO2: 26 mmHg
pO2: 70 mmHg
HCO3 -: 18 mEq/L
SvO2= 72%
BE: - 16
Chemical Panel
Na+: 135 mEq/L
K+: 3.5 mEq/L
Cl-: 100 mEq/L
P: 2.5 mg/dl
Lactate: 8 mmol/L
Hemoglobin: 10.4 g/dl
Albumin: 2 gr/dl
Based on the analytical sequence, (Step 1) we begin with the verification of the type of gas obtained, applying the formula as follows:
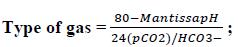
Then, replacing values:
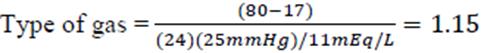
A value of 1.15 is obtained, which indicates arterial gas. Therefore, we proceed with the analysis.
Then, (Step 2) the oxygenation degree of the patient is identified with the Pa/Fi index as follows:
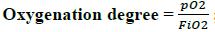 ;
;Then, replacing values,

This result indicates moderate hypoxemia, range (<200 - >100).
In relation to the acid-base disorder, (Step 3) in this case, the pH is below 7.35 indicating an acidosis.
(Step 4) The HCO3 - is decreased indicating the primary disorder as a metabolic acidosis (see table 2).
(Step 5) Using the formula to assess for compensation would yield a calculated pCO2 as follows (see table 4):
Expected pCO2 = (1.5 x HCO3 - + 8) ± 2;
Then,
Expected pCO2 = (1.5 x 11 mEq/L + 8) ± 2 = 24.5 mmHg ± 2;
Therefore, since the calculated pCO2 (24.5 mmHg) is lower than the measured (25 mmHg), the patient has a mixed disorder: metabolic acidosis and respiratory alkalosis.
Then, (Step 6) the pH, HCO3 - and pCO2 are decreased indicating a subacute metabolic acidosis (see table 3).
Since it is a metabolic disorder, it is continued (Step 4.1) with the application of the three theories: (A) Henderson-Hasselbalch: the difference between serum anions and cations is calculated as follows:
AG = (serum Na+ + serum K+) - (serum Cl- + serum HCO3 ?)
Then, replacing values,
AG = (135 mEq/L + 3.5 mEq/L) - (100 mEq/L + 11 mEq/L) = 27.5
Next, the result must be corrected because this case is a critical patient, through the following formula:
Corrected AG = Calculated AG + 2.5 (Normal albumin - Measured albumin)
Then,
Corrected AG = 27.5 + 2.5 (4.5 g/dl - 2 g/dl) = 33.75
This result indicates metabolic acidosis with increased AG. In order to verify that there is no other underlying acid-base disorder, the AG delta is calculated as follows:
Gap = Corrected AG - Calculated AG
Replacing values,
Gap = 33.75 - 27.5 = 6.25
Because this value is >6 the metabolic acidosis with increased AG is confirmed. Due to the presence of increased lactate (8 mmol/L) (See table 1) and following the mnemonic
"MUDPILES", it is considered a hyperlactatemic metabolic acidosis secondary to septic shock (see Figure 1.1).
Regarding the calculation of the base excess, the corrected BE equation must be used as follows:
BE = (HCO3- - 24.4) + (8.3 x albumin x 0.15) + (0.29 x phosphate x 0.32) x (pH - 7.4),
Then, replacing values:
BE = (11 - 24.4 mEq/L) + (8.3 x 2 gr/dl x 0.15) + (0.29 x 2.5 mg/dl x 0.32) x (7.17 - 7.4) = -10.9
Since the BE is -10.9, the metabolic acidosis is confirmed. In addition, the pCO2 <35 mmHg is indicating a partially compensated metabolic acidosis (see Figure 1.1).
Peter-Stewart, the decreased pCO2 indicates a respiratory alkalosis. Then, the SID is calculated as follows:
SID = serum Na+ + serum K+ - serum Cl-
Then, replacing values,
SID = (135 mEq/L + 3.5 mEq/L - 100 mEq/L) = 38.5 mEq/L
The result obtained is within the normal range (36 - 40 mEq/L), and for this reason the ATOT must be assess: the decreased albumin indicates a hypoalbuminemic alkalosis and hyperlactatemic organic acidosis (See Figure 1.1).
Finally, (Step 7) the perfusion is assessed as follows: First, the C(a-v)O2 is evaluated as the different between CaO2 and CvO2. The C(a-v)O2 depends on the SaO2, the SvO2 and the hemoglobin, 1 g of hemoglobin transports 1.34 mL of O2 The CaO2 and CvO2 are calculated as follows:
CaO2 = (Hb x 1.34 x SaO2);
CaO2 = (10.4 g/dl x 1.34 x 0.78) = 10.87 vol%
And,
CvO2 = (Hb x 1.34 x SvO2);
CvO2 = (Hb x 1.34 x SvO2);
CvO2 = (10.4 g/dl x 1.34 x 0.72) = 10.03 vol%
Then, the C(a-v)O2 is assessed:
C(a-v)O2 = CaO2 - CvO2;
C(a-v)02= 10.87 vol% - 10.03 vol% = 0.83 vol%
Second, the
 pC02 is calculated as the differrence between venous pC02 and arterial pC02:
 pC0
2
= Venous pC0
2
- Arterial pC0
2
;
pC0
2
= Venous pC0
2
- Arterial pC0
2
;
pCO2 = 26 mmHg - 25 mmHg = 1 mmHg
Third, using these parameters: C(a-v)02 and
pCO2 the perfusion is assessed through the following formula:

Then, replacing values,
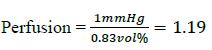
The result obtained indicates hypoperfusion because the value is above 1 (See figure 1)
Conclusions
The use of a logical and systematic approach is necessary to properly interpret the parameters of the blood gasometry and timely identify the acid-base disorder. In clinical practice, the Henderson-Hasselbalch theory is a simplified and easy to measure model, the base excess provides an estimate of the magnitude of the acid-base disorder, and the theory of Peter-Stewart allows a more correct interpretation of the metabolic alterations mainly in the complex disorders of the critical patient. The incorporation of the three theories in a diagnostic algorithm facilitates a greater understanding of the pathophysiological mechanisms and allows us to identify a more precise therapeutic objective to correct the underlying disorder in the different clinical contexts of the patient.

