


 Inglês (pdf)
 Artigo em XML
 Referências do artigo
 Enviar este artigo por email
 Citado por SciELO
  Citado por Google
  Similares em
SciELO
Similares em
SciELO  Similares em Google
 Permalink
Introduction
Agribusiness has a prominent position in the world debate on economic development, as it promotes economic growth rates and helps to provide a better standard of living for a country's population (Ferreira, et al., 2006). In Brazil, agricultural activities had always played a material role regarding growth, income generation, and employment, as it can be seen in Figure 1, which shows the importance of the balance of trade of agribusiness, agriculture, and livestock in the country's balance of trade.
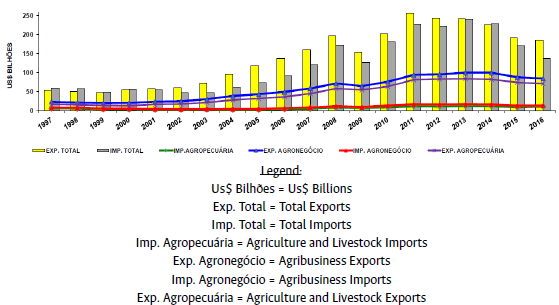
Source: Ministério da Agricultura, Pecuária e Abastecimento - MAPA (2016).
Figure 1 Evolution of the Brazilian balance of trade of agribusiness, agriculture, and livestock from 1997 to 2016
In this scenario of evolution of the Brazilian agribusiness and agricultural sector, agricultural policy plays a critical role as a support mechanism for agro-industrial production, especially for fitting its instruments to the economic conditions. In this regard, as pointed out by Teixeira, et al. (2014), the future performance of agriculture and livestock in Brazil is more and more related to the creation of new alternatives to support production and keep the activity in a continuous progression, with possibilities of expansion by means of modernization of the production structures.
The agricultural sector is highly relevant in the state of Pará, located in the Eastern Amazon region, and livestock is the main economic activity, accounting for about 54% of the GDP of the primary sector of the State, while agriculture accounts for 27% (The State of Pará Research Foundation - FAPESPA, 2015). The positive performance of the State especially results from the technological modernization process, which introduced new production systems, improved pasture, and promoted genetic and sanitary improvement of the herd, as well as care about animal wellness, for livestock, while in agriculture, the positive result in the state results from the region's good edaphoclimatic conditions, good arable lands, and large territories with potential to develop sustainable irrigation (FAPESPA, 2015; Souza, et al., 2012).
Despite all the growth and modernization of agriculture in Brazil, it is important to highlight that the country has a large concentration of land, which is reflected by the high degree of land concentration in 2006 of 0.856 (Hoffmann & Ney, 2010). In addition to this evidence, Brazil having weak land laws, only 51.35% of its land is registered in the National Rural Registry System (SNCR). Specifically in the Legal Amazon, 509 million hectares in the region, about 30% of these may be legally uncertain records, which shows that the classic concentration of land may be associated with a lack of land taxation (Sauer & Leite, 2012).
Due to the great importance of the agricultural sector for economic growth, policies intended for improving this sector are essential. Among the agricultural policies that support the sector, the National Policy of Technical Assistance and Rural Extension (Pnater) and the Rural Credit Policy stand out. In addition to these policies, which are mainly focused on the agricultural sector, other social policies end up playing a critical role to supplement the income of the rural environment, as Bolsa Familia.
Pnater's main scope is to promote rural development by generating more income and productivity in the agricultural activity, ensuring wellness for the rural environment, especially in developing countries, which are often associated with bigger populations living in rural areas (Anderson & Feder, 2004). According to Christoplos (2010), such goals can be achieved, given that the Technical Assistance and Rural Extension Policy (Ater) makes it easier for the producers and their facilities to have access to knowledge, information, and technology, which also represents a link with partners in research, education, and other relevant institutions, as well as helping these manufacturers to increase their management, technical, and organizational skills and practices. The amount invested in technical support and rural extension in Brazil in 2012 was about R$1 billion, while in the State of Pará it was R$6.2 million (Finanças do Brasil - Secretária do Tesouro Nacional - FINBRA, 2017).
Regarding the rural credit, it is one of the bases of the Brazilian agricultural policy and is one of the main support instruments for the sector, in addition to contributing to the development of family agriculture. Despite the low participation of the National Program for Strengthening Family Agriculture (Pronaf) in the total distribution of funds, if compared to business agriculture, the program managed to serve a large portion of small farmers that had difficulties accessing the rural credit until then. In 2016, the State of Pará accounted for about 27% of the rural credit portfolio made available to Brazilian North Region, which corresponds to 1.10% of the whole Brazilian credit portfolio (MAPA, 2016).
In addition to such abovementioned policies, another public policy with significant effects on the rural environment, despite not being a policy intended for the agricultural sector, is Bolsa Familia. The Program was initiated in 2004 and aims to prevent, fight, and reduce poverty (Duarte, et al, 2009). Thus, as pointed out by Nunes and Mariano (2015), the program helps to reduce poverty in the rural environment. In Pará, according to data from the Ministry of Social Development and Fight Against Hunger (Data Social, 2018), in 2016, 898,914 families were benefited.
Given the foregoing, a more robust evaluation of the effect of technical support, rural credit, and social welfare programs on the efficiency of agricultural producers, in terms of productivity, is relevant, since it can lead to the creation and/or improvement of policies and even to better resource allocation in this sector.
The papers on Brazilian public policies and efficiency in the literature only emphasize policies intended for the agricultural sector, as Pnater and Rural Credit (Rada & Buccola, 2012; Rada & Fuglie, 2019). However, there is a gap regarding the effect of other policies, such as Bolsa Familia, on the technical efficiency of rural facilities, especially those of the State of Pará. Hence, the objective is to investigate the effect of the public policies, Pnater, Rural Credit, and Bolsa Familia, on the technical efficiency of agricultural facilities in the State of Pará, considering different land strips.
To achieve this objective, the stochastic production frontier methodology will be used, with the use of variables to observe the effects of the previously mentioned policies on the technical efficiency of Eastern Amazon rural establishments. Therefore, we believe that this type of research is of great importance, once it can be a tool to depict the productive performance of rural facilities and observe if these public policies generate benefits to the rural environment.
In addition to this introduction, the paper is composed of four additional sections, theoretical framework on efficiency measures, methodology, results, and final considerations.
Theoretical Framework
Efficiency Measures
The premises of the neoclassical economic theory indicate that economic agents are rational and intend to optimize their behavior. In agriculture and livestock, for example, this behavior can be represented when producers try to maximize production and/or minimize costs. Thus, maximum profit would be obtained when both objectives are simultaneously achieved. However, in practice, not all producers manage to optimize these objectives, i.e., achieve economic efficiency in their activities (Almeida, 2012).
In the economic literature, concerning productivity, the efficiency measure is related to lower cost or higher production level in a certain production system. The first researchers to address this production efficiency were Debreu (1951), Koopmans (1951) and Shephard (1953). Thereafter, Farrell (1957) brings his contributions empirically, and estimates a production frontier (isoquant) by combining inputs and outputs of a set of manufacturing facilities.
In general, technical efficiency can be understood as the ideal combination of inputs used in production in order to produce the maximum output. In addition to this efficiency, we have allocative efficiency, which is related to the company's capacity to use inputs in ideal dimensions, given their relative prices. It is possible to reach economic efficiency by combining technical and allocative efficiency (Farrell, 1957).
The technical efficiency analysis can be output or input-oriented, as pointed out by Coelli, et al. (1998), which can be represented by Figure 2a and 2b, respectively. In Figure 2a, curve ZZ' represents the production possibility curve (PPC), point A corresponds to an inefficient production (below the PPC) and distance AB represents technical inefficiency, indicating that more products could have been produced using the same inputs. Once the prices are known, by curve DD', it would be possible to observe the allocative efficiency, which is represented by point B'.
Figure 2b represents the input orientation, where curve SS' is the isoquant of a technically efficient manufacturing facility, i.e., the possibility frontier for efficient use of inputs. Distance QP is the technical inefficiency (P is the number of inputs used), i.e., the quantity by which all inputs could be proportionally reduced without reducing the output. Technical efficiency can be reached by ratio OQ/OP. By knowing the prices of the inputs, it is possible to reach allocative efficiency, represented by ratio OR/OQ.
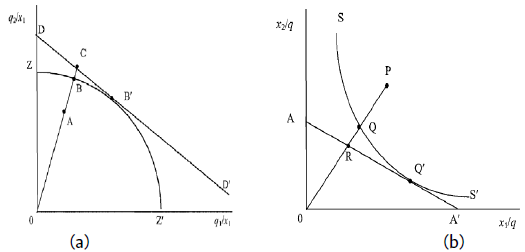
Source: Coelli et al. (1998).
Figure 2 Representation of technical and allocative efficiency for output orientation (a) and input orientation (b)
Hence, output-oriented efficiency is obtained by the maximum output that can be reduced with a certain input, while input-oriented efficiency is reached by the maximum reduction of inputs, maintaining the same output. In this research, due to the lack of information regarding the prices of certain factors of production, the technical efficiency shall be output-oriented.
Based on these papers, several models for efficiency analysis by estimating the production function were developed, with the main approaches being nonparametric and parametric. The nonparametric approach uses a linear program to identify the companies that use the best production practices in order to use them as a yardstick for other companies, where companies below the frontier are deemed ineffective. In summary, the only restrictions imposed to this approach are convex technology (perfect divisibility) and freely available inputs and outputs.
The parametric approach, on its turn, which shall be employed in this research, has as its main characteristic the fact that technology shall have a functional form, which can be deterministic or stochastic, in which the former assumes that all inefficiency results from the phenomena under control of the companies, while the latter assumes a compound error, i.e., one is unilateral and the other is symmetric (Barros, et al., 2004). This research shall use the parametric approach through the Stochastic Frontier Approach.
Methodology
This section shall introduce the Stochastic Frontier Approach, which shall be used in order to identify the effect of the public policies contemplated by the research (rural credit, technical support, cooperatives, and education) on the technical efficiency of the agricultural facilities of the state of Pará.
Stochastic Frontier Approach
The primary objective of the stochastic frontier approach is the estimation of a production function, through which it will be possible to obtain the maximum output based on a combination of factors at a certain technological level. However, Marinho (2016) points out that, given the existence of technical inefficiencies, it is not possible to guarantee the efficient use of the factors of production.
Aigner, Lovell and Schmidt (1977) and Meeusen and Van den Broeck (1977) were the first ones to divide the error term into two components. The graphic representation of the model can be observed in Figure 3, where V represents the random error and U the inefficiency.
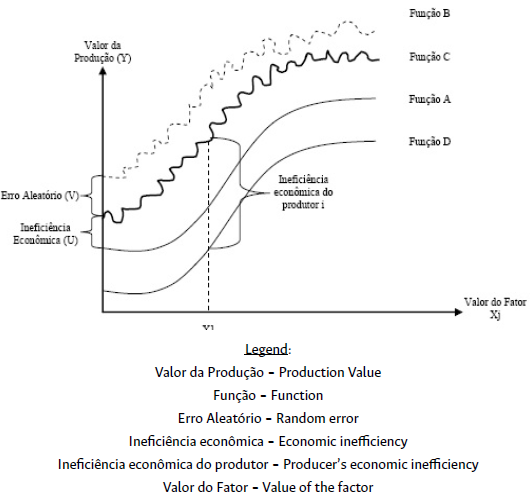
Source:Lima (2006).
Figure 3 Representation of the average production functions, given a hypothetical producer, represented by function D, and the stochastic production function, given by function C
Thus, the production frontier is obtained by estimating a production function (Function A), which is added to the composed error term (V+U), and results in a "Function B". By subtracting the part representing the random error (V) from this "Function B", we reach the stochastic frontier approach Function C. The distance between each individual producer (Function D) and the production frontier is a measurement of technical or economic inefficiency (Lima, 2006).
Empirical model
In the empirical approach of the model, it is necessary to define the functional form of the stochastic frontier, as pointed out by Coelli and Battese (1996), which can be done in several forms, as Leontief, Cobb-Douglas, and Translog. This research will employ the Cobb-Douglas function,1 in which scale returns are restricted to the same amounts for all companies of the sample and unit substitution elasticity.
In this paper, the agricultural facilities (i) shall be grouped by area groups (j). Accordingly, the specification of the stochastic frontier approach can be summarized as follows:

With the inclusion of dummy variables for city and total area group, the logarithmic form, according to Coelli, et al. (2003), can be specified as:

where Y ij . represents city i's production for the area group j; X ij .. represents the quantities of factors of production used, namely: area of the facility, work, capital, and expenses of inputs purchased; M m represents dummies for the cities of the State of Pará; G g represents dummies for the 10 total area groups taken into account; and bij is a vector of the parameters to be estimated, which define the production technology. Dummies will be included to capture fixed characteristics of each city and area group, in addition to try to control any potential spatial autocorrelation, in order to obtain an estimate of the efficiency, free of these effects.2
Error terms v ij and u ij are vectors representing different components of the error: v ij is the random error term, normally distributed, independent and identically distributed (iid), truncated at zero with variance s 2 v [v ~ iid N(0,sv] and captures the stochastic effects beyond the control of the manufacturing facility, as measurement errors and climate, for example; and u ij is responsible for capturing the technical inefficiency of the ith group, i.e., the part of the error that constitutes a downward deviation from the production frontier, and they are non-negative random variables. This unilateral term follows nearly normal, truncated normal, exponential, and gamma distribution (Aigner et al., 1977; Greene, 1980). In this paper, as well as in Tupy and Shirota (1998), exponential distribution was used.3
Regarding the correlations found, we expect to obtain a positive correlation between the explanatory variables and the gross production value, which can evidence a positive correlation between the increase in the factors of production and the increased agricultural production value.
It is important to note that, after estimating the production frontier, a vector of explanatory variables of the error term related to technical inefficiency is added, in which the variables representing the public policies of interest shall be included (Pnater, Rural Credit, and Bolsa Familia), namely, funding, assistance, and government income, which indicate if the facility had access to institutions, public assets, and social welfare programs. Thus, the equation estimated to identify the effects of such variables on the productive performance of the agricultural facilities of the State of Pará was specified as follows:

where ln T is the logarithm of the technical inefficiency of the facility i for area group j; funding represents if the facility received any funding; assistance represents the portion of producers that received any technical support from the government; government income represents the logarithm of the income from government social welfare programs; irrigation, represents the portion of producers who have access to irrigation technology; expertise is a variable that represents if the manager of the agricultural business has more than 10 years of expertise; storage represents the portion of producers with access to storage; education is a variable that represents low education of managers, and it is constructed by the sum of the proportion of the managers who cannot read and have incomplete elementary and middle school over the total number of producers; retirement represents the logarithm of the income from government retirement; and total area, which represents the total area of the facility in hectares.
After estimating the frontier function, in order to obtain the measure of technical efficiency, the Jondrow, et al. (1982) procedure is applied to separate the frontier's deviations into its random and inefficiency components. According to this procedure, technical efficiency can be defined as the ratio between the output observed and the potential output of the sample. Thus, the expression for technical efficiency of a certain observation can be defined as follows:
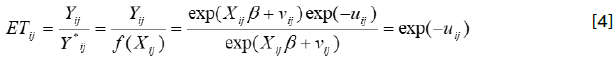
where the value of et ij shall be located in the interval [0;1], provided that zero represents full inefficiency and 1, full efficiency.
Source and Data Processing
Information on the variables employed in this research arise from a special tabulation of microdata from the 2006 Agricultural Census, carried out by the Institute of Applied Economic Research - IPEA. Such tabulation consisted of organizing all data according to the area category of the facilities and the condition of the producer, which enabled the use of a wider range of variables in this paper, which contributes to a more accurate estimate of the correlation between the public policies selected and the technical efficiency of the agricultural facilities of Pará.
As in the papers of Helfand and Levine (2004) and Helfand, et al. (2015), representative units were created for each size of facility and condition of the producer regarding land, in each city. These representative units were obtained by dividing the total value of a certain variable by the number of facilities, in a specific area and city group. Thus, a representative unit was created for each area group in each city. This procedure was necessary, given that the information obtained does not represent microdata from the agricultural census.
As seen in the preceding subsections, the first stage for obtaining the efficiency scores is estimating the stochastic frontier function. For this, the gross production value (gpv) was defined as the variable output. Regarding the production factors, they were defined by the following variables: area of the facility used in agriculture and livestock, which comprises the (permanent and temporary) crop and pasture areas, representing a proxy for the factor land; total amount of the assets of the agricultural facilities, as improvements, vehicles, land, machinery, implements, and tractors, representing a proxy for capital goods; the sum of the number of units of family and contracted labor, being a proxy for the factor labor; and nonproductive expense, referring to the sum of the expenditures with soil correctives, fertilizers, pesticides, animal medicines, seeds and seedlings, salt/feed, fuel and power, representing a proxy for the inputs. In addition, we added dummies for each city of the state of Pará and dummies representing the area groups taken into account, namely: less than 1 hectare (ha), 1 to less than 5 ha, 5 to less than 10 ha, 10 to less than 20ha, 20 to less than 50ha, 50 to less than 100 ha, 100 to less than 200 ha, 200 to less than 500 ha, 500 to less than 1000 ha, more than 1000 ha.
With respect to the analysis of the technical efficiency determinants, in addition to the variables representing the public policies analyzed, i.e., the amount of the funding (Funding), access to technical support from the government (Assistance), and income received from governmental social welfare programs (government income) used as proxies for Rural Credit, Pnater, and Bolsa Familia, respectively, other variables shall also be taken into account in an attempt to control the heterogeneities derived from specific characteristics of the producer or facility. Such variables are: retirement, irrigation, expertise, storage, education, and total area.
Results and Discussions
This section presents the descriptive statistics of the variables used and the result of the model developed in this research, the Stochastic Frontier Approach (SFA) function. The descriptive statistics of the 1,392 agricultural facilities representing Pará are presented in Table 1.
Table 1 Descriptive statistics of the variables used
| Variables | Average | Standard Deviation |
|---|---|---|
| Frontier | ||
| gpv (R$) | 21526.3 | 61145.04 |
| area (ha) | 82.3 | 271.8 |
| labor | 2.876914 | 2.881824 |
| inputs (R$) | 9925.53 | 106295.70 |
| capital (R$) | 415953.60 | 1322327 |
| Inefficiency | ||
| funding | 0.0830685 | 0.0872701 |
| assistance | 0.0782844 | 0.1177879 |
| government income (R$) | 56.91 | 219.35 |
| retirement (R$) | 250.52 | 472.03 |
| irrigation | 0.0426002 | 0.1109012 |
| expertise | 0.5168319 | 0.2143813 |
| storage | 0.0451727 | 0.1081708 |
| education | 0.8030269 | 0.1892358 |
| total area (ha) | 306.98 | 697.61 |
| Note: ha stands for hectare |
Source: Research results.
It shall be observed that, regarding the production value (gpv), the average value received by the producers of the state of Pará was R$21,526.3. Moreover, it is possible to note a great disparity through its standard deviation, which is higher than its average. The area used in (permanent and temporary) crops and pasture by these facilities was an average of 82.3 hectares. The average number of families and contracted workers was about 2.88 individuals.
By reviewing the expended resources in inputs and capital, it is possible to note that the average use of inputs (expenditures with power, fertilizers, pesticides, etc.) is way below its standard deviation, evidencing a great heterogeneity in the sample. This heterogeneity is also observed in the use of the resource in capital (expenditures with machines, equipment, tractors, etc.) which on average was R$415,953.60.
Regarding the variables that may cause technical inefficiency in the production of the agricultural facilities of the state of Pará, there is a low average of facilities that received financing (0.083), technical support from the government (0.078), which are variables that are used in this paper as proxies for the agricultural policies Rural Credit and Pnater. With respect to income arising from welfare policies, proxy for Bolsa Familia, the average was R$56.91.
Still based on Table 1, there is a low average use of irrigation systems (0.042) and storage (0.045) in the agricultural facilities of Pará, which evidences that there is little access to this technology and places to stock goods. With respect to agricultural expertise, a little more than half (0.517) of the managers have more than 10 years of experience, evidencing that these persons, due to this expertise, possibly manage to adapt themselves and provide alternatives to maintain the performance of the agricultural activity in desired levels, even in adverse situations.
Higher education levels are evidenced in the literature as responsible for reducing inefficiency (Battese & Coelli, 1995); in this paper, in order to try to capture this, the variable education, which indicates low education level, was used. A high average (0.80) can be observed in Table 1, indicating an extremely low education level among the agricultural managers in Pará. Finally, the average total area of the facility was 360.98 hectares.
The SFA for the agricultural facilities representing Pará was estimated with the Cobb-Douglas log-linear function through the Maximum Likelihood Estimation method. Therefore, given that the transformations of the variables into natural logarithms, each coefficient estimated refers to the elasticity of that production factor, which shall be interpreted on a percentage basis. Additionally, the return of the production function can be obtained from this type of function by simply adding the elasticities of the production factors. In Table 2 we note that the sum of the coefficients was 0.91, which indicates that the technology used is similar to constant returns to scale, implying that increased use of the production factors would lead to a proportional growth in the production value, similar to the result found by Helfand, et al. (2015) in their paper for rural Brazil.
Table 2 Results of Estimates of the Stochastic Frontier Approach and Technical Inefficiency
| Variables | Coefficients | Robust Standard Errors (bootstrap) | z | Prob>|z| |
|---|---|---|---|---|
| Frontier (ln GPV) | ||||
| ln area | 0.0195ns | 0.0215 | 0.91 | 0.365 |
| ln work | 0.0919* | 0.0317 | 2.90 | 0.004 |
| ln inputs | 0.0669* | 0.0211 | 3.17 | 0.002 |
| ln capital | 0.7242* | 0.0250 | 28.93 | 0.000 |
| constant | 1.3805* | 0.2860 | 4.83 | 0.000 |
| In inefficiency | ||||
| funding | -4.7300** | 2.2998 | -2.06 | 0.040 |
| assistance | -0.4577ns | 0.8550 | -0.54 | 0.592 |
| ln government income | -0.5866* | 0.1302 | -4.50 | 0.000 |
| ln retirement | -0.2213* | 0.0660 | -3.35 | 0.001 |
| irrigation | -3.3729ns | 2.1506 | -1.56 | 0.118 |
| expertise | -1.2717*** | 0.6587 | -1.93 | 0.054 |
| storage | -2.7374*** | 1.5221 | -1.80 | 0.072 |
| education | -1.6360** | 0.7315 | -2.24 | 0.025 |
| ln total area | 0.2679* | 0.0966 | 2.77 | 0.006 |
| constant | 1.4919* | 0.6011 | 2.48 | 0.010 |
| Observation number | 1.392 | |||
| Logarithm of likelihood | -1900.0979 | |||
| Wald test | 1,05+06 | ProbHchi2 | 0,00 | |
| Vsigma | -0.7522* | 0.1546 | -4.87 | 0.000 |
Note: Rounded numerical data; statistical significance: **5%; ***10%; ns not significant.
Source: Research results.
Thus, in the table indicated, the results of the estimated production function, as well as the determinants of inefficiency can be observed. It is important to highlight that, in order to ensure results that are more robust and solve the heteroscedasticity problem, we used the bootstrap procedure in the model to obtain the robust standard errors. Additionally, the result of the Wald test indicates a good adjustment of the model, rejecting the null hypothesis of joint insignificance of the variables.
Regarding the coefficients estimated, it is possible to note that area was the only factor not statistically significant in the formation of the VBP. The elasticity found for the variable labor shows a positive labor correlation, be it family and contracted labor, in the increased VBP of the facilities representing Pará, i.e., an increase in 10% of this factor would be associated with a 0.9% higher average output value.
As for the coefficients estimated for the input proxy, i.e., sum of the expenses incurred with seeds, fertilizers, pesticides, among others, a positive correlation, as expected, was observed between the expenditures with such inputs and the output generated. The results found evidence that an increase of 10% in this variable would increase the gross production value in about 0.7%.
For the factor capital, the results indicate that an increase of10% in the number of tractors, land, and improvements in the facilities, would increase the gross production value in an average of 7.24%, provided that the other elasticities are maintained constant. As a proxy for the factor capital, this positive behavior regarding the value generated by the production was expected. In addition, it is important to note that this was the factor that showed the greatest elasticity among the production factors in the model.
Table 2 also includes the results of determinants of technical inefficiency of the agricultural facilities representing Pará. Two key variables of the model are funding and assistance, which are used here as proxies for Rural Credit Policies and Pnater. It was noted that both showed expected negative signs, but only the former is statistically significant. Thus, we understand that the facility receiving any credit may contribute to a greater output, which evidences the importance of increasing the availability of credit for the farmers of Pará. Similar results were found by Rada and Buccola (2012), as they noted a positive effect of rural credit on the productivity of the Brazilian agricultural facilities. Thus, we believe that the possibility of the producer to having access to rural credit is essential for increased production and modernization as, as pointed out by Gasques, et al. (2012), the availability of credit allows access to better inputs, in addition to speeding up the adoption of more advanced technologies and allowing the expansion of the production scale through acquisition of more lands or new equipment.
Another important variable is government income, which is used to observe if receiving a resource from government social welfare programs, such as, for example, Bolsa Familia, could contribute to reducing inefficiency. With the results found, it is possible to note that this argument is proven, i.e., implementing an income with the government's help through conditional cash transfer programs, helps to improve the agricultural production in Pará, as pointed out by Ribeiro, et al. (2007), noting that this type of welfare policy generates benefits in the rural area by allowing more economic dynamism in the facility, since it increases production and reduces labor pain.
Regarding the income received from social security, the variable retirement showed a negative correlation with the technical inefficiency in the State of Pará, which indicates that receiving this type of income contributes to improve the region's agricultural production.
Expertise, the variable that indicates that the person responsible for the facility worked for more than 10 years in the agricultural activity, was statistically significant, with an expected negative sign. This result evidences that expertise allows the producer to use the inputs in a more efficient way. Other papers also found a significant and positive correlation between productive efficiency and expertise, as the one developed by Abdulai, et al. (2013).
The effect of the fact that the rural property is able to store its production on technical inefficiency was also noted in this paper, which presented a negative correlation, as can be observed in the variable storage (Table 2). Such result indicates that the manager may stock their production during the harvest season and keep it until it is offered for sale at the market's best prices, i.e., it allows to sell the production at the most appropriate time.
Regarding the variable education, since it represents a low education level, the positive impact on the productive inefficiency of the facilities was expected. However, as it is possible to note, its effect was negative, evidencing that increased low education level would decrease the inefficiency of the facilities taken into account. This result may be related to the low education level found in the managers of the facilities of the State of Pará, as observed in Table 1.
Finally, there is a positive effect of the variable total area on the technical inefficiency of agricultural facilities, which indicates an inverse correlation between the size of the facility and its efficiency, as foretold in most of the studies on productivity of the agricultural sector (Helfand & Levine, 2004; Helfand, et al., 2017; Moreira, et al., 2007). This result is corroborated with the results in Figure 4 and Table 3, which present the average technical efficiency scores of the facilities representing Pará based on the 10 total area classes taken into account in this research.
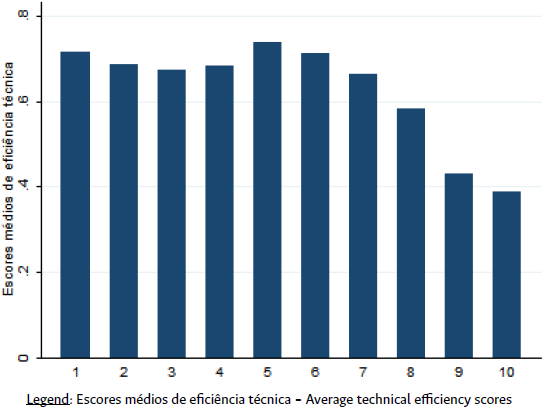
Source: prepared based on the research results.
Figure 4 Average technical efficiency scores, by area group, ofthe agricultural facilities of Pará in 2006
In Figure 4, we note that the most technically efficient facilities were those that have 20 to less than 50 land hectares, i.e., medium-sized agricultural producers. It can also be noted that the facilities with greater land strips (groups 9 and 10), are those that have the lowest technical efficiency averages, which could eliminate land reorganization as a way to increase productive performance in the state of Pará.
In Table 3, it is possible to check, in addition to the technical efficiency average between the 10 groups, their minimum and maximum values.
It is possible to note, based on the minimum values (Table 3), the presence of virtually ineffective facilities in all area groups, given the values near 0. In regard to the maximum efficiency values achieved, it can be noticed that the ones that obtained higher scores were the medium-sized facilities (groups 4, 6, 7), while bigger facilities (groups 9 and 10) were the ones that obtained the lowest maximum efficiency. This result is confirmed with previous results (Figure 4), which indicates that, in Pará, there is an inverse correlation between efficiency and land size, as indicated by some papers in the literature.
Table 3 Average technical efficiency scores, by area group, of the agricultural facilities representing Pará in 2006
| Area group | Average | Standard Error | Minimum | Maximum |
|---|---|---|---|---|
| [ess than 1 ha | 0.716 | 0.187 | 0.004 | 0.918 |
| from 1 ha to [ess than 5 ha | 0.685 | 0.216 | 0.001 | 0.912 |
| from 5 ha to [ess than 10 ha | 0.673 | 0.207 | 0.000 | 0.915 |
| from 10 ha to [ess than 20 ha | 0.683 | 0.217 | 0.000 | 0.947 |
| from 20 ha to [ess than 50 ha | 0.738 | 0.184 | 0.001 | 0.913 |
| from 50 ha to [ess than 100 ha | 0.712 | 0.210 | 0.000 | 0.967 |
| from 100 ha to [ess than 200 ha | 0.662 | 0.220 | 0.030 | 0.930 |
| from 200 ha to [ess than 500 ha | 0.581 | 0.228 | 0.000 | 0.910 |
| from 500 ha to [ess than 1000 ha | 0.431 | 0.232 | 0.000 | 0.873 |
| from 1000 ha | 0.388 | 0.241 | 0.000 | 0.891 |
| Observation number | 1392 | |||
Note: ha stands for hectare.
Source: Research results.
Final Considerations
In the Eastern Amazon region, more specifically in the state of Pará, one of the most dynamic sectors is the agricultural sector. This is mainly due to the public policies developed for the sector, with emphasis on Pnater and Rural Credit, in addition to conditional cash transfer programs such as Bolsa Familia. Due to this fact, the purpose of this paper was to determine the efficiency of the rural facilities of the State and observe the effect of public policies on the technical inefficiency of such facilities.
The results regarding technical efficiency indicated that the production factors that contribute to greater gross production value are inputs, labor, and capital, being the latter the most representative.
In regard to the explanatory variables that determined the productive inefficiency of the representative units, it was noted that the variables that contributed the most to increasing productive performance, i.e., reduce technical inefficiency, are related to funding, income received from the government, retirement, and expertise of more than 10 years in agricultural activities. In this regard, it is important to create public policies in order to increase the offer of such resources and services. Grater credit availability, for example, could contribute to a more efficient use of the resources available, which approaches the facility's production to the ideal production frontier.
Moreover, regarding the facility's size, an inverse correlation between the size of the agricultural units representing Pará and inefficiency was observed, which suggests that the greater land concentration can lead to worse use of production factors, which can also be related to the fact that there is a farmland grab problem. Hence, policies that may disseminate knowledge regarding the best use of these factors, as Pnater, are essential in the State. This result was confirmed by the results of the technical efficiency average, obtained by estimating the stochastic frontier approach function. Hence, such evidence also makes it possible to infer from land reorganization policies, as it raises questions if land redistribution by itself would be sufficient to reduce the inequalities in the rural environment.
In this sense, we believe that if Brazil implements mechanisms to control acquisition, land inspection and agrarian reform, together with public policies to stimulate agricultural credit and diversify agricultural production, not only can we reverse the inverse relationship between size and efficiency as well as recognition that the rural environment of the Amazons is essential for the social reproduction and quality of life of its people.
Despite the contribution that this article brings to the literature related to agricultural technical efficiency in the Eastern Amazon region, we known that due to the unavailability of more up-to-date data at the time of research, more up-to-date perspectives are not possible. Thus, we believe that analysis with more up-to-date data and that adding other variables to capture Brazilian agricultural policies will bring great advances to the subject.

