


 Inglés (pdf)
 Articulo en XML
 Referencias del artículo
 Enviar articulo por email
 Citado por SciELO
  Citado por Google
  Similares en
SciELO
Similares en
SciELO  Similares en Google
 Permalink
Introduction
Hearing loss can occur in people of all ages and has a dramatic impact on quality of life, including social and mental health. It is currently estimated that 1 in 8 people in the United States have hearing loss [1]. While most of these individuals can benefit from the use of hearing aids, those with severe to profound hearing loss are less likely to get benefit from these devices and hearing aids may not be able to provide enough amplification for the amount of hearing loss [2]. Patients with significant damage to the cochlea will not receive any audible signal from hearing aids, as the cochlea cannot pass along information to the auditory, due to the presence of damaged hair cells or a damaged cochlear nerve [2]. In clinical settings and when counseling patients, this is often conveyed through the metaphor of a broken loudspeaker: while the signal is audible and loud enough, the distortion from the damage makes the sound harder to interpret. The first cochlear implant was developed in the 1970’s to help those who could not benefit from a hearing aid [3].
What is a Cochlear Implant?
Cochlear implants are surgically implanted devices that can help this subset of patients who still struggle with hearing aids [3]. A cochlear implant is comprised of two main pieces: an external device and an implanted device. The external device houses the microphone, speech processor, and the transmitter; while the implanted device contains the receiver or stimulator, and an electrode array [3]. The existing CI devices [3,5-7] provide a variety of speech processing options.
There are currently three main manufacturers of cochlear implants in the US: Advanced Bionics, Cochlear, and MED-EL. A forthcoming device developed by Oticon Medical has pre-market approval from the United States Food and Drug Administration (FDA) [4]. Across the CI companies, electrode arrays vary [3]. Current commercially available CIs have up to 22 channels [5]. A multichannel implant takes advantage of the tonotopic organization of the cochlea and can provide a more accurate sound scape of the environment [3]. The current electrode arrays vary based on shape and stiffness [3,5-10].
Cochlear Implant Evaluation and Candidacy
A typical CI evaluation may consist of multiple questionnaires, a full audiogram including tympanograms and acoustic reflexes, and speech testing with amplification such as AZ-bio sentences in quiet and noise, Consonant-Nucleus-Consonant (CNC) words, and/or closed set tests when appropriate [11]. In general, audiometric results and speech results with ideally fit hearing aids are the two most crucial aspects of CI evaluation [11]. After the audiologist has determined eligibility for a CI, the patient must then see an otolaryngologist to determine if their anatomy is appropriate for the implant. This includes evaluating the levels of ossification, the development of the cochlea and any other surgical contraindications [3].
Surgery and Post-Implantation Measurements
After a patient has been evaluated and approved for the CI, they will get the device implanted. An otolaryngologist inserts the device into the cochlea. This surgical process can destroy all residual hearing, but, with improvements in electrode design and surgical approaches, residual hearing may be retained in the future [12,13]. About 2-4 weeks after the surgery, the device is activated and begins electrically stimulating the auditory nerve [11]. The device bypasses most damage to the cochlea and its hair cells by providing direct current to the ganglion cells and the auditory nerve.
Currently, speech recognition is the standard outcome measure to determine the patient’s success of the cochlear implant. For adults, outcomes can vary widely. With current surgical techniques, most patients achieve functional hearing with the use of the cochlear implant [12,13]. Some patients may demonstrate substantial speech understanding as early as 3 months after implantation, while others may never gain more than an awareness of environmental sounds. Schafer et al. [14] found approximately a 40% increase in speech recognition post implantation for adults. However, this speech recognition rate tends to decline the later in life the device is originally implanted. This was supported by Forli et al. [15], which found a 39% increase with background noise in a group implanted between age 60-69 years. Bourn et al. [16] examined outcomes in elderly populations of adults 80 years and older and compared them to outcomes in those 65-79 years old and demonstrated statistically significant improvement for the AZ-Bio speech recognition test in quiet for both groups.
Quality of Life
Hearing loss can have effects on social, emotional, and professional aspects of life. The loss of hearing and then the subsequent implantation with a CI can also cause major upheaval in these aspects. Therefore, evaluating a patient’s quality of life can be an important measure in determining success with a CI. While speech recognition tests provide information on the functionality and improvement in speech understanding that a cochlear implant provides in the sound booth, these tests provide little information regarding the patient’s quality of life outside of the office [17]. Intake healthy history questions and counseling are tools used by audiologists to overcome this lack of information. However, validated tests measuring quality of life would provide quantifiable data to support a patient’s experiences and direct their plan of care.
Typical quality of life assessments used for cochlear implant recipients and or hearing aid recipients evaluate social life, mental health, and relationships, which can all be negatively affected by hearing loss. McRackan et al. [18] found a significant improvement in quality-of-life scores when comparing participants’ responses after CI implantation compared to before their implantation. However, there was no correlation between quality-of-life scores and speech understanding scores. While speech recognition is important for functionality of their device, the quality of life of the patient post-implant should be the main goal of the aural habilitation and rehabilitation in clinical settings. Prior research has demonstrated differing results regarding the correlation of speech understanding and to quality-of-life scores [19,20]. In summary, although receiving a cochlear implant can be helpful for speech understanding, the patient’s re-engagement in their relationships and social life has more of an impact on quality of life.
Voice Quality
Being profoundly deaf tends to have an effect on phonation and voice quality due to diminished auditory feedback [21]. Auditory feedback is an important aspect of speech, development and adapts voice production in varying environments [22] and involves monitoring vocal fundamental frequency (Fo), intensity, and quality [23]. One example of this system is the Lombard effect: raising your voice to overcome environmental noise. Another example is side-tone amplification, a phenomenon in which an individual either raises or lowers the intensity of their voice after receiving auditory feedback of their voice [22,24]. The auditory feedback system gets interrupted when an individual has hearing loss. As the length of auditory deprivation and associated lack of auditory feedback increases, voice quality decreases in patients with severe-to-profound hearing loss [21].
When evaluating voice quality in patients who may have voice disorders or abnormalities, acoustic analysis provides parameters to quantify aspects of the voice. Typical parameters include Fo, periodicity measurements such as jitter and shimmer, amplitude measurements, and duration measurements [25,26]. Jitter is the short-term variations in the Fo between contiguous glottal cycles and shimmer is the short-term variations in the amplitude of the sound waves [27]. The interruption of the auditory feedback system usually results in speech patterns with abnormal Fo, and increased jitter and shimmer [23]. These indicate a lack of control over laryngeal function and of stability in the phonation system [26].
Voice quality is affected again after cochlear implantation when the patient is regaining the auditory feedback system. However, Ruff et al. [28] found that increased auditory feedback after implantation is not always sufficient for good speech production quality in patients that were pre-lingually deafened. If the patient received the implant soon after the onset of deafness, there was a significant increase in the likelihood that they would maintain a desirable voice quality [28]. Zamini et al. [23] looked at voice quality with the CI turned on versus off. The results indicated that there was a significant change between conditions with Fo, shimmer, harmonics to noise ratios, and hyper nasality values. In conclusion, short term auditory deprivation can degrade speech and voice quality in CI users, but as soon as the CI was turned back on, the patient’s voice returned to “normal sounding.” An et al. [29] found that excessive shimmer in pre-operation voices had a negative influence over post-operation speech intelligibility. Profound hearing loss is associated with increased voice intensity level and greater fluctuations in intensity [29]. After implantation, control of voice and speech were improved, as demonstrated through decreases in amplitude variability, decreases in jitter, and decrease in shimmer [29]. In contrast, a systematic review [25] revealed that only Fo shows a consistent significant improvement with CI use, while periodicity (jitter and shimmer), amplitude, and duration measurements had no significant differences with CI use. There is some evidence that suggests that CIs had a positive impact on vowel production, but this was only observed in three of the studies [25].
Another factor to consider is how unilateral CI compares to bilateral CIs and their effect on voice performance. Aronoff et al. [30], found that due to varying insertion depths of the electrode arrays, auditory perception can be very different between the two implants for bilateral users. Contrary to many other studies comparing unilateral implants versus bilateral implants, voice control seems singular in that two implants leads to worse outcomes. This was observed in Aronoff et al. [30], where singing abilities were degraded when using two implants compared to just one, and in Kirchner et al. [31], where bilateral CIs yielded worse vocal control or Fo variability than one CI alone.
Voice Related Quality of Life
In addition to acoustic parameters, quality of life self-assessments can help monitor and diagnose voice disorders. Two of the self-assessments that have been developed for this purpose are the Voice Handicap Index-10 (VHI-10) and the Voice-Related Quality of Life (V-RQOL) [32-34]. The VHI-10 has been validated across several languages and has been found to be both reliable and valid in identifying voice-related disorders with a score of 11 and above, indicating a voice disorder [32]. The V-RQOL was developed in 1999 to provide an evidence-based questionnaire to identify voice-related disorders and patient’s quality of life [34]. In the 10 questions answered by patients on the V-RQOL, four are contributed to the social-emotional domain and inquire about the severity of anxiety or frustration related to their voice, depression related to their voice, avoidance of social events, and decrease in outgoing nature due to their voice. The other six questions of the V-RQOL are assigned to the physical-functional domain. These questions include trouble speaking loudly or being heard in noisy situations, running out of air, and needing to take frequent breaths when talking, not always knowing what will “come out” when they begin speaking, having trouble using the phone because of their voice, having trouble doing their job because of their voice, and having to repeat themselves to be understood [34]. The mean score for normal speakers on the V-RQOL is 94.8 to 98 out of 100 compared to voice patients who received a mean score of 53.2 out of 100 [34,35].
Purpose of Study
So far, there has been little research regarding how voice quality of CI users affects their quality of life [e.g., 36]. The aim of this study is to identify if CI users are perceiving a decrease in life quality due to voice problems. These results will be compared to data from other populations surrounding voice-related quality of life.
Cochlear implants have a known effect on voice quality for CI users. The present study considers how the two factors, 1) cochlear implantation and 2) voice quality, intercorrelate to affect the quality of life in these individuals. The age of when the individuals were diagnosed with hearing loss and age of when the individual was implanted were hypothesized to have an effect on how the participant will score on each of the questionnaires. For the VHI-10 and V-RQOL, individuals that were prelingually deafened and received early intervention and individuals that were post lingually deafened and implanted were predicted to have scores indicating no voice disorder. This contrasts with individuals that may have been prelingually deafened and were not implanted until later in life who were predicted to have scores indicating a voice disorder. The individuals that did not have any auditory information during the critical period for language development were predicted to have scores that indicate a voice disorder. These predictions were based off the studies that evaluated the acoustic parameters of CI user’s voice before and after implantation.
Methods
The effect voice quality on quality of life in CI users was evaluated using a survey. Forty-three participants responded to the survey. Demographic information of these respondents is provided in the results section. All participants were CI users, either unilateral or bilateral who had at least one year of experience listening with their CI device. The participants were recruited online through the Hearpeers Forum, Hearing Tracker, social media websites, including Facebook and Instagram, and through flyers in clinics. Once identified, participants received a web link to the survey. Participants were informed of the aims of the study and the voluntary and confidential nature of participation. Those who were still interested signed a consent form before continuing with the surbvey. The University of Illinois at Urbana-Champaign Institutional Review Board (IRB # 22314) reviewed and approved the research study as described.
To evaluate the effect on quality of life, the survey included questions about demographics, the user’s CI, and the following standardized questionnaires: the Hearing Health Quick Test (HHQT), the Voice Handicap Index-10 (VHI-10), and the Voice related quality of life scale (V-RQOL). The survey is available in Appendix A.
The questions about demographics and the user’s CI elicited the participant’s age, gender, and information about hearing health history and hearing aids. The CI-related questions included items such as age at time of implantation, date of implantation, whether one or both ears have implants and which ear, if unilateral, and the brand of CI. If they have a unilateral CI, they were also asked if they wore a hearing aid on the opposite ear and how long they have worn the hearing aid.
The second part of the survey included the HHQT, the VHI-10, and the V-RQOL. The HHQT includes 15 questions about the user’s quality of life in relation to their hearing. It targets the effects of hearing loss on quality of life with scores of three and above indicating negative impact and a recommendation to visit an audiologist. The VHI-10 targets the effect of voice quality on the participant’s sense of impairment, and the emotional and physical aspects that affect their quality of life through 10 questions. Scoring of the VHI-10 is a total score, evaluating level of general voice pathology, max of 40, with an 11 or higher indicating a voice problem. The V-RQOL has 10 questions that target both physical-functional and the social-emotional aspects relating to voice quality and quality of life. The final score is out of 100 with a score of 80 or below falling outside of normal limits.
Analysis
The participants’ responses were analyzed using linear regression to reveal any associations between the VHI-10, and the VRQOL with self-reported socio-demographic characteristics, health-related conditions, and the HHQT. If the independent variable had a p-value that was higher than 0.20 in the univariate analysis, it was included in the multivariate analyses and was retained if the p-value reached the conventional level of significance of 0.05. The magnitude of the associations was expressed as the odds ratio and the statistical significance as the 95% confidence interval.
Results
Participant Characteristics
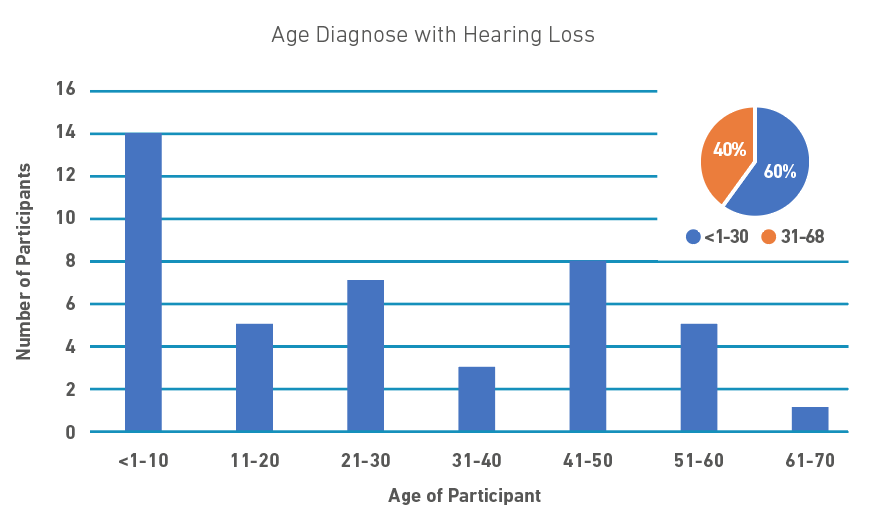
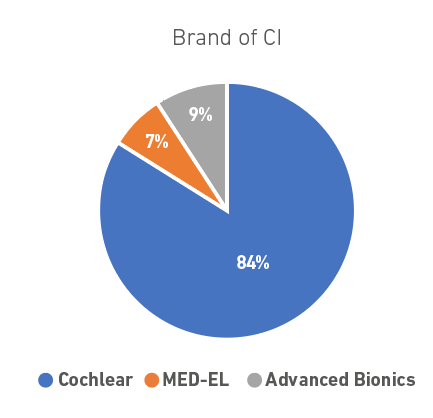
Most of the participants were white (95%), over the age of 50 (72%), and female (93%), as shown in Table 1. The majority of the participants also had some college education: associate degree (7%), bachelor’s degree (40%) or postgraduate degree (42%). Most participants reported having gradual hearing loss (74%) and were diagnosed with hearing loss when younger than 30 years old (60%), as seen in Figure 1. The mean age of hearing loss diagnosis was 27 years; thus, many participants can be considered to be post-lingually deaf. In relation to which cochlear implant brand they used, most participants had Cochlear (84%), with only 9% wearing Advanced Bionics and 7% wearing MED-EL implants, as demonstrated in Figure 2. Regarding mode of implantation, 53% had bilateral implants, 30% were bimodal users and one participant had a hybrid implant.
Table 1 Characteristics of Participants
| Variable | n | % |
|---|---|---|
| Socio-demographics | ||
| >50 years old | 31 | 72 |
| Female | 40 | 93 |
| White | 41 | 95 |
| Postgraduate studies | 18 | 42 |
| Bachelor degree | 17 | 40 |
| Lower degree | 3 | 7 |
| High school or no degree | 5 | 12 |
| Cochlear implant information | ||
| Cochlear | 36 | 84 |
| MED-EL | 3 | 7 |
| Advanced bionics | 4 | 9 |
| Ear implanted | ||
| Right | 9 | 21 |
| Left | 11 | 26 |
| Both | 23 | 53 |
| Bimodal | 13 | 30 |
| Hybrid | 1 | 2 |
| Hearing aid users | 14 | 13 |
| Onset of hearing loss | ||
| Sudden | 11 | 26 |
| Gradual | 31 | 74 |
| <30 years of age | 26 | 60 |
| Communication | ||
| Spoken Language | 42 | 98 |
V-RQOL and VHI-10 Scores
The V-RQOL has a total score, a social-emotional domain, and a physical-functional domain. As shown in Figure 3, for the total score, only one participant had an abnormal score and 42 had scores within normal limits with a mean score of 93.6. In the social domain, four participants scored abnormally and 39 were within normal limits with a mean score of 95.3 and in the physical domain five participants scored abnormally with 38 within normal limits with a mean score of 92.4. Overall, most responses were consistent with no problem with their voice. However, both Question One “I have trouble speaking loudly or being heard in noisy situations” and Question Nine, “I have to repeat myself to be understood,” had 10 or more responses, indicating a small amount to a lot when rating the amount of the problem. No participants indicated that their voice problem was as “bad as it can be.”
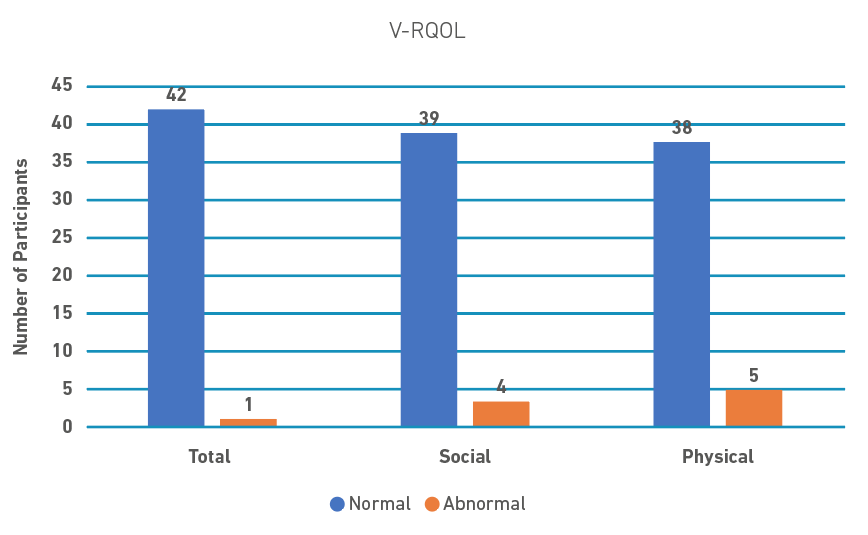
Figure 3 Participants that scored in the Normal or Abnormal ranges for the V-RQOL and the domains of V-RQOL (Social and Physical)
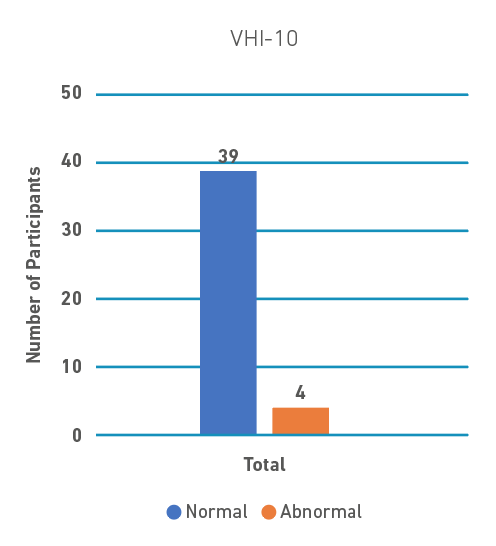
The VHI-10 was similar in that only four participants received an abnormal score (see Figure 4 below). For the VHI-10, there were more varied answers across the scale. While the majority of responses were the lowest item on the scale, zero (Never), most questions had at least seven responses of one (Almost Never) or above. Question Two, “People have difficulty understanding me in a crowded room,” had eight responses of one (Almost Never) and nine responses of two (Sometimes) and question one, “My voice makes it difficult for people to hear me” had seven responses for both one (Almost Never) and two (Sometimes). Question Five, “My voice causes me to lose income,” was the only question to receive a response of five (Always) and it only had two responses above zero (Never).
Factors associated with scores on V-RQOL and VHI-10
Table 2 shows the factors that were found to be associated with the V-RQOL via a univariate linear regression analysis. For the social domain, significantly lower scores were associated with an associate degree (β =-0.26), and a yes response for HHQT six (Do you find men's voices easier to understand than women's?) (β =-0.04), question eleven (Does a hearing problem cause you to visit friends, relatives, or neighbors less often than you would like?) (β =-0.06), and question fourteen (Have you had any significant noise exposure during work, recreation, or military service?) (β =-0.09). In addition, responses to HHQT two (Do you sometimes feel that people are mumbling or not speaking clearly?) (β=-0.03), four (Do you sometimes find it difficult to understand a speaker at a public meeting or a religious service?) (β=-0.04), eight (Do you have difficulty understanding speech on the telephone?) (β=-0.03), nine (Does a hearing problem cause you to feel embarrassed when meeting new people?) (β=-0.03), and question thirteen (Do you hear better with one ear than the other?) (β=-0.03) had no detectable relationships within the social domain.
Table 2 Factors that were found to be associated with the V-RQOL via a univariate linear regression analysis.
| Variable | Social | Physical | Total | |||
|---|---|---|---|---|---|---|
| Beta | Standard Error | Beta | Standard Error | Beta | Standard Error | |
| Demographics | ||||||
| Gender: Male | -0.07 | 0.06 | 0.07 | 0.06 | 0.02 | 0.06 |
| Race | ||||||
| White | -0.05 | 0.10 | 0.22+ | 0.12 | 0.10 | 0.11 |
| Other | <.01 | 0.14 | 0.11 | 0.16 | 0.06 | 0.15 |
| Education | ||||||
| Associate’s | -0.26* | -3.27 | -0.15+ | -1.90 | -0.19* | 0.05 |
| Bachelor’s | -0.06 | -1.18 | -0.05 | -0.87 | -0.05 | 0.05 |
| Postgraduate | -0.02 | -0.35 | -0.04 | -0.78 | -0.03 | 0.05 |
| Onset of HL | ||||||
| Sudden | 0.02 | 0.04 | <0.01 | 0.04 | 0.01 | 0.04 |
| Age diagnosed with HL | <0.01 | <0.01 | 0.002* | <0.01 | <0.01+ | <0.01 |
| Age implanted with CI | <0.01 | <0.01 | 0.003* | <0.01 | <0.01 | <0.01 |
| Time between HL and CI | <0.01 | <0.01 | <0.01 | <0.01 | <0.01 | <0.01 |
| Status of non-implant ear | -0.08 | 0.10 | -0.08 | 0.10 | -0.08 | 0.10 |
| HHQT | ||||||
| 1. Do you find it difficult to follow a conversation in a noisy restaurant or crowded room? | -0.03 | 0.02 | 0.03 | 0.02 | 0.01 | 0.02 |
| 2. Do you sometimes feel that people are mumbling or not speaking clearly? | -0.03+ | 0.02 | <0.01 | 0.02 | -0.01 | 0.02 |
| 3. Do you experience difficulty following dialog in the theater? | -0.01 | 0.02 | 0.04+ | 0.02 | 0.02 | 0.02 |
| 4. Do you sometimes find it difficult to understand a speaker at a public meeting or a religious service? | -0.04+ | 0.02 | 0.01 | 0.02 | -0.01 | 0.02 |
| 5. Do you find yourself asking people to speak up or repeat themselves? | -0.01 | 0.02 | <0.01 | 0.02 | -0.01 | 0.02 |
| 6. Do you find men's voices easier to understand than women's? | -0.04* | 0.02 | -0.01 | 0.02 | -0.02 | 0.02 |
| 7. Do you experience difficulty understanding soft or whispered speech? | 0.01 | 0.03 | 0.03 | 0.03 | 0.02 | 0.03 |
| 8. Do you have difficulty understanding speech on the telephone? | -0.03+ | 0.02 | -0.01 | 0.02 | -0.02 | 0.02 |
| 9. Does a hearing problem cause you to feel embarrassed when meeting new people? | -0.03+ | 0.02 | -0.01 | 0.02 | -0.02 | 0.02 |
| 10. Do you feel handicapped by a hearing problem? | -0.01 | 0.02 | 0.01 | 0.02 | <0.01 | 0.02 |
| 11. Does a hearing problem cause you to visit friends, relatives or neighbors less often than you would like? | -0.06* | 0.02 | -0.03+ | 0.02 | -0.04* | 0.02 |
| 12. Do you experience ringing or noises in your ears? | 0.01 | 0.02 | <0.01 | 0.02 | <0.01 | 0.02 |
| 13. Do you hear better with one ear than the other? | -0.03+ | 0.02 | 0.01 | 0.02 | <0.01 | 0.02 |
| 14. Have you had any significant noise exposure during work, recreation, or military service? | -0.09* | 0.03 | -0.03 | 0.03 | -0.05* | 0.03 |
| 15. Have any of your relatives (by birth) had a hearing loss? | 0.01 | 0.02 | 0.03+ | 0.02 | 0.02+ | 0.02 |
Note. * p < 0.05; + p < 0.20.
For the physical domain, scores were significantly associated with age diagnosed with hearing loss (β=0.002), and age when implanted (β=0.003) and there were no detectable relationships with race (white) (β =0.22), having an associate degree (β = -0.15). There were no detectable relationships between the physical domain and HHQT three (Do you experience difficulty following dialog in the theater?) (β = 0.04), question eleven (β = -0.03), and question fifteen (Have any of your relatives (by birth) had a hearing loss?) (β = 0.03). Total V-RQOL scores were significantly associated with an associate degree (β =-0.19), HHQT eleven (β =-0.04) and 14 (β=-0.05). Factors with no detectable relationships with the total V-RQOL scores were Age diagnosed with hearing loss (β <0.01), and HHQT fifteen (β = 0.02).
Table 3 shows the factors that were found to be associated with the VHI-10 via a univariate linear regression analysis. Lower scores were significantly associated with gender (male) (β =-0.73), education levels of associate and bachelor’s degrees (β =1.93, β =0.96), and responses to HHQT three (β =-0.38), six (β =0.57), eight (β =-0.39), nine (β =-0.39), eleven (β =0.48), twelve (Do you experience ringing or noises in your ears?) (β =-0.30), 13 (β=0.38), and 14 (β =-0.08). Response to HHQT four (β = 0.20) was the only factor with no detectable relationships with the score on the VHI-10.
Table 3 Factors that were found to be associated with the VHI-10 via a univariate linear regression analysis.
| Variable | Beta | Standard Error |
|---|---|---|
| Demographics | ||
| Gender: Male | 0.73* | 0.25 |
| Race | ||
| White | 1.18 | 1.00 |
| Other | -14.30 | 773.78 |
| Education | ||
| Associate’s | 1.93* | 4.59 |
| Bachelor’s | 0.96* | 2.40 |
| Postgraduate | 0.36 | 0.86 |
| Onset of HL | ||
| Sudden | -0.15 | 0.21 |
| Age diagnosed with HL | -0.01 | 0.01 |
| Age implanted with CI | -0.01 | 0.01 |
| Time between HL and CI | <0.01 | <0.01 |
| Status of non-implant ear | 16.56 | 1275.75 |
| HHQT | ||
| 1. Do you find it difficult to follow a conversation in a noisy restaurant or crowded room? | 0.06 | 0.12 |
| 2. Do you sometimes feel that people are mumbling or not speaking clearly? | 0.03 | 0.10 |
| 3. Do you experience difficulty following dialog in the theater? | -0.38* | 0.11 |
| 4. Do you sometimes find it difficult to understand a speaker at a public meeting or a religious service? | 0.20+ | 0.12 |
| 5. Do you find yourself asking people to speak up or repeat themselves? | -0.02 | 0.12 |
| 6. Do you find men's voices easier to understand than women's? | 0.57 * | 0.10 |
| 7. Do you experience difficulty understanding soft or whispered speech? | 0.06 | 0.14 |
| 8. Do you have difficulty understanding speech on the telephone? | 0.39 * | 0.11 |
| 9. Does a hearing problem cause you to feel embarrassed when meeting new people? | 0.39 * | 0.11 |
| 10. Do you feel handicapped by a hearing problem? | -0.12 | 0.11 |
| 11. Does a hearing problem cause you to visit friends, relatives or neighbors less often than you would like? | 0.48* | 0.10 |
| 12. Do you experience ringing or noises in your ears? | -0.30 * | 0.10 |
| 13. Do you hear better with one ear than the other? | 0.38 * | 0.12 |
| 14. Have you had any significant noise exposure during work, recreation, or military service? | 0.59 * | 0.09 |
| 15. Have any of your relatives (by birth) had a hearing loss? | -0.08 | 0.10 |
Note. * p < 0.05; + p < 0.20.
Discussion
While the acoustic output of voice in cochlear implant users has recently been the subject of a few studies [25,28,31], there is a lack of literature on how CI users perceive their own voice quality and if this is impacting their quality of life. This study investigated the perceived voice quality and related quality of life in cochlear implant users, using the V-RQOL and VHI-10 questionnaires.
A small amount of participants scored in the abnormal range in either of these measures. Five (12%) scored abnormally in the physical domain of the V-RQOL, four (9%) in the social domain, one on the total score, and four (9%) scored abnormally on the VHI-10. Compared to other populations, CI users who responded to the survey scored in a similar pattern [37,38]. Studies examining teachers’ performance demonstrated that they average about 73.3 to 76.71 on the V-RQOL [39,40], which is lower than the average of CI users received (93.6 on the total). About 10% to 28.8% of teachers score in the abnormal range on the VHI-10 [41,42]. With only 9% of CI users in the present study scoring abnormally on the VHI-10, voice seems to be less of a perceived problem in CI user population likely due to varying duration and use of voice throughout the day.
When assessing associations with demographics and the HHQT, scores on both of these voice-related questionnaires were identified as having a correlation with education level and hearing loss related avoidance of friends, family, and neighbors.
V-RQOL
The V-RQOL was developed to assess how voice quality affects a dysphonic patient’s quality of life [34]. Scores can be separated from the total into the social-emotional domain and the physical-functional domain. In the present study, results from the total score and the sub-domains were correlated with the participants having an associate degree and with participants visiting friends, family, and neighbors less often due to hearing loss.
Scores on the social domain were found to be significantly related to the highest level of education being an associate degree, difficulty with understanding women’s voices, and avoidance of visiting with friends, family, or neighbors due to hearing loss. In addition, responses to HHQT questions indicated difficulty with social situations due to their hearing loss. These social factors are important predictors of quality of life, and this has been previously elucidated in a prior study that looked at the co-prevalence of dysphonia and hearing loss in the elderly. They found that these conditions together often lead to increased levels of isolation and depression as their ability to communicate as sender and receiver was significantly impacted [43]. The social-emotional scores were also significantly associated with noise exposure. Studies looking at teachers, who must raise their voice over noise to teach throughout the day, have found that teachers have a lower quality of life due to voice complaints [39]. Thus, the present results provide evidence that CI users are experiencing a similar relationship between the Lombard effect and quality of life.
Five participants scored outside of normal limits for the physical-functional domain. Abnormal scores in this domain were correlated with age when diagnosed with hearing loss, and age when implanted with CIs. Participants who scored abnormally were diagnosed with hearing loss in their late teens to late twenties and were not implanted until 18 years after their hearing loss diagnosis. It is likely that these participants underwent a period of auditory deprivation and the loss of auditory feedback led to decreased vocal control of fundamental frequency and intensity, which is consistent with previous studies [31,44]. Auditory deprivation and its association with decreased vocal control is directly related to the leading speech production models, such as the Directions Into Velocities of Articulators (DIVA) [45]. DIVA emphasizes the importance of auditory feedback control for the motor act of speech through auditory feedback and feedforward loops. For familial history of hearing loss, it is likely that having to raise their voice consistently to be heard and understood and overcome their family members’ hearing loss causes a strain on the voice resulting in a lower score on the physical sub-domain of the V-RQOL. This is a specifically notable factor, as in older age, adults to rely increasingly on their family connections [46], and if this relationship deteriorates due to hearing-related factors, quality of life would ostensibly be impacted.
On the total score of the V-RQOL, only one participant scored below the cut off for dysphonia. Lower scores were significantly associated with an associate degree, avoidance of visiting with friends, family or neighbors, and noise exposure. Factors that had no detectable relationships with the total score on V-RQOL were age diagnosed with hearing loss, and familial history of hearing loss. As stated before, being around noise or other people with hearing loss causes the individual to raise their voice and can cause a strain on the voice. And with the age of diagnosis, there is a longer period of time with the interrupted feedback loop which can cause the increased intensity of voice [21,23].
VHI-10
The VHI was developed to measure the psychosocial aspects of voice handicaps and disorders [33]. Abnormal scores on the VHI-10 were significantly associated with gender (male), education levels (associate and bachelor’s degrees), difficulty following dialog in theater, difficulty with understanding women’s voices, difficulty understanding speech on the telephone, feelings of embarrassment when meeting new people due to hearing loss, avoidance of friends, family, and neighbors due to hearing loss, experiences of tinnitus, hearing better with one ear, and significant noise exposure. Many of these are similar to correlations found for the V-RQOL. Consistently, difficulty hearing in noise and embarrassment over their hearing loss have been predictors of lower scores on these measures. It is possible that this population is trying to compensate for their hearing loss by talking louder and thus straining their voice. This association with difficulty hearing in noise was seen in teachers as well [39]. Seeing a correlation between males and lower scores is in contrast with most literature on voice problems that show a higher incidence in females [39-41]. However, this is likely due to the small number of males (n=3) who participated in this study.
Conclusions, Limitations, and Future Research
This study examined the voice-related quality of life in CI users. The main findings demonstrate that CI users do not perceive much voice-related difficulty. However, they are more likely to if they experience difficulty hearing in noise and avoid social situations due to hearing loss.
There is more that could be investigated regarding hearing loss and voice quality of life, such as voice-related quality of life in family members of Deaf people and in hearing aid users. In the present study, the small number of participants (n=43) was the primary limitation. Future research could investigate how other individuals with hearing loss perceive their voice and related quality of life. This is something that has been reported by patients in clinics, but does not seem to be as well established in the research and would reach a broader set of possible participants as the CI users are a small subset of individuals with hearing loss. Similarly, it would be interesting to establish how the family members of those with hearing loss perceive their own voices. In the present study, there was a correlation between having family with hearing loss and the physical sub-domain and the total score on the V-RQOL. It is likely that having a family member with hearing loss, who communicates primarily through spoken language, can be a risk factor for voice problems as an individual would need to speak louder to overcome their family member’s hearing loss. A final limitation is that there are distinct differences in the ages and onset of hearing loss within the participants. For example, there is difference in the rehabilitation of individuals who experience pre-lingual hearing loss compared to those with post-lingual hearing loss. Future research would benefit from examining voice-related quality of life within each of these distinct groups.

