


 English (pdf)
 Article in xml format
 Article references
 Send this article by e-mail
 Cited by SciELO
  Cited by Google
  Similars in
SciELO
Similars in
SciELO  Similars in Google
 Permalink
Introduction
There is a higher prevalence of voice disorders among teachers than in the general population [1,2], which may indicate a potential collective illness related to occupational conditions [3]. These so-called Work-Related Voice Disorders (WRVD) are the main cause of absenteeism and functional reassignments among teachers, resulting in significant financial and social costs [4]. The intensive use of voice in inappropriate classrooms, with noise and/or unsatisfactory acoustics, is considered a risk factor for WRVD [3,5-8], as it increases self-reported vocal fatigue [8] and is collectively regarded as a situation of high vocal demand [9]. These conditions can trigger potentially harmful responses, such as increased phonation time, fundamental frequency (f0), and vocal intensity [9].
It should be noted that this study adopts the term “vocal load” to refer to both “vocal demand” and “response to vocal demand” [9]. In this sense, “vocal demand” refers to the speaking context independent of the speaker, including the description of the communicative setting, and architectural and acoustic information of the room, while “response to vocal demand” refers to how the voice is produced in this context [9]. Although the literature indicates that high vocal doses correlate with the presence of dysphonia, increased noise levels in the environment, and self-perceived vocal fatigue [10], safe limits to prevent vocal disorders are still under investigation.
Furthermore, significant associations were found between objective and perceptual acoustic and architectural measures (room noise, perception of poor room acoustics, and perception of higher volumes in the room) as well as with self-perception of vocal fatigue [8]. It has also been reported that vocal fatigue affects the quality of life of university professors [11]. Despite the accumulated knowledge on the topic of work and its relationship with vocal health between teachers [12], there are limited studies specifically focusing on university professors [13], although these professionals regard their voice as an essential pedagogical resource [14].
The first with a systematic review with a meta-analysis, aimed at estimating the prevalence of voice disorders and associated factors among university professors was recently published [15]. This review included 18 articles, in both English and Persian languages. It is the meta-analysis, which includes 17 studies involving a total of 4,037 teachers, revealed an overall prevalence of voice disorders of 41%, significantly higher than that observed in the general population (ranging from 3 to 9%). Among the countries analyzed, the highest prevalence was found in Iran (69%) and the lowest in China (20%) [15]. There was also a higher prevalence of voice disorders among female teachers and the most frequently reported vocal symptom was dry throat (affecting 46% of the participants) [15].
A Brazilian study involving 846 university professors found a high prevalence of hoarseness (39.6%). This prevalence was notably higher among female professors, with teaching experience ranging from 10 to 20 years, those teaching more than four hours, and those who perceived their work environment as noisy and competitive in terms of noise, among other individual factors [16].
Another survey conducted among university professors in Brazil found a significant number of vocal symptoms within this population. Factors associated with a greater number of vocal symptoms included female gender (p<0.001; CI = 1.60-6.16), perception of unsatisfactory noise levels in the work environment (p= 0.029; CI = 1.08 -4.68 ), fast speech rate (p= 0.017; CI = 1.13-3.81), use of a high fundamental frequency (p= 0.006; CI = 1.58-15.5), and high vocal intensity (p= 0.003; CI = 1.48-6.78), with dry throat being the most commonly reported symptom [16]. Notably, the perception of unsatisfactory noise levels in the work environment (73.3%) increased the likelihood of reporting vocal symptoms almost three times (OR = 2.89) [17].
A study conducted in Cyprus showed that individual factors, voice use, and environmental conditions can contribute to the development of voice disorders among university teachers. The results indicate that teachers with higher rates of voice disorders were more likely to experience issues related to vocal health (such as respiratory infections, coughing, and throat clearing) and to teach in environments characterized as very or moderately noisy [18].
In another research involving university professors, significant associations were observed, including female gender and vocal fatigue (p= 0.024), female gender and loss of voice (p=0.040), voice disorder and self-reported weak voice (p=0.001), voice disorder and hoarseness (p=0.009), voice disorder and an unsuitable voice for work (p=0.002), and voice disorder and vocal fatigue (p=0.007) [14].
Vocal monitoring technology that enables the collection of objective vocal data in daily life is relatively recent [19-21]. Much of the research in this area has been conducted in laboratory settings, involving prolonged readings at different intensities [20]. However, there remains a lack of clarity regarding whether the data obtained under these controlled conditions accurately represents or applies to the daily lives of participants [20]. In this context, there is a scarcity of research on vocal monitoring under real-life conditions of use in the classroom environment among university professors. Furthermore, recent literature underscores the value of employing standardized measures of vocal fatigue and objective acoustic measurements to gain insights into the optimal acoustics of the room for vocal production [8].
Therefore, this study aimed to describe the acoustic characteristics of a classroom, voice quality, fatigue, and vocal dosimetry of university professors, providing objective and subjective data on their vocal load in the classroom. These data can be used for the purpose of implementation of public policies for surveillance and intervention in work environments, as well as the promotion of vocal health and prevention of vocal disorders.
Method
This study is part of a larger project entitled “Conforto acústico: saúde vocal docente e inteligibilidade de fala” [Acoustic Comfort: Teacher Vocal Health and Speech Intelligibility] approved by the Research Ethics Committee of Instituto de Ciências da Saúde, from Universidade Federal da Bahia (CEP/ICS/UFBA), under opinion No. 3.186.040/2019. This is an exploratory, observational, longitudinal, and descriptive study with a single group of subjects, three males and two females, using primary data from vocal monitoring. The participants were professors from a Brazilian public university who taught in a specific classroom, which was monitored, and who agreed to participate in the study by signing the Informed Consent Form (ICF).
Subjects between 25 and 65 years of age of both sexes were included, with a minimum weekly workload of 8 hours in the classroom and professional use of voice solely as professors. Regarding age, the vocal efficiency range from 25 to 45 years was considered, with a maximum limit of 65 years, considering the ossification of the laryngeal cartilages [22]. Exclusion criteria were as follows: having flu-like symptoms or upper respiratory tract infection during the monitoring period, undergoing concurrent speech-language pathology therapy during observation, or not being the unique professor teaching the subject.
The criteria for selecting the classroom were as follows: it had to be located in the same building as the Voice and Acoustic Comfort Laboratory of the Speech-language Pathology Department at UFBA, facilitating access for researchers and equipment; accommodating professors from different departments/faculties; and being one of the classrooms with larger spatial dimensions, irrespective of the number of enrolled students.
The architectural study of the classroom began with measurements of its dimensions and the creation of a floor plan. Subsequently, residual sound pressure levels were measured using a LxT2 Larson Davis® (USA) sound level meter at a single point, 1.5 m from the back wall, under the following conditions: air conditioning on with windows closed (WC) and air conditioning off with windows open (WO). The measurement was conducted on a typical class day, during the morning shift, with the classroom unoccupied, for 10 minutes under each condition. Estimates of reverberation times (RT) and speech transmission indexes (STI) were performed using the Enhanced Acoustic Simulator for Engineers (EASE®, AFMG, Germany) software.
A structured questionnaire, developed by the extension and research group “TRASSADO - Trabalho e Saúde Docente” [Work and Teacher Health], registered with SIATEX/UFBA under number 8223, entitled “Programa de Atenção à Saúde e Valorização do Professor” [Health Care and Teacher Appreciation Program], was administered, which was pre-coded and made available for self-administration. The data used in this study included sociodemographic aspects, teaching activity, work environment, vocal health assessment, and income.
Self-perception of voice was assessed on the first day of monitoring using the SIVD (Screening Index for Voice Disorder) protocol [23]. For auditory-perceptual assessment (APA) and acoustic analysis (AA) of the voice, voice samples were recorded before and after classes in a properly calibrated compact audiometric booth, BEL-BABY2 OTOBEL®, and filed using the VoxMetria® software (CTS Informática), installed on a IPMH61P1 CASEMALL® desktop PC, with an Intel® Core™ i5 3.00GHz processor, 16-bit sound card, 44,100Hz. The emissions were captured using a SM10A SHURE®unidirectional headset microphone, connected to a X2U/XLR SHURE® preamplifier, positioned at a distance of four centimeters and 45 degrees from the participant's mouth. The recording followed the Consensus Auditory-Perceptual Evaluation of Voice (CAPE-V) script, validated for Brazilian Portuguese [24], with the addition of the vowel /Ɛ:/ emitted for approximately 5 seconds, for the analysis of objective parameters in VoxMetria® and the vowel /Ɛ:/ during maximum phonation time at the end of the script.
The auditory-perceptual assessment (APA) was conducted by a speech-language pathologist specialized in voice, with ten years of clinical experience in vocal assessment of teachers and independent from the research team. The evaluator was given access to the voice sample files through a cloud storage service (Microsoft OneDrive®), containing the coded folders. All folders had subfolders corresponding to the number of observations for each teacher. The subfolders were randomized using the Research Randomizer software to keep the evaluator blind to the recording time. Matrix samples were replicated for internal agreement analysis, with a minimum of 50% replication of samples and at least four non-replacement replications for each individual. The folders contained samples of connected speech with CAPE-V sentences and sustained vowels /a:/ and /i:/ selected for the APA. The evaluator did not receive samples of spontaneous speech as the professors identified the post-class moment in their speech, which could result in bias in the analyses. T450 JBL® stereo headphones were used for the APA, with a frequency range of 20Hz-20,000Hz and impedance of 32Ω. The evaluator also received properly coded copies of the CAPE-V. Only the overall degree of vocal alteration was analyzed for this study, using values proposed in the literature: 0-35.5 mm for normal variability, 35.6-50.5 mm for mild deviation, 50.6-90.5 mm for moderate deviation, and 90.6-100 mm for severe deviation [25].
A randomization test was applied in order to verify the internal reliability of the judge, using the Spearman linear correlation coefficient, with a (=0.05 significance level. The randomization test is used to analyze very small, random or non-random samples to investigate whether a certain pattern in the data is due to chance, and it compares the values of the statistic from the original data with the values of this statistic after a large number of randomizations [26]. The null hypothesis (H0) states that the pattern in the data does not exist or is a result of chance in the randomized observations, and the alternative hypothesis (Ha) states that the data had a specific pattern [26]. The randomization test was performed by calculating the value of the test statistic for the original data set (eo), and then randomizing these data 10,000 times to calculate the value of the statistic for the ith randomization (eαi). The proportion of times that the randomized statistic (eαi) was greater than or equal to the originally observed statistic (eo) was compared to the significance level, rejecting H0 when this proportion was lower than the adopted significance level.
The acoustic analysis (AA) was performed using the VoxMetria® software, extracting the mean fundamental frequency (f0) of the sustained vowel /Ɛ:/ and the CAPE-V sentences, as well as the values of jitter, shimmer, irregularity, noise, GNE ratio (glottal to noise excitation ratio), maximum phonation time (MPT), and minimum, mean, and maximum intensity. The "Voice Analysis" module of VoxMetria® software, was used for the recording of the CAPE-V sentences, with a sampling rate of 11,025 Hz. The "Voice Quality" module was used, for the recording of the sustained vowel /Ɛ:/ with a sampling rate of 44,100 Hz. The beginning and end of the emission were excluded due to phonatory instability, using the "zoom" tool in the program. The cutoff points considered were those established by the software for jitter (<0.6%), shimmer (<6.5%), noise (<2.5 dB), irregularity (<4.75%), and GNE (>0.5 dB). Normal values were considered for f0: 80 to 150 Hz for males and 150 to 250 Hz for females, with mean values of 113 and 205 Hz, respectively [22]. Regarding MPT, normal values of 20s for males and 14s for females were considered [22]. For the mean intensity, the following values were considered: 60 to 68 dB (SPL) for soft emission, 70 to 78 dB (SPL) for moderate emission, and 80 to 88 dB (SPL) for high emission [27].
Self-perceived vocal fatigue was assessed using the total score of the Vocal Fatigue Index (VFI) [28], which estimates the overall frequency of vocal fatigue symptoms to identify the presence or absence of fatigue [28]. Despite being relatively recent, this validated measure is regarded in the literature as a feasible instrument for research involving the investigation of classroom acoustics’ impacts [8].
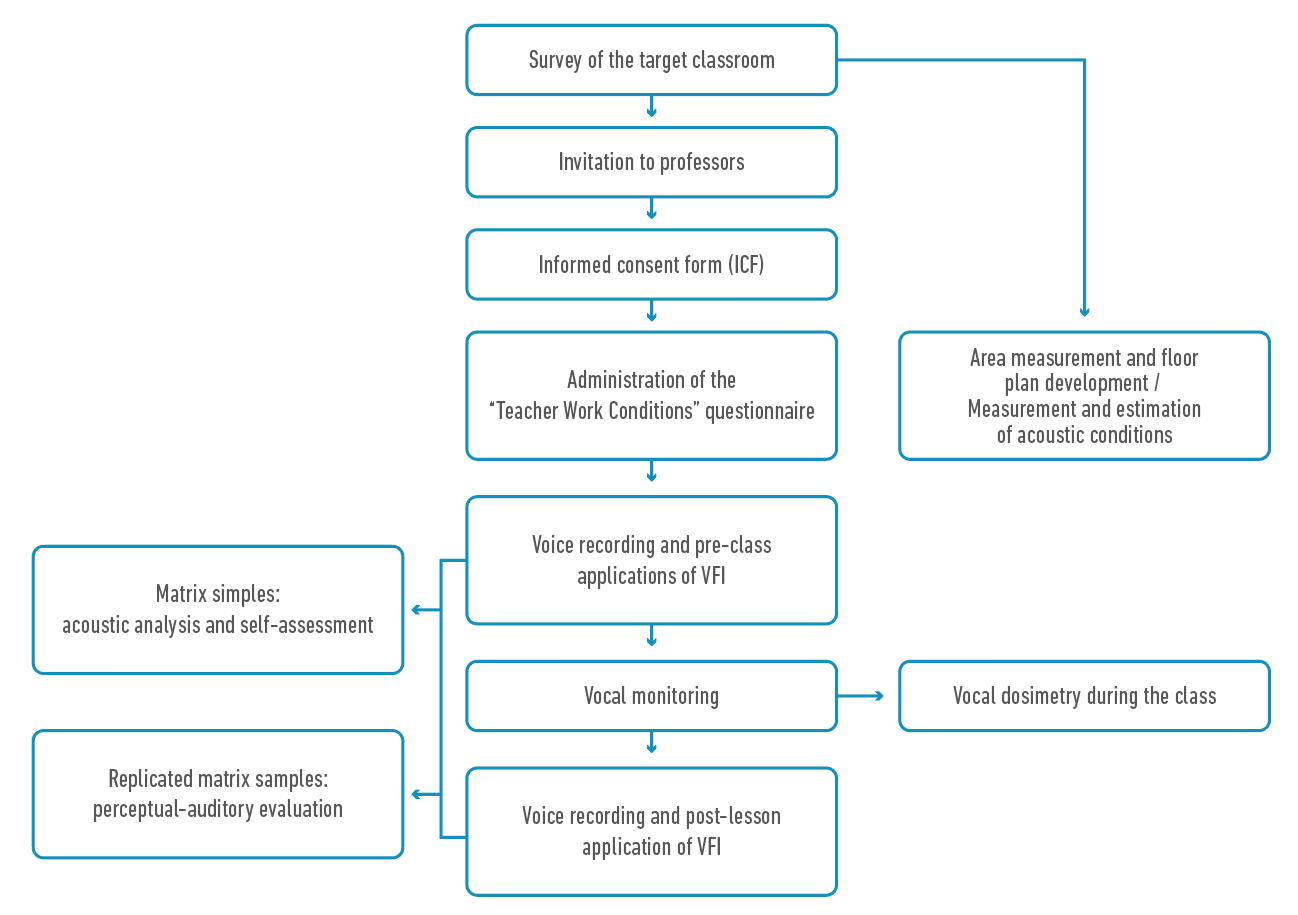
Two vocal dosimeters APM 3200 (KayPentax®, USA) were used for vocal monitoring in the classroom, calibrated by the research team for each professor, prior to the classes, following the manufacturer's guidelines. The participants were monitored throughout their professional voice use in the classroom. At the end of the monitoring, a report was generated by the software with the data related to the collected voice parameters: total monitoring time, expressed in hours and minutes (hh:mm); fundamental frequency (f0), in hertz (Hz); amplitude, in decibels sound pressure level (dB SPL); phonation time, in hours and minutes (hh:mm), corresponding to the total amount of phonation time; phonation percentage, as a percentage (%), which represents the relative phonation time compared to the total monitoring time; cycle dose (Dc), in cycles, corresponding to the number of vocal fold oscillations during the recording; and distance dose (Dd), in meters (m), estimating the total distance traveled by the vocal fold tissue during vibration over time [10]. The study stages are summarized in Figure 1.
The recordings took place over four consecutive weeks. One of the professors did not teach in the classroom during the second week of monitoring, and her analyzed voice samples correspond to the first and third consecutive weeks, with the third consecutive week considered as the second week of monitoring for this participant.
The distribution of schedules for the professors in the target classroom was as follows: professors 1 and 4 on Monday and Wednesday (duration of 1 hour and 40 minutes); professors 2 and 5 on Tuesday and Thursday (duration of 1 hour and 40 minutes); professors 3 on Friday (duration of 3 hours and 20 minutes).
The data were stored in Microsoft Excel® and analyzed using the R Project for Statistical Computing software, version 4.0.0. An exploratory and descriptive analysis of the data was performed, obtaining the mean, minimum, maximum, median, and standard deviation of discrete and continuous variables, as well as frequencies of categorical variables. Graphs were also generated using this data in Microsoft Excel®. Based on these initial analyses, tables were constructed in Microsoft Excel® to present the results.
The analyses were primarily conducted by considering the participants as a unified group. However, for certain variables, individual and/or gender analyses were performed to gain a more comprehensive understanding of the results.
Results
Characterization of participants and the classroom
The sociodemographic characteristics, teaching activity, and vocal health of the monitored teachers are shown in Tables 1, 2, and 3, respectively.
Table 1 Sociodemographic characterization of the monitored professors. Salvador, Brazil, 2019.
| Numeric Variables | Mean (minimum-maximum) |
|---|---|
| Age (years) | 33 (30-38) |
| Monthly income (in Brazilian reais) | 9,120.00 (4,000.00-13,000.00) |
| Categorical Variables | n (%) |
| Sex | |
| Male | 3 (60) |
| Female | 2 (40) |
| Educational level | |
| Master's Degree | 1 (20) |
| Doctoral Degree | 4 (80) |
| Skin color | |
| White | 5 (100) |
Table 2 Self-reported vocal health and SIVD [Screening Index for Voice Disorder] of the monitored professors. Salvador, Brazil, 2019.
| Categorical Variables | n (%) |
|---|---|
| Current vocal change | |
| Yes | 1 (20) |
| No | 4 (80) |
| Vocal changes in the last 6 months | |
| Yes | 4 (80) |
| No | 1 (20) |
| Work absences due to illnesses in the last 6 months | 1 (20) |
| Experiences/have experienced one or more of the following health problems | |
| Rhinitis | 3 (60) |
| Sinusitis | 3 (60) |
| Laryngitis | 2 (40) |
| Pharyngitis | 1 (20) |
| Heartburn | 1 (20) |
| Gastroesophageal Reflux | 2 (40) |
| Tonsillitis | 2 (40) |
| Hormonal disorder | 1 (20) |
| Frequent colds/flu/upper respiratory infections | 1 (20) |
| Vocal habits during classes | |
| Speaking loudly | |
| Sometimes | 3 (60) |
| Always | 2 (40) |
| Screaming | |
| Never | 3 (60) |
| Rarely | 1 (20) |
| Sometimes | 1 (20) |
| Singing | |
| Never | 4 (80) |
| Rarely | 1 (20) |
| Saving voice during breaks | |
| Yes | 1 (20) |
| No | 4 (80) |
| Water intake | |
| Yes | 4 (80) |
| No | 1 (20) |
| Numeric Variables | Average (minimum-maximum) |
| Number of episodes of vocal changes in the last 6 months | 2.5 (1-4) |
| Volume of water intake (cups - 200ml) | 7.2 (0-15) |
| SIVD | 4 (2-7) |
Table 3 Characterization of the environment and teaching activity of the monitored professors. Salvador, Brazil, 2019
| Numeric Variables | Average (minimum-maximum) |
|---|---|
| Years of work as a teacher | 4.4 (2-8) |
| Number of classes currently taught | 3.8 (2-7) |
| Number of students in the classes taught | 36 (25-50) |
| Categorical Variables | n (%) |
| Teaching subject area | |
| Philosophy | 3 (60) |
| Psychology | 1 (20) |
| Economics | 1 (20) |
| Satisfactory classroom acoustics | |
| Yes | 3 (60) |
| No | 2 (40) |
| Classrooms are noisy | |
| Yes | 5 (100) |
| Sources of noise in the classrooms | |
| Schoolyard | 1 (20) |
| Students | 2 (40) |
| Other classrooms | 1 (20) |
| Air conditioning/Fan | 2 (40) |
| Constuction work | 5 (100) |
| Street | 2 (40) |
| Predominant ventilation | |
| Air conditioning | 4 (80) |
| Natural ventilation | 2 (40) |
All participants self-identified as Caucasian, with the majority being male (60%). Approximately 80% held doctoral degrees and their average age was 33 years (Table 1).
The majority (80%) reported experiencing some form of vocal change within the last six months, leading to voice-related health problems. On average, participants reported four vocal symptoms according to the SIVD protocol. While this protocol doesn’t aim to determine symptom frequency, this count was considered in the present study. The most frequently reported symptoms, occurring “sometimes” or “always”, were dry throat (reported by 80% of participants) and strained speech (reported by 60%). Concerning vocal behavior in the classroom, the majority reported never shouting (60%) or singing (80%), and not conserving their voice during class breaks (80%). However, everyone reported speaking loudly, either sometimes (60%) or always (40%). The majority mentioned consuming water during classes (80%), with an average of 7.2 glasses of 200 ml per day (Table 2).
The average duration of their teaching career was 4.4 years, with a maximum of 8 years. The number of classes taught at the time of data collection ranged from two to seven, with an average of 36 students per class. All professors were instructing humanities courses. Regarding classroom environmental conditions, the majority considered the acoustics to be satisfactory (60%). However, all participants reported the presence of noise, primarily originating from construction work at the university. Air conditioning was the predominant method of ventilation in the classrooms, according to 80% of the respondents (Table 3).
Table 4 presents the acoustic measurements and estimates of the classroom. The RT results are presented for frequencies ranging from 250 Hz to 8,000 Hz, covering the frequency spectrum of Brazilian Portuguese phonemes [22].
Table 4 Acoustic measurements and estimates of the classroom, Salvador, Brazil, 2019.
| Variables | WO | WC |
|---|---|---|
| Sound pressure level - SPL (dB) | ||
| LAmin | 50.3 | 56.3 |
| LAequ | 55 | 57.3 |
| LAmax | 60 | 60.4 |
| Speech Transmission Index - STI (s) | 0.31 ≤ STI ≤ 0.38* | |
| Reverberation time - RT (s) | ||
| 250 Hz | 3.24* | |
| 315 Hz | 3.03* | |
| 400 Hz | 2.83* | |
| 500 Hz | 2.67* | |
| 630 Hz | 2.63* | |
| 800 Hz | 2.58* | |
| 1000 Hz | 2.53* | |
| 1250 Hz | 2.43* | |
| 1600 Hz | 2.32* | |
| 2000 Hz | 2.21* | |
| 2500 Hz | 2.10* | |
| 3150 Hz | 1.97* | |
| 4000 Hz | 1.80* | |
| 5000 Hz | 1.61* | |
| 6300 Hz | 1.38* | |
| 8000 Hz | 1.12* |
Note. Abbreviation: WO = windows open and air conditioning off; WC = windows closed and air conditioning on; LAmin = minimum sound pressure level; LAeq = equivalent sound pressure level; LAmax = maximum sound pressure level; *Air conditioning on, temperature of 20ºC, and humidity of 60%.
The collected data indicates that all acoustic measurements and estimates fall below the standards required by national and international legislation for this environment, both in the WC and WO situations.
Vocal dosimetry
Table 5 shows the phonation measures in absolute values and the differences between weeks.
Table 5 Dosimetry measures of the monitored teachers during classes in the classroom, Salvador, Brazil, 2019.
| Professor 1* | Professor 2** | Professor 3* | Professor 4* | Professor 5** | |||||||||||
|---|---|---|---|---|---|---|---|---|---|---|---|---|---|---|---|
| Dosimetry Measurement | Week 1 | Week 2 | Dif | Week 1 | Week 2 | Dif | Week 1 | Week 2 | Dif | Week 1 | Week 2 | Dif | Week 1 | Week 2 | Dif |
| Monitoring time (hour:minute) | 01:22 | 01:33 | 00:11 | 01:47 | 00:06 | -01:41 | 03:20 | 03:10 | -00:10 | 01:21 | 01:39 | 00:18 | 01:23 | 01:21 | 00:02 |
| Phonation time (hour:minute) | 00:17 | 00:33 | 00:16 | 00:40 | 00:02 | -00:38 | 00:10 | 00:23 | 00:13 | 00:08 | 00:09 | 00:01 | 00:09 | 00:02 | -00:07 |
| Phonation percentage (%) | 21.32 | 35.98 | 14.66 | 37.81 | 34.07 | -3.74 | 5.21 | 12.46 | 7.25 | 10.18 | 9.30 | -0.88 | 11.59 | 3.64 | -7.95 |
| f0 (Hertz) | 130.88 | 149.94 | 19.06 | 238.38 | 215.98 | -22.40 | 137.13 | 141.23 | 4.10 | 147.97 | 150.71 | 2.74 | 211.30 | 197.37 | -13.93 |
| Amplitude (dB) | 110.25 | 108.66 | -1.59 | 118.97 | 117.19 | -1.78 | 117.11 | 110.98 | -6.13 | 115.74 | 117.34 | 1.60 | 111.35 | 112.29 | 0.94 |
| Dc (cycles) | 138747 | 302985 | 164238 | 581953 | 29640 | -552313 | 85229 | 200521 | 115292 | 73893 | 83454 | 9561 | 121715 | 35073 | -86642 |
| Dd (m) | 3070.47 | 5502.71 | 2432.24 | 9649.99 | 491.46 | -9158.53 | 1840.36 | 4273.06 | 2432.70 | 1748.53 | 1832.56 | 84.03 | 1683.17 | 534.90 | -1148.27 |
Note. Abbreviation: Moment 1 - before class week 1. Moment 2 - after class week 1. Moment 3 - before class week 2. Moment 4 - after class week 2. *Male. **Female. f0= Fundamental frequency. Dc= Cycle dose. Dd= distance dose. Dif = difference.
Total Monitoring Time, Phonation Time, and Percentage of Phonation
All professors initiated their monitoring sessions in the voice laboratory, immediately before starting classes. It is noteworthy that there were no significant changes in monitoring durations between the two weeks, except for professor 2, who exhibited a 38-minute decrease in the second week.
Speaking durations ranged from two to 40 minutes, with increases observed in three professors between the two weeks, and decrease in two. The percentage of phonation ranged between 3.64% and 37.81%, showing an increase in three participants and a decrease in two between the weeks.
Fundamental Frequency
With the exception of teacher 5, whose fundamental frequency (f0) was lower than the expected average for their gender in the second week of monitoring, all professors had an f0 above the anticipated standards. All male professors had an increase in f0 measurements between the weeks, while female professors experienced a decrease in f0 (Table 5).
Amplitude
All professors achieved an average vocal amplitude exceeding the anticipated standards. There was a reduction in amplitude measurements for the first three professors and an increase for the remaining participants (Table 5).
Cycle Dose and Distance Dose
Cycle Dose (Dc) values ranged from 73893 to 302985 cycles in male participants and from 29640 to 581953 cycles in female participants. When comparing the two weeks, there was an increase for males and a decrease for females (Table 5).
Distance dose (Dd) ranged from 1748.53 to 5502.71 meters in males and from 491.46 to 9649.99 meters in females. In comparing the two, there was an increase in Dd for male professors and a decrease in female professors (Table 5).
Auditory-perceptual vocal assessment, acoustic analysis and VFI
Judge reliability test in auditory-perceptual assessment
Regarding the internal reliability of the judge, the randomization test showed a positive correlation between the evaluations (original and replicated voice samples), both for the grouped data and the individual data (pseudo p-value < 0.05), except for one professor (pseudo p-value = 0.09). Therefore, it can be stated that the majority of the judge's evaluations showed a strong association, resulting in a high degree of internal agreement, not occurring by chance.
Analysis of data from auditory-perceptual assessment, acoustic analysis and VFI
The descriptive analysis of the APA, AA, and VFI data is presented using the means in Table 6. In addition to the grouped results of the studied sample, the overall scores of the CAPE-V and VFI are presented individually, and the parameters influenced by gender are presented separately for males and females.
Table 6 Perceptual-auditory vocal assessment, acoustic analysis, and VFI data. Salvador, Brazil, 2019.
| Evaluation variables | Recording moment | |||
|---|---|---|---|---|
| Mean/Individual score (standard deviation) | ||||
| 1 | 2 | 3 | 4 | |
| CAPE-V General Degree (mm) | 17 (23.12) | 21.6 (28.45) | 13.2 (13.2) | 24.2 (28.6) |
| Professor 1 | 5 | 21 | 0 | 4 |
| Professor 2 | 58 | 70 | 35 | 72 |
| Professor 3 | 12 | 15 | 7 | 4 |
| Professor 4 | 5 | 0 | 10 | 12 |
| Professor 5 | 5 | 2 | 14 | 29 |
| VFI (overall score) | 18 (8.6) | - | 22.6 (5.9) | - |
| Professor 1 | 30 | - | 25 | - |
| Professor 2 | 13 | - | 19 | - |
| Professor 3 | 10 | - | 18 | - |
| Professor 4 | 24 | - | 32 | - |
| Professor 5 | 13 | - | 19 | - |
| Average f0 of vowel /Ɛ:/ (Hz) | 158.75 (52.11) | 165.95 (49.35) | 151.47 (33.56) | 166.82 (48.25) |
| Female* | 215.40 | 218.22 | 185.50 | 214.63 |
| Male* | 120.99 | 131.10 | 128.77 | 134.94 |
| Average f0 of CAPE-V sentences (Hz) | 142.25 (32.70) | 159.67 (39.31) | 150.11 (39.39) | 158.81 (36.37) |
| Female* | 175.42 | 201.43 | 191.49 | 196.71 |
| Male* | 120.14 | 131.80 | 122.52 | 133.55 |
| Jitter (%) | 0.12 (0.05) | 0.20 (0.15) | 0.25 (0.30) | 0.26 (0.31) |
| Shimmer (%) | 4.53 (1.90) | 4.13 (1.87) | 4.43 (2.50) | 4.10 (2.22) |
| GNE (dB) | 0.82 (0.10) | 0.85 (0.11) | 0.85 (0.12) | 0.87 (0.07) |
| Irregularity (%) | 3.62 (0.67) | 3.66 (1.08) | 3.70 (1.14) | 3.65 (1.16) |
| Noise (dB) | 0.98 (0.40) | 0.86 (0.43) | 0.87 (0.47) | 0.76 (0.29) |
| MPT (s) | 12.46 (1.87) | 12.44 (2.33) | 13.50 (2.16) | 12.96 (2.14) |
| Female* | 12.59 | 11.46 | 12.53 | 11.53 |
| Male* | 12.37 | 13.10 | 14.15 | 13.91 |
| Minimum intensity of connected speech (dB) | 26.87 (3.88) | 25.65 (0.86) | 25.59 (4.59) | 25.27 (4.22) |
| Mean intensity of connected speech (dB) | 52.40 (1.82) | 54.80 (3.74) | 54.08 (2.35) | 55.81 (3.03) |
| Maximum intensity of connected speech (dB) | 78.51 (3.64) | 80.30 (4.07) | 78.36 (4.04) | 79.95 (3.51) |
Note. Abbreviation: Moment 1 - before class week 1. Moment 2 - after class week 1. Moment 3 - before class week 2. Moment 4 - after class week 2. Professors 1, 3, and 4 - male; Professors 2 and 5 - female; *Mean by gender.
Regarding the overall degree of alteration in CAPE-V, the mean of the grouped data fell within normal standards. In the analysis of individual data, most professors did not show vocal alterations, with only one professor having scores consistent with dysphonia at all monitoring moments. The mean of the grouped data also showed an increase in scores, although within normal parameters, between the pre- and post-class moments and between the post-class moments of the two weeks.
The mean total score of VFI, applied before the class in week 1 and before the class in week 2, was above the cutoff points, with an increase between the weeks. In the observation of individual data, this occurred in the majority of subjects (80%).
In the acoustic analysis, the mean of f0 of CAPE-V sentences and sustained vowel showed a slight increase, considering the pre- and post-class moments, both for the data analyzed as a single group and by gender. There was an increase in the mean values of GNE and jitter and a decrease in noise, shimmer, and irregularity, considering the pre- and post-class moments. The variables GNE, noise, jitter, shimmer, and irregularity had mean values within the normal range. The minimum intensity of connected speech showed a slight decrease in the mean, while the mean and maximum intensities showed an increase when comparing the pre- and post-class moments. In the original data, the MPT were below the expected values for all participants, ranging from 9.6 s to 16.2 s, and in the grouped data, both as a single group and by gender, they also had mean values below the expected standards.
Discussion
Classroom characterization
The classroom was considered to have a large capacity as it accommodated more than 35 students [29], with a total volume of 242.36 m3 (9.74 x 9.72 x 2.56 m). The capacity of a classroom significantly affects self-reported fatigue in teachers [29], and larger classrooms tend to have longer reverberation times, which can lead to the adoption of vocal behaviors harmful to the voice [30]. Speaking for longer periods in larger and more reverberant classrooms increases the reported vocal effort [29]. Additionally, there is substantial evidence that the Lombard Effect influences self-perception of vocal fatigue [8].
All acoustic measures and estimations are outside the standards established by national and international regulations, both in the WC situation and the WO situation. The reverberation times were above the average recommended by the World Health Organization (WHO) [31], indicating suboptimal conditions for reduced perceived effort and lower vocal intensity among teachers [32]. The STI was below the levels recommended by the IEC 60268-16 standard for all estimated frequencies, indicating intelligibility below the minimum level for understanding simple messages throughout the classroom area. The fact that the majority of participants considered the acoustics satisfactory, despite the values being outside the recommended standards, is in line with the literature indicating a low agreement between objective measurements and self-reports of physical conditions in the workplace [6]. The SPL were also above the recommended levels according to both national (NBR 10152) and international standards [31] to maintain the speech intelligibility [33], exceeding the minimum value for eliciting the Lombard effect [34] and for self-perceived vocal discomfort [35], exposing teachers to the risk of developing a voice-related disorder.
The majority of professors reported that the predominant ventilation in the classrooms is provided by air conditioning. The measured noise levels in the WC situation were above the recommended values in the national (NBR 10152) and international standards [31] and were higher than in the WO situation. The literature reports that the exposure to noise can lead to increased vocal intensity among teachers due to the Lombard effect [34]. Furthermore, all professors reported working in noisy classrooms. A recent literature review highlights a positive relationship between self-reported noise and self-perceived vocal fatigue [8].
Vocal dosimetry
Total Monitoring Time, Phonation Time, and Percentage of Phonation
The variation in mean intra-subject phonation time between weeks was minimal, with an increase for three professors and a decrease for two. The increase in temporal measures of phonation is associated with more reverberant environments [30] and self-reported vocal fatigue [35]. One of the professors experienced a 38-minute decrease in the second week. We question whether there might have been any technical issues with the equipment that could have led to the interruption of monitoring during the class. It is worth noting that the professor did not report any issues to the research team during the data collection.
The percentage of phonation varied significantly among participants, with two of them exceeding the peak of approximately 33% described in the literature for teachers [36]. However, the majority of participants had averages below the previously reported 29.9% [36]. Further studies may be necessary to determine if these lower values are characteristic of university professors, since a large portion of dosimetry studies do not include, or only include a few teachers/professors, at this level of education [37].
In the data from professor 5, in the second week, only 2 minutes of phonation time in one hour and 21 minutes of monitoring can be observed, resulting in an extremely low phonation percentage (3.64%). This was possibly due to the non-expository nature of the class taught on that day. However, we cannot definitively state this hypothesis, since data on applied methodologies were not obtained, which could be addressed in future research.
Fundamental Frequency
The vocal dosimetry data show that most male professors used their voice in the classroom with an average fundamental frequency (f0) above the expected standards for the mean of 103 Hz [22], but within the tonal range [22]. The mean f0 values for male professors were very close to the upper limit of the expected tonal range for their gender, i.e., around 150 Hz, according to the literature [22].
Female professors had mean f0 values within the tonal range [22] in half of the measurements. The literature reports lower f0 values (183 Hz for women and 118 Hz for men) [36] than those found in the present study. Several hypotheses can be proposed to explain these differences, including the smaller sample size in the present study (n = 47 vs. n = 5), differences in education levels (elementary/high school vs. university education), variations in monitoring duration (daily for two weeks vs. one class for two weeks), and distinct environmental requirements, such as acoustics and room capacity (various rooms and schools vs. single room for all subjects).
Considering that large rooms with acoustics challenges may require professors to increase vocal intensity, which, as suggested by the literature, can affect f0 by raising it [36], we suggest that the acoustic and architectural conditions of the classroom played a crucial role in the obtained results.
The professor with the highest average f0 values also used a higher phonation percentage than reported in the literature, which found an average of 23.6% in teachers with vocal problems [38], and exceeded the safe limit of 35 minutes for phonation time suggested by the literature [39], in the first week. Interestingly, this professor had a vocal deviation according to the CAPE-V, with higher scores for the overall degree of alteration after class, and also the highest score for SIVD among the participants. It is hypothesized, according to the literature, that the use of high-frequency vocalization for a prolonged period exposes the vocal fold tissues to excessive vibration, contributing to the development of voice disorders [39].
The use of high f0 levels during classes may be due to physiological adaptation to the work context, with increased laryngeal hypertonicity [40] and phonatory tension [41], which may have occurred with the participants.
Amplitude
Regarding amplitude, average values from 108.66 to 118.97 dB were found, exceeding the literature's values (80-88 dB) by more than 30 dB for elevated emission [27]. Additionally, the literature indicates that the variation between different classification strata has a difference of 20 dB among them [27]. Thus, the data obtained in this research, besides exceeding elevated emission [27], would theoretically be two strata above.
In this context, our hypothesis is that architectural and acoustic factors are responsible for these elevated vocal amplitude levels. This assumption is supported by existing literature, which suggests that high amplitude values in vocal production may be attributed to the large size of the classroom [29], which would require a higher signal-to-noise ratio, possibly due to the acoustic conditions of the room, especially the RT [30].
A study with teachers indicated that a change from 70 dB NPS to 90 dB NPS increases Dd at much higher rates than a change from 50 dB NPS to 70 dB NPS [30]. If this reality is applicable to higher amplitudes, the impact of using the voice at extremely high intensities on Dd parameters could potentially be detrimental to professors. Further predictive studies considering amplitudes higher than 90 dB NPS are necessary to confirm this hypothesis.
Cycle Dose and Distance Dose
In this research, Cd values for females ranged from 29640 to 581953 cycles, while Dd ranged from 491.46 to 9649.99 meters. For males, Cd varied from 73893 to 302985 cycles, and Dd ranged from 1748.53 to 5502.71 meters. In most cases, the recorded results were lower for both genders than those reported in a literature review with meta-analysis [37]. The only exception was for Dd in males, where the values fell within the range reported by previous research (Cd: 0.2 to 2.0 million cycles for women and 0.1 to 1.2 million cycles for men; Dd: 552 to 5000 meters for women and from 718 to 4750 meters for men) [37]. This literature review also indicated that women using their voice occupationally tend to have higher Cd and Dd values than men [37], which was not observed in the present study.
Vocal dosimetry - comparisons before/after classes and between weeks
Regarding the changes between weeks, vocal dosimetry data showed that male professors increased phonation time, f0, Dc, and Dd, while women had a decrease in these measures. Regarding amplitude between weeks, three subjects showed an increase, and two showed a decrease, which, apparently, has no pattern related to gender. Data regarding the pedagogical methodology used in the classes were not collected in this study. However, one possible interpretation is that male professors may have used teaching strategies with a higher vocal demand in the second week of monitoring, thereby increasing phonation time.
Regarding f0, a study found higher f0 values at the end of the school year, as well as higher vocal intensity levels, even higher at the end of the year during non-occupational conversation tasks [32]. This would be a result of the use of high vocal intensities during work that would lead teachers to also use a higher voice level during non-occupational activities [32]. There was a significant increase in vocal intensity levels and a decrease in the percentage of phonation during classes at the end of the year in schools with poorer acoustic conditions [32]. According to the authors, this may be due to teachers using increasingly higher vocal intensity levels, when exposed to high levels of noise and reverberation but reduce the percentage of phonation at the end of the year as an attempt to reduce the sensation of vocal fatigue [32].
Another study found a progressive increase in f0 and vocal intensity during the workday in healthy teachers, statistically significant from the fourth teaching hour [40]. The progressive increase in f0 during the workday in healthy teachers is possibly due to the increase in laryngeal hypertonicity aimed at a physiological adaptation to the work context [40]. Since all classes in this study had less than four hours, future research is suggested to include longer monitoring periods of occupational voice use.
The differences in mean f0 used during classes between the weeks were positive for all men and negative for all women in the present study. Given that no inferential analysis was conducted and the differences varied considerably among subjects, future studies should aim for a larger number of participants and a longer duration of occupational voice monitoring. This could be useful to verify whether the differences are statistically significant or due to the inherent variability of the measurements.
Auditory-perceptual vocal assessment, acoustic analysis and VFI - comparisons before/after classes and between weeks
The increase in the overall CAPE-V score after classes, in the aggregated data, during the two monitoring weeks, and in the post-class comparison between weeks, may be a result of a potential trend towards vocal quality deterioration as a response to classroom demands, even though the values remain within normal ranges. The literature suggests that even in the absence of hoarseness, perceptual-auditory evaluation can identify or measure unhealthy vocal quality when complaints, such as vocal fatigue and discomfort are present during speech, highlighting the importance of multidimensional voice assessment [24].
For the aggregated data, the acoustic analysis showed an increase in average values of f0, mean intensity, GNE, and jitter, as well as a decrease in shimmer after classes when comparing the two weeks. Regarding frequency, several studies reported the increase in f0 after a day of work among teachers [37,39,41,42].
No studies investigating GNE values after vocal load were found, but it is presumed that in this study, the increase in average f0, possibly due to increased laryngeal hypertonicity [40] and phonatory tension [41], facilitated reduced air escape between the vocal folds during phonation, leading to increased GNE values.
The average jitter values remained within normal parameters but increased after classes, contrary to what is reported in the literature [42]. In this study, the shorter monitoring times may have influenced the lack of decrease in average jitter. The average shimmer was also maintained within normal ranges but decreased after classes, which is in line with the literature [43]. Regarding the MPT, the average values below expected were observed for both aggregated and gender-specific data. As a measure of glottic efficiency that indicates the ability to control the airflow from the lungs and the laryngeal myoelastic forces [22], participants may be experiencing difficulties in this mechanism. The increase in average f0 of sustained vowels between the weeks may result from the increasing use of vocal tension over the weeks, which is consistent with the findings of two studies [40,41].
The majority of participants had overall VFI scores above the normal range, with an increase between the monitoring weeks. In this sense, a study found high VFI among teachers, with higher rates among those teaching in classrooms with a capacity of more than 35 students [29]. In addition, increased vocal fatigue was also evident among female teachers aged 20 to 45 years [29]. In this study, factors such as classroom capacity and age range likely contributed to the self-perception of vocal fatigue.
Moreover, the findings reveal that all professors perceive classrooms as noisy environments and that the monitored classroom is specifically characterized by moderate noise levels [33]. A study with vocally healthy young individuals reported a higher vocal effort perception in environments with moderate noise (54.5 dB) and high noise levels (average of 67.5 dB) compared to silent environments (35.5 dB) [33].
Other acoustic parameters, such as RT [32], may play an important role in the response to vocal demands imposed by noisy environments. In this regard, the professors in the present study used vocal intensity levels that exceeded the expected levels for the maximum background noise demand of 60.4 dB, possibly influenced by other inadequately adjusted acoustic parameters of the classroom, which may have reflected in the VFI scores. Another study indicated that self-perceived vocal fatigue increased when phonation time, voice intensity, f0, and vocal intensity modulation increased [35]. Among these factors, the ones that contributed the most to the increase in self-reported vocal fatigue were vocal load duration, and the interaction between the standard deviations of intensity and f0 [35]. It is suggested that future studies analyze vocal intensity modulation, as there seems to be an ideal range (around 8 dB) that allows for lower levels of vocal fatigue [35].
Considering that this study found a difference in the mean VFI values between the weeks, we presume that the VFI scale validated for Brazilian Portuguese [28] may also be useful for longitudinal monitoring of professors in the occupational setting. This suggestion is based on the impression that perceived vocal fatigue may be influenced by physical sensations or speech environment impressions experienced during or immediately before the protocol filling. Further studies with larger sample sizes could be implemented to investigate if there are differences in the perception of vocal fatigue at different moments during the academic year in the occupational context, and how different factors and the overall VFI score behave in these moments. The analysis of factor scores can also help to understand the specificities of vocal fatigue in this population [28].
Vocal Demand and Workplace Interventions
In populations characterized by substantial vocal demand, such as professors, the literature proposes an approach to mitigate the risk of vocal damage through the implementation of compensation strategies among vocal variables [36]. Within this context, variables demonstrating greater potential for compensation include amplitude, vocal fold collision, and speech duration [36]. Beyond individual interventions, we consider that collective workplace interventions can enhance acoustic conditions, thereby contributing to the reduction of vocal demands. By adjusting parameters related to noise, reverberation and STI parameters, these interventions may result in a reduced potential for vocal ailments within this demographic. Additionally, factors pertaining to work organization, such as incorporating scheduled breaks, may lead to a decrease in vocal strain among between teachers [36].
Limitations
This study presents an innovative method using vocal dosimetry during classes, combined with classroom acoustic measurements, vocal quality evaluation, and self-assessment of vocal fatigue over two weeks of teaching. However, it has limitations due to its exploratory nature, namely a small and heterogeneous sample regarding gender, which directly influences some analyzed vocal parameters, particularly those subjected to aggregate analysis. Furthermore, the measurements were confined to a solitary classroom, thereby precluding comparisons of vocal demand and responses across diverse settings, perceptual-auditory evaluation by only one judge, and descriptive data analysis, which prevents generalization of the findings. Considering the descriptive analysis of this study, it cannot be stated that the described differences were statistically significant due to the absence of inferential tests. Such variations may be due to the inherent variability of the measurements, which can be investigated in future studies.
Conclusion
Despite the low current occurrence of possible vocal disorders among participants, the majority reported some type of vocal alteration in the past six months and voice-related health problems. All participants reported speaking loudly in the classroom, with the most commonly reported vocal symptoms being dry throat and vocal fatigue.
The unoccupied classroom was considered large and had acoustical conditions that did not meet national and international standards, with higher background noise levels when the air conditioning was on and the windows were closed.
The vocal doses presented during classes were likely a response to the high vocal demand imposed by the acoustical conditions and classroom size. Furthermore, the parameters analyzed after classes, compared to before classes, may indicate deterioration in vocal quality, increased vocal fatigue, compensatory tension to overcome vocal strain, or simply a physiological adaptation to the imposed demand.
The overall VFI scores suggest the occurrence of vocal fatigue among the professors. In addition, the increase in scores in the second week may be due to an elevated sense of cumulative fatigue from work.
The findings of this study point to a possible vocal overload among the surveyed replace teachers with professors, as the parameters related to “vocal demand” and “response to vocal demand” exceeded the values expected in the literature.
Research with real-time monitoring among professors is still limited. Considering the limitations of this study, further research with a larger sample size is suggested to enable inferential statistical analysis or the use of computationally intensive statistical methods, such as randomization tests that can be applied to small samples, to investigate whether the patterns in the data are merely due to chance. The use of such tools can be valuable, especially in contexts where collecting data from large samples is challenging, whether due to operational costs, limited research teams, few participants, or situations of social contact restrictions, such as those experienced during the COVID-19 pandemic.
New research is being conducted in acoustically conditioned classroom to evaluate collective intervention proposals. These proposals include a particular interest in investigating the effects of acoustical treatment using sustainable and low-cost materials in classrooms, aiming to reduce the vocal burden on professors, which can contribute to promoting vocal health and preventing dysphonia inreplace teachers with this population.
We appreciate the support of Fundação de Amparo à Pesquisa do Estado da Bahia (FAPESB), Universidade Federal da Bahia (UFBA), Conselho Nacional de Desenvolvimento Científico e Tecnológico (CNPq), and Audium Áudio e Acústica.

