<?xml version="1.0" encoding="ISO-8859-1"?><article xmlns:mml="http://www.w3.org/1998/Math/MathML" xmlns:xlink="http://www.w3.org/1999/xlink" xmlns:xsi="http://www.w3.org/2001/XMLSchema-instance">
<front>
<journal-meta>
<journal-id>0012-7353</journal-id>
<journal-title><![CDATA[DYNA]]></journal-title>
<abbrev-journal-title><![CDATA[Dyna rev.fac.nac.minas]]></abbrev-journal-title>
<issn>0012-7353</issn>
<publisher>
<publisher-name><![CDATA[Universidad Nacional de Colombia]]></publisher-name>
</publisher>
</journal-meta>
<article-meta>
<article-id>S0012-73532012000200019</article-id>
<title-group>
<article-title xml:lang="en"><![CDATA[TPM IMPLEMENTATION IMPACT ON COMPANIES’ COMPETITIVITY IN THE MEDELLIN METROPOLITAN AND ANTIOQUIA’S EASTERN REGION, COLOMBIA]]></article-title>
<article-title xml:lang="es"><![CDATA[IMPACTO DE LA APLICACIÓN DE TPM EN LA COMPETITIVIDAD DE LAS EMPRESAS DEL ÁREA METROPOLITANA DE MEDELLIN Y LA REGION DEL ORIENTE ANTIOQUEÑO, COLOMBIA]]></article-title>
</title-group>
<contrib-group>
<contrib contrib-type="author">
<name>
<surname><![CDATA[ARANGO SERNA]]></surname>
<given-names><![CDATA[MARTÍN DARIO]]></given-names>
</name>
<xref ref-type="aff" rid="A01"/>
</contrib>
<contrib contrib-type="author">
<name>
<surname><![CDATA[ALZATE LÓPEZ]]></surname>
<given-names><![CDATA[JUAN FELIPE]]></given-names>
</name>
<xref ref-type="aff" rid="A02"/>
</contrib>
<contrib contrib-type="author">
<name>
<surname><![CDATA[ZAPATA CORTES]]></surname>
<given-names><![CDATA[JULIAN ANDRES]]></given-names>
</name>
<xref ref-type="aff" rid="A03"/>
</contrib>
</contrib-group>
<aff id="A01">
<institution><![CDATA[,Universidad Nacional Facultad de Minas ]]></institution>
<addr-line><![CDATA[ ]]></addr-line>
</aff>
<aff id="A02">
<institution><![CDATA[,Universidad Nacional de Colombia, Sede Medellín  ]]></institution>
<addr-line><![CDATA[ ]]></addr-line>
</aff>
<aff id="A03">
<institution><![CDATA[,Institución Universitaria Esumer  ]]></institution>
<addr-line><![CDATA[ ]]></addr-line>
</aff>
<pub-date pub-type="pub">
<day>00</day>
<month>04</month>
<year>2012</year>
</pub-date>
<pub-date pub-type="epub">
<day>00</day>
<month>04</month>
<year>2012</year>
</pub-date>
<volume>79</volume>
<numero>172</numero>
<fpage>164</fpage>
<lpage>170</lpage>
<copyright-statement/>
<copyright-year/>
<self-uri xlink:href="http://www.scielo.org.co/scielo.php?script=sci_arttext&amp;pid=S0012-73532012000200019&amp;lng=en&amp;nrm=iso"></self-uri><self-uri xlink:href="http://www.scielo.org.co/scielo.php?script=sci_abstract&amp;pid=S0012-73532012000200019&amp;lng=en&amp;nrm=iso"></self-uri><self-uri xlink:href="http://www.scielo.org.co/scielo.php?script=sci_pdf&amp;pid=S0012-73532012000200019&amp;lng=en&amp;nrm=iso"></self-uri><abstract abstract-type="short" xml:lang="en"><p><![CDATA[Best practices methodologies have been used by different companies as competitive growing tools in a globalized market. In Colombia, particularly in the Medellín Metropolitan Area (MMA) and Antioquia’s eastern region,; it can be noticed that total productive management (TPM) has been adopted as a competitive support tool. This article evaluates the TPM implementation impact on different competitiveness variables for the companies that are working on it at the AMVA and near easterly regions, finding that there is not a clear relationship between the improvements reached and the main returns, efficiency and even in the results obtained in key business indicators such as overall equipment effectiveness (OEE), failures (breakdowns) and throughput.]]></p></abstract>
<abstract abstract-type="short" xml:lang="es"><p><![CDATA[Las metodologías para las buenas prácticas han sido usadas por diferentes compañías como herramientas para incrementar la competitividad en el Mercado global. En Colombia, y particularmente en el área metropolitana de Medellín (AMM) y la región del oriente antiqueño, es posible observar que la administración total de la producción (TPM) ha sido adaptada como una herramienta para soportar dicho incremento en competitividad. Este articulo evalúa el impacto de la implementación de TPM sobre diferentes compañías en el AMM y la región del oriente antioqueño, encontrando que no existe una relación clara entre las mejoras alcanzadas y los principales retornos económicos, la eficiencia e inclusive en los resultados obtenidos en los indicadores clave del negocio como son OEE (Efectividad Global de los equipos), Fallas y aumento en la capacidad de producción.]]></p></abstract>
<kwd-group>
<kwd lng="en"><![CDATA[Total productive management]]></kwd>
<kwd lng="en"><![CDATA[Total productive maintenance]]></kwd>
<kwd lng="en"><![CDATA[Medellín Metropolitan Area]]></kwd>
<kwd lng="en"><![CDATA[Productivity]]></kwd>
<kwd lng="en"><![CDATA[Competitiveness]]></kwd>
<kwd lng="es"><![CDATA[Administración total de la productividad]]></kwd>
<kwd lng="es"><![CDATA[Mantenimiento total de la productividad]]></kwd>
<kwd lng="es"><![CDATA[Área Metropolitana de Medellín]]></kwd>
<kwd lng="es"><![CDATA[Productividad]]></kwd>
<kwd lng="es"><![CDATA[Competitividad]]></kwd>
</kwd-group>
</article-meta>
</front><body><![CDATA[ <p align="center"><font size="4" face="Verdana, Arial, Helvetica, sans-serif"><b>TPM  IMPLEMENTATION IMPACT ON COMPANIES' COMPETITIVITY IN THE MEDELLIN METROPOLITAN  AND ANTIOQUIA'S EASTERN REGION, COLOMBIA</b></font></p>     <p align="center"><i><font size="3"><b><font face="Verdana, Arial, Helvetica, sans-serif">IMPACTO DE LA APLICACI&Oacute;N DE TPM EN LA COMPETITIVIDAD DE LAS  EMPRESAS DEL &Aacute;REA METROPOLITANA DE MEDELLIN Y LA REGION DEL ORIENTE ANTIOQUE&Ntilde;O,  COLOMBIA</font></b></font></i></p>     <p align="center">&nbsp;</p>     <p align="center"><font size="2" face="Verdana, Arial, Helvetica, sans-serif"><b>MART&Iacute;N DARIO ARANGO SERNA</b>    <br>   <i>Ph.D. Facultad de Minas, Universidad Nacional, <a href="mailto:mdarango@unal.edu.co">mdarango@unal.edu.co</a></i></font></p>     <p align="center"><font size="2" face="Verdana, Arial, Helvetica, sans-serif"><b>JUAN FELIPE ALZATE L&Oacute;PEZ</b>    <br>   <i>M.Sc. Universidad Nacional de Colombia, Sede Medell&iacute;n, <a href="mailto:jfalzatel@unal.edu.co">jfalzatel@unal.edu.co</a></i></font></p>     <p align="center"><font size="2" face="Verdana, Arial, Helvetica, sans-serif"><b>JULIAN ANDRES ZAPATA CORTES</b>    <br>   <i>M.Sc. Professor of Instituci&oacute;n Universitaria Esumer, <a href="mailto:jazapat@unal.edu.co">jazapat@unal.edu.co</a></i></font></p>     <p align="center">&nbsp;</p>     ]]></body>
<body><![CDATA[<p align="center"><font size="2" face="Verdana, Arial, Helvetica, sans-serif"><b>Received for review November 12<sup>th</sup>, 2010, accepted May 5<sup>th</sup>, 2011, final version May, 10<sup>th</sup>, 2011</b></font></p>     <p>&nbsp;</p> <hr>     <p><font size="2" face="Verdana, Arial, Helvetica, sans-serif"><b>ABSTRACT: </b>Best practices methodologies have been used by different companies as competitive growing tools in a globalized market. In Colombia, particularly in the Medell&iacute;n Metropolitan Area (MMA) and Antioquia's eastern region,; it can be noticed that total productive management (TPM) has been adopted as a competitive support tool. This article evaluates the TPM implementation impact on different competitiveness variables for the companies that are working on it at the AMVA and near easterly regions, finding that there is not a clear relationship between the improvements reached and the main returns, efficiency and even in the results obtained in key business indicators such as overall equipment effectiveness (OEE), failures (breakdowns) and throughput.</font></p>     <p><font size="2" face="Verdana, Arial, Helvetica, sans-serif"><b>KEY WORDS:</b> Total productive management, Total productive maintenance, Medell&iacute;n Metropolitan Area, Productivity, Competitiveness</font></p>     <p><font size="2" face="Verdana, Arial, Helvetica, sans-serif"><b>RESUMEN:</b> Las metodolog&iacute;as para las buenas pr&aacute;cticas han sido usadas por diferentes compa&ntilde;&iacute;as como herramientas para incrementar la competitividad en el Mercado global. En Colombia, y particularmente en el &aacute;rea metropolitana de Medell&iacute;n (AMM) y la regi&oacute;n del oriente antique&ntilde;o, es posible observar que la administraci&oacute;n total de la producci&oacute;n (TPM) ha sido adaptada como una herramienta para soportar dicho incremento en competitividad. Este articulo eval&uacute;a el impacto de la implementaci&oacute;n de TPM sobre diferentes compa&ntilde;&iacute;as en el AMM y la regi&oacute;n del oriente antioque&ntilde;o, encontrando que no existe una relaci&oacute;n clara entre las mejoras alcanzadas y los principales retornos econ&oacute;micos, la eficiencia e inclusive en los resultados obtenidos en los indicadores clave del negocio como son OEE (Efectividad Global de los equipos), Fallas y aumento en la capacidad de producci&oacute;n.</font></p>     <p><font size="2" face="Verdana, Arial, Helvetica, sans-serif"><b>PALABRAS CLAVE:</b> Administraci&oacute;n total de la productividad, Mantenimiento total de la productividad, &Aacute;rea Metropolitana de Medell&iacute;n, Productividad, Competitividad.</font></p> <hr>     <p>&nbsp;</p>     <p><font size="3" face="Verdana, Arial, Helvetica, sans-serif"><b>1. INTRODUCTION</b></font></p>     <p><font size="2" face="Verdana, Arial, Helvetica, sans-serif">During recent years, several industrial sectors have tried to develop different methodologies which, in general, correspond to best practices that had been conceived at different organizational levels, including strategic initiatives that create real competitive advantages but do not guarantee real sustainability throughout time [1]. According to Wiremann [2] the main international methodologies for best practices are: Lean manufacturing, Kaizen, 5S, Kanban, single minute exchange die (SMED) and standardization, total productive maintenance/management (TPM), six sigma, supply chain management (SCM), reliability centered maintenance (RCM) [2]. For the Colombian context, the main methodologies are: lean manufacturing, TPM, SMED, Gemba, Kaizen, six sigma, manufacturing units, Kanban, Toyota production system (TPS), just in time (JIT), total quality management (TQM) and ISO9001, which can differ according to companies' requirements. </font></p>     <p><font size="2" face="Verdana, Arial, Helvetica, sans-serif">National Council on Economic and Social Policy CONPES in 2008 [3] established the need for executing some action plans over the National Competitiveness System framework, where a &quot;Jump in productivity and employment&quot; is part of the needs identified for Colombia. In Colombia, the manufacturing industry generated in 2008 the 14.22 % of the Gross Domestic Product (GDP) [4], the Department of Antioquia shares an 18.27 % [4] while the Medell&iacute;n Metropolitan Area (MMA) has 77.38 % of the department production [5]. It is important to notice that this value does not includes Guarne and Rionegro municipalities, which are considered part of the Antioquia's eastern region, because those towns are located outside of the MMA.</font></p>     ]]></body>
<body><![CDATA[<p><font size="2" face="Verdana, Arial, Helvetica, sans-serif">Different studies suggest that TPM is the base for implementing different methodologies [6]. TPM could be a prerequisite for other methodologies, as for example TQM [7] and lean manufacturing [8], since TPM can be considered as a methodology that effectively supports World Class Manufacturing efforts [9], even for SLE [10]. This article characterizes some of the results obtained from some companies that have used TPM, with the aim of evaluating the impact that this methodology has produced in the business indicators of such companies.</font></p>     <p>&nbsp;</p>     <p><font size="3" face="Verdana, Arial, Helvetica, sans-serif"><b>2. FINANCIAL ANALYSIS FROM THE POINT OF VIEW OF COMPETITIVENESS</b></font></p>     <p><font size="2" face="Verdana, Arial, Helvetica, sans-serif">Financial ratios allow the comparison of the global performance between different companies. The analysis widely uses the rations from the basic financial statements, including debt, liquidity, efficiency, and return ratios [11,12].</font></p>     <p><font size="2" face="Verdana, Arial, Helvetica, sans-serif"><b>2.1. Productivity Indexes</b></font></p>     <p><font size="2" face="Verdana, Arial, Helvetica, sans-serif"><b>2.1.1. OEE (Overall Equipment Effectiveness)</b></font></p>     <p><img src="/img/revistas/dyna/v79n172/a19eq01.gif"></p>     <p><font size="2" face="Verdana, Arial, Helvetica, sans-serif"><b>2.1.2 Failure Decrease</b></font></p>     <p><img src="/img/revistas/dyna/v79n172/a19eq02.gif"></p>     <p><font size="2" face="Verdana, Arial, Helvetica, sans-serif"><b>2.1.3. Throughput Increase</b></font></p>     ]]></body>
<body><![CDATA[<p><img src="/img/revistas/dyna/v79n172/a19eq03.gif"></p>     <p><font size="2" face="Verdana, Arial, Helvetica, sans-serif"><b>2.2. Income ratios as competitiveness verification elements</b></font></p>     <p><b><font size="2" face="Verdana, Arial, Helvetica, sans-serif">2.2.1 ROA - (Return of Assets)</font></b></p>     <p><img src="/img/revistas/dyna/v79n172/a19eq04.gif"></p>     <p><font size="2" face="Verdana, Arial, Helvetica, sans-serif"><b>2.2.2 ROE - (Return of Equity)</b></font></p>     <p><img src="/img/revistas/dyna/v79n172/a19eq05.gif"></p>     <p><font size="2" face="Verdana, Arial, Helvetica, sans-serif"><b>2.3. Efficiency ratios as competitiveness verification elements</b></font></p>     <p><font size="2" face="Verdana, Arial, Helvetica, sans-serif"><b>2.3.1 Sales - Total Assets relation</b></font></p>     <p><img src="/img/revistas/dyna/v79n172/a19eq06.gif"></p>     <p><font size="2" face="Verdana, Arial, Helvetica, sans-serif"><b>2.4. Debt ratios as competitiveness verification elements</b></font></p>     ]]></body>
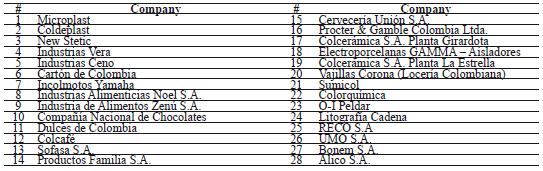
<body><![CDATA[<p><img src="/img/revistas/dyna/v79n172/a19eq07.gif"></p>     <p>&nbsp;</p>     <p><font size="3" face="Verdana, Arial, Helvetica, sans-serif"><b>3. RESEARCH METHODOLOGY</b></font></p>     <p><font size="2" face="Verdana, Arial, Helvetica, sans-serif">The research methodology is based on quantitative and qualitative analysis of TPM effect at MMA and Antioquia's eastern region. For doing this, it was done a previous analysis for the local environment, with different companies that implement TPM in the studied region. A characterization of the reported income statements was made and finally a survey was done to the TPM leaders of the analyzed companies. <a href="#tab01">Table 1</a> shows a list of such companies.</font></p>     <p align="center"><font size="2" face="Verdana, Arial, Helvetica, sans-serif"><b><a name="tab01"></a>Table 1.</b> Companies analyzed. Source: author</font>    <br>   <img src="/img/revistas/dyna/v79n172/a19tab01.gif"></p>     <p><font size="2" face="Verdana, Arial, Helvetica, sans-serif">TPM Implementation at these companies has followed several models, Japan Institute of Plant Maintenance Basic Model Based (JIMP), but with some adjustments done by consultants and different companies. However, specific approaches in TPM implementations were developed particularly for Antioquia's culture. </font></p>     <p><font size="2" face="Verdana, Arial, Helvetica, sans-serif">Every company was asked to fill a simple survey where Basic TPM development information was asked, considering among others:</font></p> <ul>   <li class="dyna-normal"><font size="2" face="Verdana, Arial, Helvetica, sans-serif">Initial effort year</font></li>   <li class="dyna-normal"><font size="2" face="Verdana, Arial, Helvetica, sans-serif">OEE (Overall Equipment Effectiveness) Base</font></li>   <li class="dyna-normal"><font size="2" face="Verdana, Arial, Helvetica, sans-serif">OEE Actual Value</font></li>   <li class="dyna-normal"><font size="2" face="Verdana, Arial, Helvetica, sans-serif">% failure decrease</font></li>   <li class="dyna-normal"><font size="2" face="Verdana, Arial, Helvetica, sans-serif">% Throughput Increase</font></li>   <li class="dyna-normal"><font size="2" face="Verdana, Arial, Helvetica, sans-serif">Improvements per employee</font></li>     </ul>     <p><font size="2" face="Verdana, Arial, Helvetica, sans-serif">This information, obtained during three weeks, was confronted with TPM leaders interviews in order to have a wide vision of the implementation process and this does not consider the financial information, since that this data, even of public domain by law, is considered very sensible in the culture of Colombian companies. </font></p>     ]]></body>
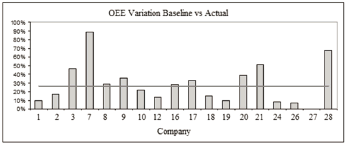
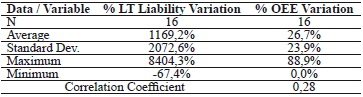
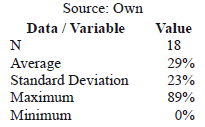
<body><![CDATA[<p><font size="2" face="Verdana, Arial, Helvetica, sans-serif">For the companies analyzed, the income statements and balance sheets information was consolidated for the years between 1999 to 2008.</font></p>     <p><font size="2" face="Verdana, Arial, Helvetica, sans-serif">The interviews with TPM leaders of the different companies mentioned were sustained in order to obtain a better understanding of the model, difficulties and advantages in every organization, so the study would be more engaging.</font></p>     <p>&nbsp;</p>     <p><font size="3" face="Verdana, Arial, Helvetica, sans-serif"><b>4. RESULTS</b></font></p>     <p><b><font size="2" face="Verdana, Arial, Helvetica, sans-serif">4.1. Productivity Increase    <br>   </font></b><font size="2" face="Verdana, Arial, Helvetica, sans-serif">From a survey made to a focus group, which were answered effectively by 16 of 28 requested companies, basic indicator information was obtained. From 16 companies that answered, 16 reported OEE data, 13 reported failure decrease and only 5 reported the throughput increase rate.</font></p>     <p><font size="2" face="Verdana, Arial, Helvetica, sans-serif">For OEE values in the studied companies, a difference is established between the baseline and actual value for this indicator. This difference can be notice in <a href="#fig01">figure 1</a>.</font></p>     <p align="center"><font size="2" face="Verdana, Arial, Helvetica, sans-serif"><b><a name="fig01"></a><img src="/img/revistas/dyna/v79n172/a19fig01.gif">    <br>   Figure 1. </b>OEE variation Baseline vs. Actual. Source: Own</font></p>     <p><font size="2" face="Verdana, Arial, Helvetica, sans-serif"><a href="#tab02">Table 2</a> shows a basic descriptive statistical analysis of the improvement in the OEE for the studied companies.</font></p>     ]]></body>
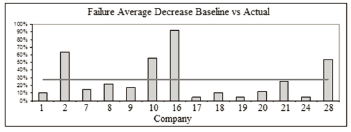
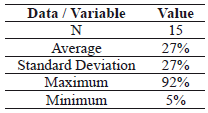
<body><![CDATA[<p align="center"><font size="2" face="Verdana, Arial, Helvetica, sans-serif"><b><a name="tab02"></a>Table 2.</b> Descriptive statistics analysis of OEE Variation. Source: Own</font>    <br>   <img src="/img/revistas/dyna/v79n172/a19tab02.gif"></p>     <p><font size="2" face="Verdana, Arial, Helvetica, sans-serif">Failure decrease, typically improved by TPM implementation (it is part of 3Z's model, since zero failures is a fundamental TPM objective) is shown in <a href="#fig02">figure 2</a>. <a href="#tab03">Table 3</a> shows the descriptive statistical analysis for this figure.</font></p>     <p align="center"><font size="2" face="Verdana, Arial, Helvetica, sans-serif"><b><a name="fig02"></a><img src="/img/revistas/dyna/v79n172/a19fig02.gif">    <br>   Figure 2.</b> Failure average decrease, Baseline vs. Actual. Source: Own</font></p>     <p align="center"><font size="2" face="Verdana, Arial, Helvetica, sans-serif"><b><a name="tab03"></a>Table 3.</b> Descriptive statistics analysis of Failure Variation. Source: Own</font>    <br>   <img src="/img/revistas/dyna/v79n172/a19tab03.gif"></p>     <p><font size="2" face="Verdana, Arial, Helvetica, sans-serif"><b>4.2. Competitiveness Analysis    <br>   </b></font><font size="2" face="Verdana, Arial, Helvetica, sans-serif">In order to develop the competitiveness analysis, a sales correction is made with inflation as a macroeconomics variable. According to Garcia [12], in order to keep competitive, companies must growth a minimal rate, defined as minimal growth (MG) and it can be calculated as (8).</font></p>     <p><img src="/img/revistas/dyna/v79n172/a19eq08.gif"></p>     ]]></body>
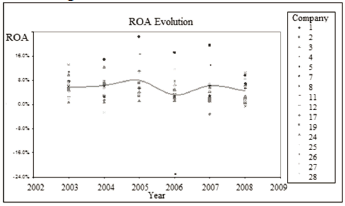
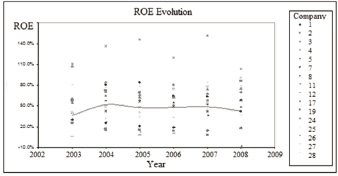
<body><![CDATA[<p><font size="2" face="Verdana, Arial, Helvetica, sans-serif">For 2010 year, Colombian economics data refers that this MG should be close to 5.6 %, because the expected inflation for this year will be between 2 y 4 % (Average 3 %), while GDP will be 2.5 % with the same expected increase at the end of the year of 2009.</font></p>     <p><font size="2" face="Verdana, Arial, Helvetica, sans-serif"><a href="#fig03">Figure 3</a> shows the behavior of the return on assets (ROA) for the period under study. Here, special cases are considered, as evidenced in the company 11, which gives a greater loss in 2006.</font></p>     <p align="center"><font size="2" face="Verdana, Arial, Helvetica, sans-serif"><b><a name="fig03"></a><img src="/img/revistas/dyna/v79n172/a19fig03.gif">    <br>   Figure 3.</b> ROA evolution. Source: Own </font></p>     <p><font size="2" face="Verdana, Arial, Helvetica, sans-serif">In <a href="#fig04">Figure 3</a>, average behavior (continued line) is calculated from general sum of data, not as direct average. This is made for not to do it weighted directly but corrected from sector reality. This analysis is reported at <a href="#tab04">Table 4</a>.</font></p>     <p align="center"><font size="2" face="Verdana, Arial, Helvetica, sans-serif"><b><a name="tab04"></a>Table 4.</b> ROA increase for 2003 to 2008. Source: Own</font>    <br>   <img src="/img/revistas/dyna/v79n172/a19tab04.gif"></p>     <p><font size="2" face="Verdana, Arial, Helvetica, sans-serif">Finally, Return of Equity behavior for the analyzed period and companies is shown in <a href="#fig04">figure 4</a>.</font></p>     <p align="center"><font size="2" face="Verdana, Arial, Helvetica, sans-serif"><b><a name="fig04"></a><img src="/img/revistas/dyna/v79n172/a19fig04.gif">    <br>   Figure 4.</b> ROE evolution. Source: Own </font></p>     ]]></body>
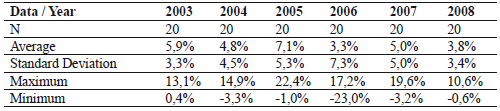
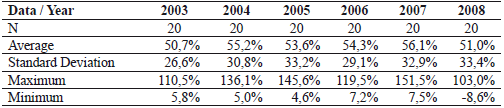
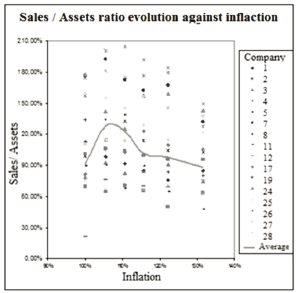
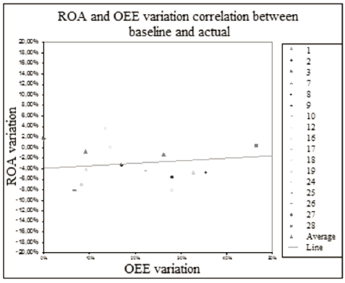
<body><![CDATA[<p><font size="2" face="Verdana, Arial, Helvetica, sans-serif"><a href="#tab05">Table 5</a> shows the behavior in a statistical way for the studied period. For efficiency comparison, the relation between net sales and total assets is used. This relation must consider the inflation affection in order to correct the effect that this can cause in sales, as shown in <a href="#fig05">figure 5</a>.</font></p>     <p align="center"><font size="2" face="Verdana, Arial, Helvetica, sans-serif"><b><a name="tab05"></a>Table 5.</b> ROE increase for 2003 to 2008. Source: Own</font>    <br>   <img src="/img/revistas/dyna/v79n172/a19tab05.gif"></p>     <p align="center"><font size="2" face="Verdana, Arial, Helvetica, sans-serif"><b><a name="fig05"></a><img src="/img/revistas/dyna/v79n172/a19fig05.gif">    <br>   Figure 5. </b>Sales / Assets relation evolution against inflation. Source: Own</font></p>     <p><font size="2" face="Verdana, Arial, Helvetica, sans-serif">Data description for information of Sales / Assets relation against inflation is presented in <a href="#tab06">Table 6</a>.</font></p>     <p align="center"><font size="2" face="Verdana, Arial, Helvetica, sans-serif"><b><a name="tab06"></a>Table 6.</b> Sales / Assets ratio against inflation. Source: Own</font>    <br>   <img src="/img/revistas/dyna/v79n172/a19tab06.gif"></p>     <p><font size="2" face="Verdana, Arial, Helvetica, sans-serif"><b>4.3 Productivity and competitiveness ratios    <br>   </b>In order to make a comparison between productivity and competitiveness indexes, an analysis is made considering ROA and OEE at baseline versus the actual values, independent of implementation advance level as corporative strategies, which obviously had an impact on Business results. This correlation is shown in <a href="#fig06">figure 6</a>.</font></p>     ]]></body>
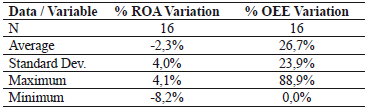
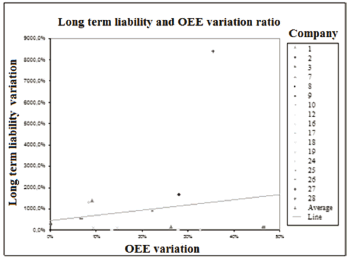
<body><![CDATA[<p align="center"><font size="2" face="Verdana, Arial, Helvetica, sans-serif"><b><a name="fig06"></a><img src="/img/revistas/dyna/v79n172/a19fig06.gif">    <br>   Figure 6.</b> ROA and OEE variation correlation between baseline and actual. Source: own</font></p>     <p><font size="2" face="Verdana, Arial, Helvetica, sans-serif">Descriptive statistical analysis for ROA vs. OEE ratios is summarized in <a href="#tab07">Table 7</a>.</font></p>     <p align="center"><font size="2" face="Verdana, Arial, Helvetica, sans-serif"><b><a name="tab07"></a>Table 7.</b> ROA vs. OEE variations</font>    <br>   <img src="/img/revistas/dyna/v79n172/a19tab07.gif"></p>     <p><font size="2" face="Verdana, Arial, Helvetica, sans-serif"><a href="#fig07">Figure 7</a> shows the correlation between Long term liability and OEE variation. The statistical information is shown in <a href="#tab08">Table 8</a>.</font></p>     <p align="center"><font size="2" face="Verdana, Arial, Helvetica, sans-serif"><b><a name="fig07"></a><img src="/img/revistas/dyna/v79n172/a19fig07.gif">    <br>   Figure7.</b> Long term liability and OEE variation relation. Source: Own</font></p>     <p align="center"><font size="2" face="Verdana, Arial, Helvetica, sans-serif"><b><a name="tab08"></a>Table 8.</b> Long term liability and OEE variation relation. Source: Own</font>    <br>   <img src="/img/revistas/dyna/v79n172/a19tab08.gif"></p>     ]]></body>
<body><![CDATA[<p>&nbsp;</p>     <p><font size="3" face="Verdana, Arial, Helvetica, sans-serif"><b>5. DISCUSSION </b></font></p>     <p><font size="2" face="Verdana, Arial, Helvetica, sans-serif">While manufacturing industry results showed an improvement in recent years, the companies in this study experimented a destruction of money value as a result of their corporate and competitive strategies. This is explained by reviewing the company's growth data in the period analyzed (162 %), against minimum cumulative growth (97 %) and inflation (132 %), which is higher. However verifying the industry ROA variation, it has grown only an average of 126%, value that is below inflation and over the minimal growth. This growth value, with its variations and current average, evidences that it is out of control of companies. This affirmation is confirmed by the calculation of Cpk with the minimum growth as lower limit, with an average score of 0.32 for the period studied (A control relation has a Cpk greater than 1 or even greater than 1.33). </font></p>     <p><font size="2" face="Verdana, Arial, Helvetica, sans-serif">Profitability ratios, ROA and ROE, show a relatively stability throughout the period of evaluation. In the first instance, the ROA shows a very low average value, almost below the required values by shareholders, with a value of 4.5 % on average (overall summations). With respect to the way of how OEE may have impacted this indicator, it is not possible to establish effective evidence, because the correlation coefficient is 0.26 % and the significant increases of OEEshowed an average of 29 %. </font></p>     <p><font size="2" face="Verdana, Arial, Helvetica, sans-serif">Secondly, ROE, with an average of 42.3 % (General summations), evidenced a stability in the analyzed years, suggesting that it has not been necessary a capital injection due to financial funding, regardless that the relationship of this indicator with the OEE is only -0.10, the ratio with OEE variation of -0.40 and an increase of 151 % of total liabilities and an increase of 1169 % of long term liabilities. It suggests that the impact of the OEE in companies is not strong enough to lower costs, reduce investment (because this has been executed as long-term passive) or increase throughput.</font></p>     <p>&nbsp;</p>     <p><font size="3" face="Verdana, Arial, Helvetica, sans-serif"><b>6. CONCLUSIONS</b></font></p>     <p><font size="2" face="Verdana, Arial, Helvetica, sans-serif">The results show that there is no effective correlation between the positive impacts of TPM methodology in major productivity indicators, such as OEE, failure decrease and throughput increasing, or in the different ratios of profitability, efficiency and debt.</font></p>     <p><font size="2" face="Verdana, Arial, Helvetica, sans-serif">While organizations have achieved to increase its sales in recent years, they have not been able to convert these increases in evidence of improvements in the ROA or ROE indicators. ROA increment, regardless of global economic crisis, at least have remained positive, but there is no evidence that there is a clear relation between this behavior and what was evidenced at productivity indicators.</font></p>     <p><font size="2" face="Verdana, Arial, Helvetica, sans-serif">Business effectiveness, which has fallen in recent years, does not provide a real benefit gained from increased productivity, since sales, as part of the assets ratio, has fallen. it suggest a greater need for technological renovations in companies, that in the middle of product cycles, much lower today, they cannot survive only with the same machinery, It does no matter that this machinery has a better usage. This statement is made with the understanding that several companies in the study belong to high turnover and technological dependence sectors.</font></p>     ]]></body>
<body><![CDATA[<p><font size="2" face="Verdana, Arial, Helvetica, sans-serif">Much of this technology renovation has been done with long-term funding by these organizations. It can damage the sustainable growth of these organizations if there is no effective impact on ROA. This is why the industry must continue working in the competitive components, with a severe work on reducing costs and trying to create or improve customer value.</font></p>     <p><font size="2" face="Verdana, Arial, Helvetica, sans-serif">TPM should try to focus their approach not only in overall productivity or global company OEE, but also in the support of productivity initiatives, products, processes and services growth. This way, TPM approach should focus on increasing capacity and facing innovation processes, and not only in maintenance.</font></p>     <p><font size="2" face="Verdana, Arial, Helvetica, sans-serif">Finally, companies should focus their efforts widely to minimize start-up curves of research and development (R&amp;D) processes, so TPM pillars as initial Control (early management), education and Training, focused improvement, autonomous maintenance and planned maintenance, should redirect their efforts towards this components, looking for achieve a positive impact in the results of companies.</font></p>     <p>&nbsp;</p>     <p><font size="3" face="Verdana, Arial, Helvetica, sans-serif"><b>REFERENCES</b></font></p>     <!-- ref --><p><font size="2" face="Verdana, Arial, Helvetica, sans-serif"><b>[1]</b> Grinchnik, K. Et. al., La Nueva Era de la Manufactura. M&eacute;xico: McGraw-Hill, Ed. 1, 2009.     &nbsp;&nbsp;&nbsp;&nbsp;&nbsp;&nbsp;&nbsp;&nbsp;[&#160;<a href="javascript:void(0);" onclick="javascript: window.open('/scielo.php?script=sci_nlinks&ref=000118&pid=S0012-7353201200020001900001&lng=','','width=640,height=500,resizable=yes,scrollbars=1,menubar=yes,');">Links</a>&#160;]<!-- end-ref --><!-- ref --><br>   <b>[2]</b> Wiremann, T., Benchmarking best practices in Maintenance Management. New York: Industrial Press, Ed. 1, 2004.     &nbsp;&nbsp;&nbsp;&nbsp;&nbsp;&nbsp;&nbsp;&nbsp;[&#160;<a href="javascript:void(0);" onclick="javascript: window.open('/scielo.php?script=sci_nlinks&ref=000119&pid=S0012-7353201200020001900002&lng=','','width=640,height=500,resizable=yes,scrollbars=1,menubar=yes,');">Links</a>&#160;]<!-- end-ref --><!-- ref --><br>   <b>[3]</b> Consejo Privado de Competitividad – Compes. Informe Nacional de Competitividad 2008-2009. Bogot&aacute;, 2008.     &nbsp;&nbsp;&nbsp;&nbsp;&nbsp;&nbsp;&nbsp;&nbsp;[&#160;<a href="javascript:void(0);" onclick="javascript: window.open('/scielo.php?script=sci_nlinks&ref=000120&pid=S0012-7353201200020001900003&lng=','','width=640,height=500,resizable=yes,scrollbars=1,menubar=yes,');">Links</a>&#160;]<!-- end-ref --><!-- ref --><br>   <b>[4]</b> DANE - Departamento Administrativo Nacional de Estad&iacute;stica. Producto Interno Bruto trimestral por ramas de actividad econ&oacute;micas a precios constantes 2009. [en l&iacute;nea]. [Fecha de consulta: 15 de Mayo del 2010]</b> Disponible en:   <a href="http://www.dane.gov.co/index.php?option=com_content&task=category&sectionid=33&id=58&Itemid=240" target="referencia">www.dane.gov.co/index.php?option=com_content&amp;task=category&amp;sectionid=33&amp;id=58&amp;Itemid=240</a>       &nbsp;&nbsp;&nbsp;&nbsp;&nbsp;&nbsp;&nbsp;&nbsp;[&#160;<a href="javascript:void(0);" onclick="javascript: window.open('/scielo.php?script=sci_nlinks&ref=000121&pid=S0012-7353201200020001900004&lng=','','width=640,height=500,resizable=yes,scrollbars=1,menubar=yes,');">Links</a>&#160;]<!-- end-ref --><!-- ref --><br>   <b>[5]</b> DANE - Departamento Administrativo Nacional de Estad&iacute;stica. Variables Principales seg&uacute;n &aacute;reas metropolitanas, Bogota D.C. y grupos industriales Total Nacional 2007. [en l&iacute;nea]. [Fecha de consulta: 15 de Mayo del 2010]</b> Disponible en: <a href="http://www.dane.gov.co/daneweb_V09/index.php?option=com_content&view=article&id=53&Itemid=59" target="referencia">www.dane.gov.co/daneweb_V09/index.php?option=com_content&view=article&id=53&Itemid=59</a> Bogot&aacute;     &nbsp;&nbsp;&nbsp;&nbsp;&nbsp;&nbsp;&nbsp;&nbsp;[&#160;<a href="javascript:void(0);" onclick="javascript: window.open('/scielo.php?script=sci_nlinks&ref=000122&pid=S0012-7353201200020001900005&lng=','','width=640,height=500,resizable=yes,scrollbars=1,menubar=yes,');">Links</a>&#160;]<!-- end-ref --><!-- ref --><br>   <b>[6]</b> Brah, S. and Chong, W., Relationship between total productive maintenance and performance. Singapur: En: Journal of Production Reserch, V42 N12, 2006.     &nbsp;&nbsp;&nbsp;&nbsp;&nbsp;&nbsp;&nbsp;&nbsp;[&#160;<a href="javascript:void(0);" onclick="javascript: window.open('/scielo.php?script=sci_nlinks&ref=000123&pid=S0012-7353201200020001900006&lng=','','width=640,height=500,resizable=yes,scrollbars=1,menubar=yes,');">Links</a>&#160;]<!-- end-ref --><!-- ref --><br>   <b>[7]</b> Seth, D. and Deepak, T., A Critical Study of TQM and TPM Approaches on Business Performance of Indian Manufacturing Industry. Mumbia: En: Total Quality Management, V17 N7, 2006.     &nbsp;&nbsp;&nbsp;&nbsp;&nbsp;&nbsp;&nbsp;&nbsp;[&#160;<a href="javascript:void(0);" onclick="javascript: window.open('/scielo.php?script=sci_nlinks&ref=000124&pid=S0012-7353201200020001900007&lng=','','width=640,height=500,resizable=yes,scrollbars=1,menubar=yes,');">Links</a>&#160;]<!-- end-ref --><!-- ref --><br>   <b>[8]</b> Witt, C., TPM As Foundation of Lean. En: Material Handling Management. 2006.     &nbsp;&nbsp;&nbsp;&nbsp;&nbsp;&nbsp;&nbsp;&nbsp;[&#160;<a href="javascript:void(0);" onclick="javascript: window.open('/scielo.php?script=sci_nlinks&ref=000125&pid=S0012-7353201200020001900008&lng=','','width=640,height=500,resizable=yes,scrollbars=1,menubar=yes,');">Links</a>&#160;]<!-- end-ref --><!-- ref --><br>   <b>[9]</b> Rubrich, L. and Watson, M., Implementing WCM. Fort Wayne: WCM Associates, Ed. 1, 1998.     &nbsp;&nbsp;&nbsp;&nbsp;&nbsp;&nbsp;&nbsp;&nbsp;[&#160;<a href="javascript:void(0);" onclick="javascript: window.open('/scielo.php?script=sci_nlinks&ref=000126&pid=S0012-7353201200020001900009&lng=','','width=640,height=500,resizable=yes,scrollbars=1,menubar=yes,');">Links</a>&#160;]<!-- end-ref --><!-- ref --><br>   <b>[10]</b> Farsijani, H., World Class Manufacturing: Techniques for Implementation for Small & Medium Sized Enterprises. Bradford: En: Managing Virtual Enterprises. 1996.     &nbsp;&nbsp;&nbsp;&nbsp;&nbsp;&nbsp;&nbsp;&nbsp;[&#160;<a href="javascript:void(0);" onclick="javascript: window.open('/scielo.php?script=sci_nlinks&ref=000127&pid=S0012-7353201200020001900010&lng=','','width=640,height=500,resizable=yes,scrollbars=1,menubar=yes,');">Links</a>&#160;]<!-- end-ref --><!-- ref --><br>   <b>[11]</b> Brealey, R., Myers, S., and Marcus A., Fundamentals of Corporate Finance.McGraw-Hill Irwin.Boston, MA. 2001.     &nbsp;&nbsp;&nbsp;&nbsp;&nbsp;&nbsp;&nbsp;&nbsp;[&#160;<a href="javascript:void(0);" onclick="javascript: window.open('/scielo.php?script=sci_nlinks&ref=000128&pid=S0012-7353201200020001900011&lng=','','width=640,height=500,resizable=yes,scrollbars=1,menubar=yes,');">Links</a>&#160;]<!-- end-ref --><!-- ref --><br>   <b>[12]</b> Garcia, O., Administraci&oacute;n Financiera: Fundamentos y Aplicaciones. Medell&iacute;n: Oscar LeonGarcia, Ed. 3, 1999. </font>&nbsp;&nbsp;&nbsp;&nbsp;&nbsp;&nbsp;&nbsp;&nbsp;[&#160;<a href="javascript:void(0);" onclick="javascript: window.open('/scielo.php?script=sci_nlinks&ref=000129&pid=S0012-7353201200020001900012&lng=','','width=640,height=500,resizable=yes,scrollbars=1,menubar=yes,');">Links</a>&#160;]<!-- end-ref --> ]]></body><back>
<ref-list>
<ref id="B1">
<label>1</label><nlm-citation citation-type="book">
<person-group person-group-type="author">
<name>
<surname><![CDATA[Grinchnik]]></surname>
<given-names><![CDATA[K.]]></given-names>
</name>
</person-group>
<source><![CDATA[La Nueva Era de la Manufactura.]]></source>
<year>2009</year>
<edition>1</edition>
<publisher-name><![CDATA[McGraw-Hill]]></publisher-name>
</nlm-citation>
</ref>
<ref id="B2">
<label>2</label><nlm-citation citation-type="book">
<person-group person-group-type="author">
<name>
<surname><![CDATA[Wiremann]]></surname>
<given-names><![CDATA[T.]]></given-names>
</name>
</person-group>
<source><![CDATA[Benchmarking best practices in Maintenance Management.]]></source>
<year>2004</year>
<edition>1</edition>
<publisher-loc><![CDATA[New York ]]></publisher-loc>
<publisher-name><![CDATA[Industrial Press]]></publisher-name>
</nlm-citation>
</ref>
<ref id="B3">
<label>3</label><nlm-citation citation-type="">
<collab>Consejo Privado de Competitividad - Compes</collab>
<source><![CDATA[Informe Nacional de Competitividad 2008-2009.]]></source>
<year>2008</year>
<publisher-loc><![CDATA[Bogotá ]]></publisher-loc>
</nlm-citation>
</ref>
<ref id="B4">
<label>4</label><nlm-citation citation-type="">
<collab>DANE - Departamento Administrativo Nacional de Estadística.</collab>
<article-title xml:lang="es"><![CDATA[Producto Interno Bruto trimestral por ramas de actividad económicas a precios constantes 2009.]]></article-title>
<source><![CDATA[]]></source>
<year></year>
</nlm-citation>
</ref>
<ref id="B5">
<label>5</label><nlm-citation citation-type="">
<collab>DANE - Departamento Administrativo Nacional de Estadística.</collab>
<article-title xml:lang="es"><![CDATA[Variables Principales según áreas metropolitanas, Bogota D.C. y grupos industriales Total Nacional 2007.]]></article-title>
<source><![CDATA[]]></source>
<year></year>
</nlm-citation>
</ref>
<ref id="B6">
<label>6</label><nlm-citation citation-type="journal">
<person-group person-group-type="author">
<name>
<surname><![CDATA[Brah]]></surname>
<given-names><![CDATA[S.]]></given-names>
</name>
<name>
<surname><![CDATA[Chong]]></surname>
<given-names><![CDATA[W.]]></given-names>
</name>
</person-group>
<article-title xml:lang="en"><![CDATA[Relationship between total productive maintenance and performance. Singapur]]></article-title>
<source><![CDATA[Journal of Production Reserch]]></source>
<year>2006</year>
<volume>42</volume>
<numero>12</numero>
<issue>12</issue>
</nlm-citation>
</ref>
<ref id="B7">
<label>7</label><nlm-citation citation-type="journal">
<person-group person-group-type="author">
<name>
<surname><![CDATA[Seth]]></surname>
<given-names><![CDATA[D.]]></given-names>
</name>
<name>
<surname><![CDATA[Deepak]]></surname>
<given-names><![CDATA[T.]]></given-names>
</name>
</person-group>
<article-title xml:lang="en"><![CDATA[A Critical Study of TQM and TPM Approaches on Business Performance of Indian Manufacturing Industry. Mumbia]]></article-title>
<source><![CDATA[Total Quality Management]]></source>
<year>2006</year>
<volume>17</volume>
<numero>7</numero>
<issue>7</issue>
</nlm-citation>
</ref>
<ref id="B8">
<label>8</label><nlm-citation citation-type="book">
<person-group person-group-type="author">
<name>
<surname><![CDATA[Witt]]></surname>
<given-names><![CDATA[C.]]></given-names>
</name>
</person-group>
<source><![CDATA[TPM As Foundation of Lean.]]></source>
<year>2006</year>
<publisher-name><![CDATA[Material Handling Management]]></publisher-name>
</nlm-citation>
</ref>
<ref id="B9">
<label>9</label><nlm-citation citation-type="">
<person-group person-group-type="author">
<name>
<surname><![CDATA[Rubrich]]></surname>
<given-names><![CDATA[L.]]></given-names>
</name>
<name>
<surname><![CDATA[Watson]]></surname>
<given-names><![CDATA[M.]]></given-names>
</name>
</person-group>
<source><![CDATA[Implementing WCM. Fort Wayne: WCM Associates]]></source>
<year>1998</year>
<edition>Ed. 1</edition>
</nlm-citation>
</ref>
<ref id="B10">
<label>10</label><nlm-citation citation-type="">
<person-group person-group-type="author">
<name>
<surname><![CDATA[Farsijani]]></surname>
<given-names><![CDATA[H.]]></given-names>
</name>
</person-group>
<article-title xml:lang="en"><![CDATA[World Class Manufacturing: Techniques for Implementation for Small & Medium Sized Enterprises. Bradford]]></article-title>
<source><![CDATA[Managing Virtual Enterprises.]]></source>
<year>1996</year>
</nlm-citation>
</ref>
<ref id="B11">
<label>11</label><nlm-citation citation-type="book">
<person-group person-group-type="author">
<name>
<surname><![CDATA[Brealey]]></surname>
<given-names><![CDATA[R.]]></given-names>
</name>
<name>
<surname><![CDATA[Myers]]></surname>
<given-names><![CDATA[S.]]></given-names>
</name>
<name>
<surname><![CDATA[Marcus]]></surname>
<given-names><![CDATA[A.]]></given-names>
</name>
</person-group>
<source><![CDATA[Fundamentals of Corporate Finance.]]></source>
<year>2001</year>
<publisher-loc><![CDATA[Boston^eMA MA]]></publisher-loc>
<publisher-name><![CDATA[McGraw-Hill Irwin]]></publisher-name>
</nlm-citation>
</ref>
<ref id="B12">
<label>12</label><nlm-citation citation-type="book">
<person-group person-group-type="author">
<name>
<surname><![CDATA[Garcia]]></surname>
<given-names><![CDATA[O.]]></given-names>
</name>
</person-group>
<source><![CDATA[Administración Financiera: Fundamentos y Aplicaciones.]]></source>
<year>1999</year>
<edition>Ed. 3</edition>
<publisher-loc><![CDATA[Medellín ]]></publisher-loc>
<publisher-name><![CDATA[Oscar Leon Garcia]]></publisher-name>
</nlm-citation>
</ref>
</ref-list>
</back>
</article>