<?xml version="1.0" encoding="ISO-8859-1"?><article xmlns:mml="http://www.w3.org/1998/Math/MathML" xmlns:xlink="http://www.w3.org/1999/xlink" xmlns:xsi="http://www.w3.org/2001/XMLSchema-instance">
<front>
<journal-meta>
<journal-id>0012-7353</journal-id>
<journal-title><![CDATA[DYNA]]></journal-title>
<abbrev-journal-title><![CDATA[Dyna rev.fac.nac.minas]]></abbrev-journal-title>
<issn>0012-7353</issn>
<publisher>
<publisher-name><![CDATA[Universidad Nacional de Colombia]]></publisher-name>
</publisher>
</journal-meta>
<article-meta>
<article-id>S0012-73532015000400010</article-id>
<article-id pub-id-type="doi">10.15446/dyna.v82n192.48580</article-id>
<title-group>
<article-title xml:lang="en"><![CDATA[Spinning reserve analysis in a microgrid]]></article-title>
<article-title xml:lang="es"><![CDATA[Análisis de reserva rodante en una microred]]></article-title>
</title-group>
<contrib-group>
<contrib contrib-type="author">
<name>
<surname><![CDATA[Luna-Ramírez]]></surname>
<given-names><![CDATA[Luis Ernesto]]></given-names>
</name>
<xref ref-type="aff" rid="A01"/>
</contrib>
<contrib contrib-type="author">
<name>
<surname><![CDATA[Torres-Sánchez]]></surname>
<given-names><![CDATA[Horacio]]></given-names>
</name>
<xref ref-type="aff" rid="A02"/>
</contrib>
<contrib contrib-type="author">
<name>
<surname><![CDATA[Pavas-Martínez]]></surname>
<given-names><![CDATA[Fabio Andrés]]></given-names>
</name>
<xref ref-type="aff" rid="A03"/>
</contrib>
</contrib-group>
<aff id="A01">
<institution><![CDATA[,Universidad Nacional de Colombia Programa de Investigación Adquisición y Análisis de Señales PAAS ]]></institution>
<addr-line><![CDATA[Bogotá ]]></addr-line>
<country>Colombia</country>
</aff>
<aff id="A02">
<institution><![CDATA[,Universidad Nacional de Colombia Programa de Investigación Adquisición y Análisis de Señales PAAS ]]></institution>
<addr-line><![CDATA[Bogotá ]]></addr-line>
<country>Colombia</country>
</aff>
<aff id="A03">
<institution><![CDATA[,Universidad Nacional de Colombia Programa de Investigación Adquisición y Análisis de Señales PAAS ]]></institution>
<addr-line><![CDATA[Bogotá ]]></addr-line>
<country>Colombia</country>
</aff>
<pub-date pub-type="pub">
<day>00</day>
<month>08</month>
<year>2015</year>
</pub-date>
<pub-date pub-type="epub">
<day>00</day>
<month>08</month>
<year>2015</year>
</pub-date>
<volume>82</volume>
<numero>192</numero>
<fpage>85</fpage>
<lpage>93</lpage>
<copyright-statement/>
<copyright-year/>
<self-uri xlink:href="http://www.scielo.org.co/scielo.php?script=sci_arttext&amp;pid=S0012-73532015000400010&amp;lng=en&amp;nrm=iso"></self-uri><self-uri xlink:href="http://www.scielo.org.co/scielo.php?script=sci_abstract&amp;pid=S0012-73532015000400010&amp;lng=en&amp;nrm=iso"></self-uri><self-uri xlink:href="http://www.scielo.org.co/scielo.php?script=sci_pdf&amp;pid=S0012-73532015000400010&amp;lng=en&amp;nrm=iso"></self-uri><abstract abstract-type="short" xml:lang="en"><p><![CDATA[This paper proposes a methodology to model and analyze the security scheme required by a microgrid that considers the participation of renewable energy sources. This security scheme is represented by an up and down spinning reserve, which allows to drive the system frequency to a steady state after the occurrence of events associated not only to forecast errors in the electricity demand (as traditional schemes do), but also to forecast errors in the power availability of the intermittent energy sources. The proposed methodology was implemented on a real microgrid that considers the interconnection of a photovoltaic generator. From this, it was concluded that the security scheme designed for the microgrid efficiently ensured the relation between generation and demand, at each study hour.]]></p></abstract>
<abstract abstract-type="short" xml:lang="es"><p><![CDATA[Este artículo propone una metodología para modelar y analizar el esquema de seguridad requerido por una microred que considera la participación de fuentes renovables de energía. Este esquema de seguridad está representado por una reserva rodante hacia arriba y hacia abajo, la cual permite llevar la frecuencia del sistema a un estado estable después de la ocurrencia de eventos asociados no sólo a errores en el pronóstico de la demanda (tal como lo hacen los esquemas tradicionales), sino también a errores en el pronóstico de la disponibilidad de potencia de las fuentes intermitentes de energía. La metodología propuesta se implementó en una microred real que considera la interconexión de un generador fotovoltaico. A partir de ello, se concluyó que el esquema de seguridad diseñado para la microred garantizó eficientemente la relación entre generación y demanda, para cada hora de análisis.]]></p></abstract>
<kwd-group>
<kwd lng="en"><![CDATA[microgrid]]></kwd>
<kwd lng="en"><![CDATA[security scheme]]></kwd>
<kwd lng="en"><![CDATA[spinning reserve]]></kwd>
<kwd lng="en"><![CDATA[photovoltaic generation]]></kwd>
<kwd lng="en"><![CDATA[forecasting techniques]]></kwd>
<kwd lng="es"><![CDATA[microred]]></kwd>
<kwd lng="es"><![CDATA[esquema de seguridad]]></kwd>
<kwd lng="es"><![CDATA[reserva rodante]]></kwd>
<kwd lng="es"><![CDATA[generación fotovoltaica]]></kwd>
<kwd lng="es"><![CDATA[técnicas de pronóstico]]></kwd>
</kwd-group>
</article-meta>
</front><body><![CDATA[ <p><font size="1" face="Verdana, Arial, Helvetica, sans-serif"><b>DOI:</b> <a href="http://dx.doi.org/10.15446/dyna.v82n192.48580" target="_blank">http://dx.doi.org/10.15446/dyna.v82n192.48580</a></font></p>     <p align="center"><font size="4" face="Verdana, Arial, Helvetica, sans-serif"><b>Spinning reserve analysis in a microgrid</b></font></p>     <p align="center"><i><b><font size="3" face="Verdana, Arial, Helvetica, sans-serif">An&aacute;lisis de reserva rodante en una   microred</font></b></i></p>     <p align="center"> </p>     <p align="center"><b><font size="2" face="Verdana, Arial, Helvetica, sans-serif">Luis Ernesto Luna-Ram&iacute;rez <i><sup>a</sup></i>,   Horacio Torres-S&aacute;nchez <i><sup>b</sup></i> &amp; Fabio Andr&eacute;s Pavas-Mart&iacute;nez <i><sup>c</sup></i></font></b><font size="2" face="Verdana, Arial, Helvetica, sans-serif"></font></p>     <p align="center"> </p>     <p align="center"><font size="2" face="Verdana, Arial, Helvetica, sans-serif"><sup><i>a</i></sup><i> Programa de Investigaci&oacute;n Adquisici&oacute;n y An&aacute;lisis de Se&ntilde;ales   PAAS, Universidad Nacional de Colombia, Bogot&aacute;, Colombia. <a href="mailto:lelunar@unal.edu.co">lelunar@unal.edu.co</a>    <br>   <sup>b</sup> Programa de Investigaci&oacute;n Adquisici&oacute;n y An&aacute;lisis de Se&ntilde;ales PAAS, Universidad Nacional de Colombia, Bogot&aacute;,   Colombia. <a href="mailto:htorress@unal.edu.co">htorress@unal.edu.co</a>    <br>   <sup>c </sup>Programa de Investigaci&oacute;n Adquisici&oacute;n y An&aacute;lisis de Se&ntilde;ales PAAS,   Universidad Nacional de Colombia, Bogot&aacute;, Colombia. <a href="mailto:fapavasm@unal.edu.co">fapavasm@unal.edu.co</a></i></font></p>     <p align="center"> </p>     ]]></body>
<body><![CDATA[<p align="center"><font size="2" face="Verdana, Arial, Helvetica, sans-serif"><b>Received: April 29<sup>th</sup>,   2014. Received in revised form: February 19<sup>th</sup>, 2015. Accepted: June   16<sup>th</sup>, 2015.</b></font></p>     <p align="center"> </p>     <p align="center"><font size="1" face="Verdana, Arial, Helvetica, sans-seriff"><b>This work is licensed under a</b> <a rel="license" href="http://creativecommons.org/licenses/by-nc-nd/4.0/">Creative Commons Attribution-NonCommercial-NoDerivatives 4.0 International License</a>.</font><br />   <a rel="license" href="http://creativecommons.org/licenses/by-nc-nd/4.0/"><img style="border-width:0" src="https://i.creativecommons.org/l/by-nc-nd/4.0/88x31.png" /></a></p> <hr>     <p><font size="2" face="Verdana, Arial, Helvetica, sans-serif"><b>Abstract    <br>   </b></font><font size="2" face="Verdana, Arial, Helvetica, sans-serif">This paper proposes a methodology to model and analyze   the security scheme required by a microgrid that considers the participation of   renewable energy sources. This security scheme is represented by an up and down   spinning reserve, which allows to drive the system frequency to a steady state   after the occurrence of events associated not only to forecast errors in the   electricity demand (as traditional schemes do), but also to forecast errors in   the power availability of the intermittent energy sources. The proposed   methodology was implemented on a real microgrid that considers the   interconnection of a photovoltaic generator. From this, it was concluded that   the security scheme designed for the microgrid efficiently ensured the relation   between generation and demand, at each study hour.</font></p>     <p><font size="2" face="Verdana, Arial, Helvetica, sans-serif"><i>Keywords</i>: microgrid; security scheme; spinning   reserve; photovoltaic generation; forecasting techniques.</font></p>     <p><font size="2" face="Verdana, Arial, Helvetica, sans-serif"><b>Resumen    <br>   </b></font><font size="2" face="Verdana, Arial, Helvetica, sans-serif">Este art&iacute;culo propone una metodolog&iacute;a para   modelar y analizar el esquema de seguridad requerido por una microred que   considera la participaci&oacute;n de fuentes renovables de energ&iacute;a. Este esquema de   seguridad est&aacute; representado por una reserva rodante hacia arriba y hacia abajo,   la cual permite llevar la frecuencia del sistema a un estado estable despu&eacute;s de   la ocurrencia de eventos asociados no s&oacute;lo a errores en el pron&oacute;stico de la   demanda (tal como lo hacen los esquemas tradicionales), sino tambi&eacute;n a errores   en el pron&oacute;stico de la disponibilidad de potencia de las fuentes intermitentes   de energ&iacute;a. La metodolog&iacute;a propuesta se implement&oacute; en una microred real que   considera la interconexi&oacute;n de un generador fotovoltaico. A partir de ello, se   concluy&oacute; que el esquema de seguridad dise&ntilde;ado para la microred garantiz&oacute;   eficientemente la relaci&oacute;n entre generaci&oacute;n y demanda, para cada hora de   an&aacute;lisis.</font></p>     <p><font size="2" face="Verdana, Arial, Helvetica, sans-serif"><i>Palabras clave</i>:   microred; esquema de seguridad; reserva rodante; generaci&oacute;n fotovoltaica;   t&eacute;cnicas de pron&oacute;stico.</font></p> <hr>     <p> </p>     ]]></body>
<body><![CDATA[<p><b><font size="3" face="Verdana, Arial, Helvetica, sans-serif">1. Introduction</font></b></p>     <p><font size="2" face="Verdana, Arial, Helvetica, sans-serif">In recent years, the electricity sector has experienced   significant changes due to the introduction of a business oriented market   structure. Such structure pretends to achieve higher efficiencies in the   electricity supply, i.e. prices that reflect efficient costs and ensure the   fulfillment of the quality, reliability and security criteria.</font></p>     <p><font size="2" face="Verdana, Arial, Helvetica, sans-serif">The advances achieved in the electricity sector, along   with the high levels of demand growth and the concerns over the management of   non-sustainable energy resources have led to the implementation of new   generation technology alternatives. These new technologies consider a rational   and efficient use of the energy, in such a manner that they have a minimal   impact on the environment and contribute to ensure energy availability for   future generations. In addition, the development of these technologies (usually   of small scale) becomes important again with the installation of power plants   near to the consumption centers, this time with the power system backup. This   is an alternative of high penetration in the electricity sector and is commonly   known as Distributed Generation (DG) &#91;1&#93;.</font></p>     <p><font size="2" face="Verdana, Arial, Helvetica, sans-serif">The integration of DG within electrical systems and the   incentive to optimize energy resources has gained strength in the last years.   Accordingly, some countries have adjusted their regulatory policies in order to   encourage the DG participation in the electrical systems &#91;2&#93;.</font></p>     <p><font size="2" face="Verdana, Arial, Helvetica, sans-serif">Certainly, these regulatory policies have allowed an   increase in the DG participation in the electricity basket. The increase of the   DG penetration, the presence of multiple nearby sources, the implementation of   demand response programs and the continued evolution of distribution networks   into smart grids have led to the concept of microgrids &#91;3&#93;. A microgrid is an   active distribution network that considers the coordinated operation and   control of DG sources together with storage devices and controllable loads &#91;4&#93;.</font></p>     <p><font size="2" face="Verdana, Arial, Helvetica, sans-serif">According to IEEE 1547-4 &#91;5&#93;, microgrids are expected to satisfy   the security requirements that allow these grids to operate in a secure way for   any unexpected power requirement. In most   cases, this security scheme is represented by a spinning reserve. This reserve   represents one of the most important economic dispatch constraints in a   microgrid, because it allows the system frequency to be driven to a   steady state after the occurrence of an event &#91;6-8&#93;.</font></p>     <p><font size="2" face="Verdana, Arial, Helvetica, sans-serif">Microgrids consider the participation of Renewable Energy   Sources (RESs), such as Photovoltaic Generators (PVGs) and Wind Generators   (WGs). The power output of the RESs behaves intermittently due to the variable   nature of their primary resources (solar radiation and temperature for PVGs,   and wind velocity for WGs), and they may even cause security problems in the microgrid.   Therefore, it is necessary to design a security scheme for the microgrid, which   can respond not only to the statistical forecast errors in the electricity   demand (as traditional schemes do), but also to the statistical forecast errors   in the power availability of the RESs &#91;9-11&#93;.</font></p>     <p><font size="2" face="Verdana, Arial, Helvetica, sans-serif">The usual practice is to minimize these statistical errors   by means of appropriate forecasting techniques in order to reduce the   implementation costs of a microgrid security scheme &#91;12&#93;.</font></p>     <p><font size="2" face="Verdana, Arial, Helvetica, sans-serif">There are different forecasting techniques to analyze time   series. The technique based on structural models is one of the most interesting   tools to forecast the hourly behavior of the electricity demand and the primary   resources of the intermittent energy sources. This technique represents a   widely accepted manner to model these kinds of time series of high density or   frequency, seasonal and highly stochastic &#91;13&#93;.</font></p>     <p><font size="2" face="Verdana, Arial, Helvetica, sans-serif">This paper proposes a novel security scheme that considers   the intermittency of the RESs. In section 2, a methodology is proposed to   quantify and analyze the up and down spinning reserve level required by a   microgrid to satisfy the security requirements demanded by this type of grid.   In section 3, the microgrid is described in which the proposed methodology is   applied. In section 4, the methodology implementation is presented in the   microgrid and also the results of this implementation are discussed. Finally,   the conclusions are shown in section 5.</font></p>     ]]></body>
<body><![CDATA[<p> </p>     <p><font size="3" face="Verdana, Arial, Helvetica, sans-serif"><b>2. Proposed methodology</b></font></p>     <p><font size="2" face="Verdana, Arial, Helvetica, sans-serif">The proposed methodology allows the security scheme required   by a microgrid that considers the participation of intermittent energy sources to   be modeled. The security scheme is represented by an up and down spinning   reserve located in the generators of the microgrid with controllable power   output.</font></p>     <p><font size="2" face="Verdana, Arial, Helvetica, sans-serif">The methodology consists of performing a four stage   analysis at each study hour of the next day. In the first stage a generation   analysis is performed, evaluating the uncertainty in the forecast power   availability of the RESs. A demand analysis is carried out at the second stage,   which evaluates the uncertainty in the forecast electricity demand. The third   stage consists of a net demand analysis, which quantifies and evaluates the up   and down spinning reserve required by the microgrid. This reserve ensures the   relation between generation and demand after the occurrence of events   associated with forecast errors in both the electricity demand and the power   availability of the RESs. At the fourth stage a validation analysis is   performed, that verifies the proper sizing of the up and down spinning reserve.</font></p>     <p><font size="2" face="Verdana, Arial, Helvetica, sans-serif">The demand and the power availability of the intermittent   energy sources are forecast using the statistical software OxMetrics 6.3 -   module STAMP (Structural Time Series Analyser, Modeller and Predictor) and the   time series technique based on structural models.</font></p>     <p><font size="2" face="Verdana, Arial, Helvetica, sans-serif">The next steps implement the methodology:</font></p>     <p><font size="2" face="Verdana, Arial, Helvetica, sans-serif"><b><i>2.1. Generation analysis</i></b></font></p>     <p><font size="2" face="Verdana, Arial, Helvetica, sans-serif">1. Acquiring and managing the hourly historical information of the primary   resources (solar radiation and temperature for PVGs, and wind velocity for WGs)   in the area where the RES is located.</font></p>     <p><font size="2" face="Verdana, Arial, Helvetica, sans-serif">2. Forecasting the behavior of the primary resources, at each study hour of   the next day.</font></p>     <p><font size="2" face="Verdana, Arial, Helvetica, sans-serif">3. Identifying the up and down standard deviation (statistical error) in the   forecast primary resources, at each study hour of the next day.</font></p>     ]]></body>
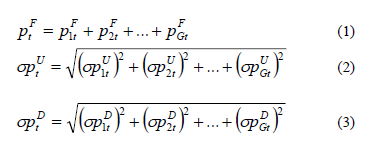
<body><![CDATA[<p><font size="2" face="Verdana, Arial, Helvetica, sans-serif">4. Developing the mathematical model of the RES. This model has as input   variables the primary resources, and it has as an output variable the AC power   availability. </font></p>     <p><font size="2" face="Verdana, Arial, Helvetica, sans-serif">5. Acquiring the technical parameters of the RES interconnected to the   microgrid.</font></p>     <p><font size="2" face="Verdana, Arial, Helvetica, sans-serif">6. Forecasting the behavior of the power availability of the RES, at each   study hour of the next day (<i>p<sup>F</sup><sub>gt</sub></i>). For this, it is   required that the forecast values of the primary resources are entered into the   mathematical model of the RES interconnected to the microgrid.</font></p>     <p><font size="2" face="Verdana, Arial, Helvetica, sans-serif">7. Calculating the up and down standard deviation in the forecast power   availability of the RES, at each study hour of the next day (<font face="Symbol">s</font><i>p<sup>U</sup><sub>gt</sub>, </i><font face="Symbol">s</font><i>p<sup>D</sup><sub>gt</sub></i>). For this, it is required that the   values of the up and down standard deviation bounds in the forecast primary   resources are entered into the mathematical model of the RES interconnected to   the microgrid.</font></p>     <p><font size="2" face="Verdana, Arial, Helvetica, sans-serif">8. If there is another RES interconnected to the microgrid, it is necessary   to go back to item 1. If there is not another RES, it is necessary to continue.</font></p>     <p><font size="2" face="Verdana, Arial, Helvetica, sans-serif">It is considered that the forecast power availability of   each RES is assumed to follow a normal distribution with expectation <i>p<sup>F</sup><sub>gt</sub></i> and standard deviation <font face="Symbol">s</font><i>p<sup>U</sup><sub>gt</sub>, </i><font face="Symbol">s</font><i>p<sup>D</sup><sub>gt</sub></i>.   Due to this condition, the forecast power availability of all the RESs grouped   also follow a normal distribution with the next parameters:</font></p>     <p><img src="/img/revistas/dyna/v82n192/v82n192a10eq0103.gif"></p>     <p><font size="2" face="Verdana, Arial, Helvetica, sans-serif">Where,</font></p>     <blockquote>       <p><font size="2" face="Verdana, Arial, Helvetica, sans-serif"><i>G</i>: Total number of RES interconnected to the microgrid.    ]]></body>
<body><![CDATA[<br>     </font><font size="2" face="Verdana, Arial, Helvetica, sans-serif"><i>p<sup>F</sup><sub>t</sub></i>: Forecast power     availability &#91;W&#93; of the RESs grouped, at the <i>t</i>th hour of the next day.    <br>     </font><font size="2" face="Verdana, Arial, Helvetica, sans-serif"><i><font face="Symbol">s</font>p<sup>U</sup><sub>t</sub></i>: Up standard     deviation &#91;W&#93; in the forecast power availability of the RESs grouped, at the <i>t</i>th     hour of the next day.    <br>     </font><font size="2" face="Verdana, Arial, Helvetica, sans-serif"><i><font face="Symbol">s</font>p<sup>D</sup><sub>t</sub></i>: Down standard deviation &#91;W&#93; in the forecast     power availability of the RESs grouped, at the <i>t</i>th hour of the next day.</font></p> </blockquote>     <p><font size="2" face="Verdana, Arial, Helvetica, sans-serif"><b><i>2.1. Demand analysis</i></b></font></p>     <p><font size="2" face="Verdana, Arial, Helvetica, sans-serif">9. Acquiring and managing the hourly historical information of the   electricity demand in the microgrid.</font></p>     <p><font size="2" face="Verdana, Arial, Helvetica, sans-serif">10. Forecasting   the behavior of the demand, at each study hour of the next day (dFt).</font></p>     <p><font size="2" face="Verdana, Arial, Helvetica, sans-serif">11. Identifying   the up and down standard deviation in the forecast demand, at each study hour   of the next day (<font face="Symbol">s</font>dUt, <font face="Symbol">s</font>dDt).</font></p>     <p><font size="2" face="Verdana, Arial, Helvetica, sans-serif">It is considered that   the forecast demand follow a normal distribution with the expectation of <i>d<sup>F</sup><sub>t</sub></i> and standard deviation <i><font face="Symbol">s</font>d<sup>U</sup><sub>t</sub>, <font face="Symbol">s</font>d<sup>D</sup><sub>t</sub></i>.   The normality assumption of the forecast demand is a common practice, as can be   seen in the literature &#91;14&#93;. It is justified through the wide diversity of the   electricity demand across geographical areas and consumer classes combined with   an invocation of the central limit theorem &#91;15&#93;.</font></p>     <p><font size="2" face="Verdana, Arial, Helvetica, sans-serif"><b><i>2.2. Net demand analysis</i></b></font></p>     <p><font size="2" face="Verdana, Arial, Helvetica, sans-serif">12. Determining   the forecast net demand at each study hour of the next day. The following   equation presents the mathematical procedure to calculate the net demand, which   represents the difference between the forecast demand and the forecast power   availability of the RESs, because the RESs are characterized as negative loads.</font></p>     ]]></body>
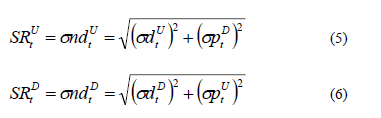
<body><![CDATA[<p><img src="/img/revistas/dyna/v82n192/v82n192a10eq04.gif"></p>     <p><font size="2" face="Verdana, Arial, Helvetica, sans-serif">Where,</font></p>     <blockquote>       <p><font size="2" face="Verdana, Arial, Helvetica, sans-serif"><i>nd<sup>F</sup><sub>t</sub></i>: Forecast net demand &#91;W&#93;,     at the <i>t</i>th hour of the next day.    <br>     </font><font size="2" face="Verdana, Arial, Helvetica, sans-serif"><i>d<sup>F</sup><sub>t</sub></i>: Forecast demand &#91;W&#93;, at     the <i>t</i>th hour of the next day.</font></p> </blockquote>     <p><font size="2" face="Verdana, Arial, Helvetica, sans-serif">13. Determine the up and down spinning reserve required by   the microgrid, at each study hour of the next day. This reserve allows   counterbalancing the uncertainty in both the electricity demand and the power   availability of the RESs. The up and down spinning reserve represent the   up and down standard deviation in the forecast net demand, respectively. The   following equations present the mathematical procedure to calculate these values,   at each study hour of the next day.</font></p>     <p><img src="/img/revistas/dyna/v82n192/v82n192a10eq0506.gif"></p>     <p><font size="2" face="Verdana, Arial, Helvetica, sans-serif">Where,</font></p>     <blockquote>       <p><font size="2" face="Verdana, Arial, Helvetica, sans-serif"><i><font face="Symbol">s</font>d<sup>U</sup><sub>t</sub></i>: Up standard     deviation &#91;W&#93; in the forecast electricity demand, at the <i>t</i>th hour of the     next day.    ]]></body>
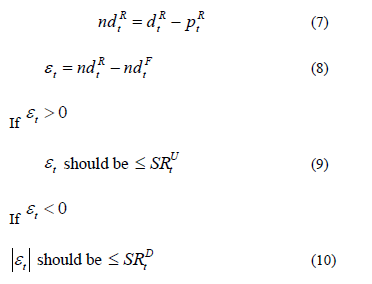
<body><![CDATA[<br>     </font><font size="2" face="Verdana, Arial, Helvetica, sans-serif"><i><font face="Symbol">s</font>d<sup>D</sup><sub>t</sub></i>: Down standard     deviation &#91;W&#93; in the forecast electricity demand, at the <i>t</i>th hour of the     next day.    <br>     </font><font size="2" face="Verdana, Arial, Helvetica, sans-serif"><i><font face="Symbol">s</font>nd<sup>U</sup><sub>t</sub></i>: Up standard     deviation &#91;W&#93; in the forecast net demand, at the <i>t</i>th hour of the next     day.    <br>     </font><font size="2" face="Verdana, Arial, Helvetica, sans-serif"><i><font face="Symbol">s</font>nd<sup>D</sup><sub>t</sub></i>: Down standard     deviation &#91;W&#93; in the forecast net demand, at the <i>t</i>th hour of the next     day.    <br>     </font><font size="2" face="Verdana, Arial, Helvetica, sans-serif"><i>SR<sup>U</sup><sub>t</sub></i>: Up spinning reserve &#91;W&#93;, at the <i>t</i>th hour     of the next day.    <br>     </font><font size="2" face="Verdana, Arial, Helvetica, sans-serif"><i>SR<sup>D</sup><sub>t</sub></i>: Down spinning reserve     &#91;W&#93;, at the <i>t</i>th hour of the next day.</font></p> </blockquote>     <p><font size="2" face="Verdana, Arial, Helvetica, sans-serif">It is considered that both the forecast electricity demand   and the forecast power availability of each RES follow a normal distribution.   Due to this condition, the forecast net demand follows a normal distribution   with expectation <i>nd<sup>F</sup><sub>t</sub></i> and standard deviation <i>SR<sup>U</sup><sub>t</sub>,   SR<sup>D</sup><sub>t</sub></i>.</font></p>     <p><font size="2" face="Verdana, Arial, Helvetica, sans-serif"><b><i>2.3. Validation analysis</i></b></font></p>     <p><font size="2" face="Verdana, Arial, Helvetica, sans-serif">14. Verifying the proper sizing of the   up and down spinning reserve, at each study hour of the next day. The following   equations present the mathematical procedure to validate the up and down   spinning reserve.</font></p>     <p><img src="/img/revistas/dyna/v82n192/v82n192a10eq0710.gif"></p>     <p><font size="2" face="Verdana, Arial, Helvetica, sans-serif">Where,</font></p>     ]]></body>
<body><![CDATA[<blockquote>       <p><font size="2" face="Verdana, Arial, Helvetica, sans-serif"><i>p<sup>R</sup><sub>t</sub></i>: Real power availability     &#91;W&#93; of the RESs, at the <i>t</i>th hour of the next day.    <br>     </font><font size="2" face="Verdana, Arial, Helvetica, sans-serif"><i>d<sup>R</sup><sub>t</sub></i>: Real electricity demand     &#91;W&#93;, at the <i>t</i>th hour of the next day.    <br>     </font><font size="2" face="Verdana, Arial, Helvetica, sans-serif"><i>nd<sup>R</sup><sub>t</sub></i>: Real net demand &#91;W&#93;, at     the <i>t</i>th hour of the next day.    <br>     </font><font size="2" face="Verdana, Arial, Helvetica, sans-serif"><i><font face="Symbol">e</font><sub>t</sub></i>: forecast error in the net     demand &#91;W&#93;, at the <i>t</i>th hour of the next day.</font></p> </blockquote>     <p><font size="2" face="Verdana, Arial, Helvetica, sans-serif">The forecast error in   the net demand follows a normal distribution with expectation zero and standard   deviation described by the up spinning reserve (<i>SR<sup>U</sup><sub>t</sub></i>)   and down spinning reserve (<i>SR<sup>D</sup><sub>t</sub></i>). The 68 % of the   forecast errors should be located between the up spinning reserve and down   spinning reserve, because these two reserves are calculated considering only   one standard deviation. Different numbers of standard deviations in the   spinning reserve calculation could be considered, depending on the risk   aversion of the system operator.</font></p>     <p><font size="2" face="Verdana, Arial, Helvetica, sans-serif"><b><i>2.4. Methodology Considerations</i></b></font></p> <ul>       <li><font size="2" face="Verdana, Arial, Helvetica, sans-serif"> The up spinning reserve allows     the system frequency to be driven to a steady state after the occurrence of     events associated with: excess in the real demand with respect to the forecast     demand, and/or deficit in the real power availability of the RESs with respect     to the forecast power availability.</font></li>       <li><font size="2" face="Verdana, Arial, Helvetica, sans-serif"> The down spinning reserve allows to drive the system frequency to     a steady state after the occurrence of events associated with: deficit in the     real demand with respect to the forecast demand, and/or excess in the real     power availability of the RESs with respect to the forecast power availability.</font></li>       <li><font size="2" face="Verdana, Arial, Helvetica, sans-serif"> The electricity demand is directly proportional to the use of     spinning reserve, i.e. an increase in the real demand with respect to the     forecast demand implies that the generators with spinning reserve capacity     should increase their generation (up spinning reserve application).</font></li>       ]]></body>
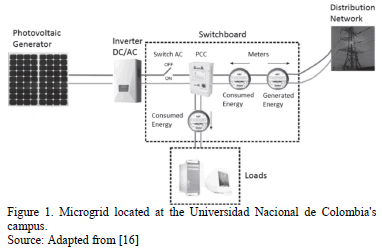
<body><![CDATA[<li><font size="2" face="Verdana, Arial, Helvetica, sans-serif"> The RESs are represented as negative loads. Therefore, the power     availability of the RESs is inversely proportional to the use of spinning reserve,     i.e. an increase in the real power availability of a RES with respect to the     forecast power availability implies that the generators with spinning reserve     capacity should decrease their generation (down spinning reserve application).</font></li>     </ul>     <p><font size="2" face="Verdana, Arial, Helvetica, sans-serif">This methodology permits to model, quantify, analyze and   verify the security scheme required by a microgrid. The security scheme ensures   efficiently the frequency stability of the microgrid, after the occurrence of   events associated with forecast errors in both the electricity demand and the power   availability of the RESs.</font></p>     <p><font size="2" face="Verdana, Arial, Helvetica, sans-serif">The proposed methodology was applied on a real microgrid   located at the Universidad Nacional de Colombia's campus (latitude 04°38' N,   longitude 74°05' W and elevation 2556 m.a.s.l.). This microgrid is described in   the following section. </font></p>     <p> </p>     <p><font size="3" face="Verdana, Arial, Helvetica, sans-serif"><b>3. Description of the microgrid</b></font></p>     <p><font size="2" face="Verdana, Arial, Helvetica, sans-serif">The microgrid &#91;16&#93; is a low voltage system   (208/120V) connected to the existing electricity distribution network. This   grid considers, among others, a RES, AC loads, computer applications, a   real-time database system, bi- directional</font><font size="2" face="Verdana, Arial, Helvetica, sans-serif"> energy meter and a switching   system. By means of these elements the energy resources can be managed under   the scheme of microgrids, which promotes the efficient use of the energy,   improves the power quality, the reliability, the security, and increases the   system flexibility as well.</font></p>     <p><font size="2" face="Verdana, Arial, Helvetica, sans-serif">The microgrid incorporates a PVG with a power capacity of   3640 Wp, which maintains the concept of BIPVS (Building Integrated Photovoltaic   Systems). The PVG uses an electronic power inverter to connect it to the AC   electric network. This PVG is coupled to two phases of the microgrid due to its   two-phase output condition, which is standard for this type of small-scale   generation.</font></p>     <p><font size="2" face="Verdana, Arial, Helvetica, sans-serif">The microgrid considers   the strategic installation of meters, which allow the dynamic behavior of   bi-directional power flow caused by the RES introduction in this grid to be   registered. The measurement scheme is presented in <a href="#fig01">Fig. 1</a>.</font></p>     <p align="center"><font size="2" face="Verdana, Arial, Helvetica, sans-serif"><a name="fig01"></a></font><img src="/img/revistas/dyna/v82n192/v82n192a10fig01.gif"></p>     ]]></body>
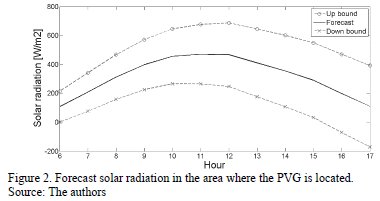
<body><![CDATA[<p><font size="2" face="Verdana, Arial, Helvetica, sans-serif">The microgrid also has an automation system composed by a   monitoring and a control system. This automation system allows voltage, power   and frequency to be registered and to perform control strategies, which will   permit in the future the assignment of energy resources based on technical and   economic considerations.</font></p>     <p> </p>     <p><font size="3" face="Verdana, Arial, Helvetica, sans-serif"><b>4. Implementation of the proposed methodology</b></font></p>     <p><font size="2" face="Verdana, Arial, Helvetica, sans-serif">For implementing the proposed methodology, the electricity   demand and the power availability of the PVG was first analyzed and forecast.   From this information, the spinning reserve required by the microgrid was   determined and validated.</font></p>     <p><font size="2" face="Verdana, Arial, Helvetica, sans-serif"><b><i>4.1. Generation analysis</i></b></font></p>     <p><font size="2" face="Verdana, Arial, Helvetica, sans-serif">First, it was necessary to acquire and analyze the   available historical data of the solar radiation and temperature in the area   where the PVG is located. For that, a database of weather information recorded   every hour during the year 2012 was obtained. This database only considers 12   of the 24 hours of a day (from 6:00 to 17:59), because during this period there   is significant solar radiation.</font></p>     <p><font size="2" face="Verdana, Arial, Helvetica, sans-serif">From this database, it was possible to model the   behavior of the solar radiation and temperature, to forecast their availability   and to identify the up and down standard deviation</font> <font size="2" face="Verdana, Arial, Helvetica, sans-serif">in their forecast, at each study   hour of the next day. This was carried out using the time series technique   based on structural models &#91;13&#93;.</font></p>     <p><font size="2" face="Verdana, Arial, Helvetica, sans-serif">The results of the   solar radiation analysis are presented in <a href="#fig02">Fig. 2</a>.</font></p>     <p align="center"><font size="2" face="Verdana, Arial, Helvetica, sans-serif"><a name="fig02"></a></font><img src="/img/revistas/dyna/v82n192/v82n192a10fig02.gif"></p>     <p><font size="2" face="Verdana, Arial, Helvetica, sans-serif"><a href="#fig02">Fig. 2</a> shows that the   forecast solar radiation for the next day starts with a value of 108.56 W/m2 at   hour 6. This value increases to 471.31 W/m2 at hour 11. Finally, the forecast   solar radiation decreases to a value of 111.31 W/m2 at hour 17.</font></p>     ]]></body>
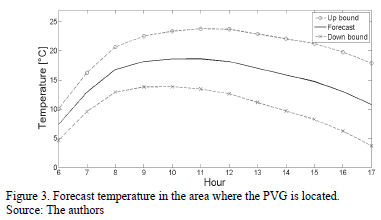
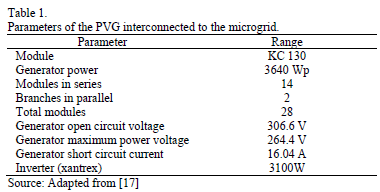
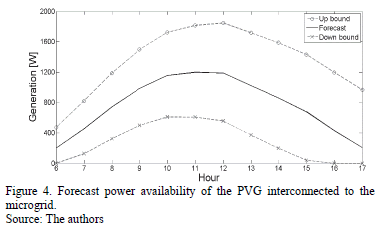
<body><![CDATA[<p><font size="2" face="Verdana, Arial, Helvetica, sans-serif"><a href="#fig02">Fig. 2</a> also allows us to see that the up and down standard   deviation in the forecast solar radiation increases their amplitude as the   forecast horizon becomes larger. The up and down standard deviation starts with   a value of 107.05 W/m2 at hour 6, this value increases to 281.40 W/m2 at hour   17.</font></p>     <p><font size="2" face="Verdana, Arial, Helvetica, sans-serif">The results of the temperature analysis are presented in <a href="#fig03">Fig. 3</a>.</font></p>     <p align="center"><font size="2" face="Verdana, Arial, Helvetica, sans-serif"><a name="fig03"></a></font><img src="/img/revistas/dyna/v82n192/v82n192a10fig03.gif"></p>     <p><font size="2" face="Verdana, Arial, Helvetica, sans-serif"><a href="#fig03">Fig. 3</a> shows that the forecast temperature for the next   day starts with a value of 7.35 °C at hour 6. This value increases to 18.63 °C   at hour 11. Finally, the forecast temperature decreases to a value of 10.81 °C   at hour 17.</font></p>     <p><font size="2" face="Verdana, Arial, Helvetica, sans-serif"><a href="#fig03">Fig. 3</a> also allows us to see that the up and down standard   deviation in the forecast temperature increases their amplitude as the forecast   horizon becomes larger. The up and down standard deviation starts with a value   of 2.70 °C at hour 6, this value increases to 7.08 °C at hour 17.</font></p>     <p><font size="2" face="Verdana, Arial, Helvetica, sans-serif">Next, the electric behavior of a PVG was modeled using   MATLAB®. For that purpose, the mathematical model proposed in &#91;17&#93; for the PVG   generator was employed.</font></p>     <p><font size="2" face="Verdana, Arial, Helvetica, sans-serif">Then, the technical   parameters of the PVG interconnected to the microgrid were identified. These   parameters are described in <a href="#tab01">Table 1</a>.</font></p>     <p align="center"><font size="2" face="Verdana, Arial, Helvetica, sans-serif"><a name="tab01"></a></font><img src="/img/revistas/dyna/v82n192/v82n192a10tab01.gif"></p>     <p><font size="2" face="Verdana, Arial, Helvetica, sans-serif">Afterwards, it was possible to forecast the power   availability of the PVG interconnected to the microgrid and to identify the up   and down standard deviation in its forecast, at each study hour of the next   day. This was realized using the mathematical model of a PVG, its technical   parameters and the hourly forecast of its primary resources (solar radiation   and temperature). The results of the generation analysis are presented in <a href="#fig04">Fig. 4</a>.</font></p>     <p align="center"><font size="2" face="Verdana, Arial, Helvetica, sans-serif"><a name="fig04"></a></font><img src="/img/revistas/dyna/v82n192/v82n192a10fig04.gif"></p>     ]]></body>
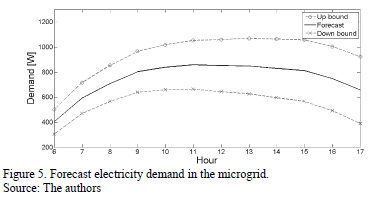
<body><![CDATA[<p><font size="2" face="Verdana, Arial, Helvetica, sans-serif"><a href="#fig04">Fig. 4</a> allows us to analyze the forecast power availability   of the PVG (<i>p<sup>F</sup><sub>t</sub></i>), which is represented by the   solid line. This figure shows that the <i>p<sup>F</sup><sub>t</sub></i> for the   next day starts with a value of 199.71 W at hour 6. This value increases to   1197.80 W at hour 11. Finally, the <i>p<sup>F</sup><sub>t</sub></i> decreases   to a value of 205.40 W at hour 17.</font></p>     <p><font size="2" face="Verdana, Arial, Helvetica, sans-serif"><a href="#fig04">Fig. 4</a> shows the up and down standard deviation bounds in   the forecast power availability of the PVG, which are represented by the dotted   lines.</font></p>     <p><font size="2" face="Verdana, Arial, Helvetica, sans-serif">This figure allows us   to analyze that the up standard deviation in the forecast power availability of   the PVG (<i><font face="Symbol">s</font>p<sup>U</sup><sub>t</sub></i>), which increases its amplitude   as the forecast horizon becomes larger, i.e. the forecast uncertainty increases   as the forecast period becomes larger. The <i><font face="Symbol">s</font>p<sup>U</sup><sub>t</sub></i> starts with a value of 272.01 W at hour 6. This value increases to 761.60 W at   hour 17.</font></p>     <p><font size="2" face="Verdana, Arial, Helvetica, sans-serif">This figure also allows us to see that the down standard   deviation in the forecast power availability of the PVG (<i><font face="Symbol">s</font>p<sup>D</sup><sub>t</sub></i>)   increases its amplitude as the forecast horizon becomes larger. However, it   starts to decrease its amplitude from hour 15. The <i><font face="Symbol">s</font>p<sup>D</sup><sub>t</sub></i> starts with a value of 199.71 W at hour 6. This value increases to 659.89 W at   hour 14. Finally, the <i><font face="Symbol">s</font>p<sup>D</sup><sub>t</sub></i> decreases to a value   of 205.40 W at hour 17.</font></p>     <p><font size="2" face="Verdana, Arial, Helvetica, sans-serif">The decreasing   behavior of the <i><font face="Symbol">s</font>p<sup>D</sup><sub>t</sub></i> during the last forecast   hours is due to two aspects: The down standard deviation bound in the forecast   solar radiation has negative values during the last forecast hours; the   mathematical model of the PVG interconnected to the microgrid support negative   values of neither solar radiation nor temperature. These two aspects led to   represent the down standard deviation bound in the forecast power availability   of the PVG with a value of zero, at those hours where the down standard   deviation bound in the forecast solar radiation is lower than zero.</font></p>     <p><font size="2" face="Verdana, Arial, Helvetica, sans-serif">It is important to note that the standard deviation in the   forecast power availability of the PVG is asymmetric, i.e. the up standard   deviation is different to the down standard deviation. This asymmetry is due to   both the aspects described above and because the efficiency of the PVG inverter   varies exponentially with the DC power input.</font></p>     <p><font size="2" face="Verdana, Arial, Helvetica, sans-serif"><b><i>4.2. Demand analysis</i></b></font></p>     <p><font size="2" face="Verdana, Arial, Helvetica, sans-serif">Initially, it was necessary to acquire and analyze the   available historical data of the electricity demand in the microgrid. For that,   a database of demand information recorded every hour along the last trimester   of the year 2012 was obtained. This database only considers 12 of the 24 hours   of a day (from 6:00 to 17:59), because during this period there is significant   electricity consumption in the microgrid.</font></p>     <p><font size="2" face="Verdana, Arial, Helvetica, sans-serif">From this database, it was possible to model the behavior   of the demand, to forecast its availability and to identify the up and down   standard deviation in its forecast, at each study hour of the next day. This   was realized using the time series technique based on structural models &#91;13&#93;.</font></p>     <p><font size="2" face="Verdana, Arial, Helvetica, sans-serif">The results of the   demand analysis are presented in <a href="#fig05">Fig. 5</a>.</font></p>     ]]></body>
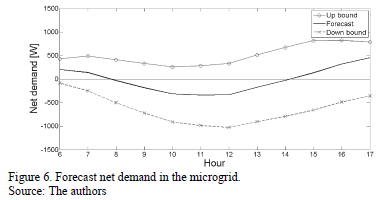
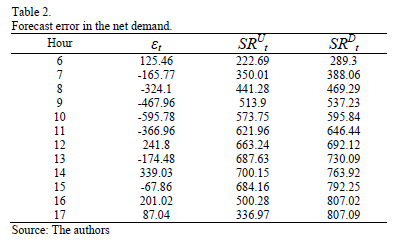
<body><![CDATA[<p align="center"><font size="2" face="Verdana, Arial, Helvetica, sans-serif"><a name="fig05"></a></font><img src="/img/revistas/dyna/v82n192/v82n192a10fig05.gif"></p>     <p><font size="2" face="Verdana, Arial, Helvetica, sans-serif"><a href="#fig05">Fig. 5</a> shows that the forecast demand (<i>d<sup>F</sup><sub>t</sub></i>)   for the next day starts with a value of 403.28 W at hour 6. This value   increases to 858.23 W at hour 11. Finally, the <i>d<sup>F</sup><sub>t</sub></i> decreases to a value of 656.33 W at hour 17.</font></p>     <p><font size="2" face="Verdana, Arial, Helvetica, sans-serif"><a href="#fig05">Fig. 5</a> allows us to analyze that the up and down standard   deviation in the forecast demand (<i><font face="Symbol">s</font>d<sup>U</sup><sub>t</sub></i> and <i><font face="Symbol">s</font>d<sup>D</sup><sub>t</sub></i>)   increases their amplitude as the forecast horizon becomes larger. The <i><font face="Symbol">s</font>d<sup>U</sup><sub>t</sub></i> and <i><font face="Symbol">s</font>d<sup>D</sup><sub>t</sub></i> start with a value of 98.52 W at    hour 6. This value increases to 267.13 W at hour 17.</font></p>     <p><font size="2" face="Verdana, Arial, Helvetica, sans-serif">It is important to   note that this standard deviation is symmetric, i.e. the up standard deviation   is equal to the down standard deviation.</font></p>     <p><font size="2" face="Verdana, Arial, Helvetica, sans-serif"><b><i>4.3. Net demand analysis</i></b></font></p>     <p><font size="2" face="Verdana, Arial, Helvetica, sans-serif">From the generation and demand analysis, it was possible   to determine the forecast net demand and to identify the up and down standard   deviation in its forecast, at each study hour of the next day, using the   equations (4-6). This up and down standard deviation represents the up and down   spinning reserve required by the microgrid, respectively. 68% of the net demand   should be located between the up spinning reserve and down spinning reserve,   because these two reserves are calculated considering only one standard   deviation.</font></p>     <p><font size="2" face="Verdana, Arial, Helvetica, sans-serif">The results of the net demand analysis are presented in <a href="#fig06">Fig.   6</a>.</font></p>     <p align="center"><font size="2" face="Verdana, Arial, Helvetica, sans-serif"><a name="fig06"></a></font><img src="/img/revistas/dyna/v82n192/v82n192a10fig06.gif"></p>     <p><font size="2" face="Verdana, Arial, Helvetica, sans-serif"><a href="#fig06">Fig. 6</a> shows that the forecast net demand (<i>nd<sup>F</sup><sub>t</sub></i>)   for the next day starts with a value of 203.57 W at hour 6. This value starts   to decrease. The microgrid goes from consuming energy of the distribution   system to delivering surplus energy to the same system at hour 8. This surplus   energy increases to 339.57 W at hour 11, because at this time the maximum level   of forecast solar radiation and temperature are reached, and therefore the   maximum level of forecast power availability of the PVG is reached. This value starts   to decrease. The microgrid goes from delivering surplus energy to the   distribution system to consuming energy of the same system at hour 14. This   energy consumption increases to 450.93 W at hour 17.</font></p>     <p><font size="2" face="Verdana, Arial, Helvetica, sans-serif"><a href="#fig06">Fig. 6</a> shows the up and down spinning reserve bounds.</font></p>     ]]></body>
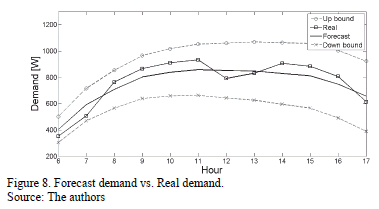
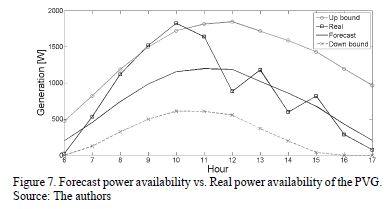
<body><![CDATA[<p><font size="2" face="Verdana, Arial, Helvetica, sans-serif">This figure shows that the up spinning reserve required by   the microgrid (<i>SR<sup>U</sup><sub>t</sub></i>) increases its amplitude as   the forecast horizon becomes larger. However, it starts to decrease its amplitude   from hour 15. The <i>SR<sup>U</sup><sub>t</sub></i> starts with a value of   222.69 W at hour 6. This value increases to 700.15 W at hour 14. Finally, the <i>SR<sup>U</sup><sub>t</sub></i> decreases to a value of 336.97 W at hour 17.</font></p>     <p><font size="2" face="Verdana, Arial, Helvetica, sans-serif">This figure also allows us to see that the down spinning   reserve required by the microgrid (<i>SR<sup>D</sup><sub>t</sub></i>) increases   its amplitude as the forecast horizon becomes larger. The <i>SR<sup>D</sup><sub>t</sub></i> starts with a value of 289.30 W at hour 6. This value increases to 807.09 W at   hour 17.</font></p>     <p><font size="2" face="Verdana, Arial, Helvetica, sans-serif">The <i>SR<sup>U</sup><sub>t</sub></i> and <i>SR<sup>D</sup><sub>t</sub></i> allow the uncertainty in both the electricity demand and the power availability   of the PVG interconnected to the microgrid to be countered. This reserve should   be located in future generators of the microgrid with controllable power   output.</font></p>     <p><font size="2" face="Verdana, Arial, Helvetica, sans-serif"><b><i>4.4. Validation analysis</i></b></font></p>     <p><font size="2" face="Verdana, Arial, Helvetica, sans-serif">In order to validate the proper sizing of the up and down   spinning reserve, it was necessary to acquire and manage both the real electricity   demand in the microgrid (<i>d<sup>R</sup><sub>t</sub></i>) and the real power   availability of the PVG interconnected to the microgrid (<i>p<sup>R</sup><sub>t</sub></i>),   at each study hour.</font></p>     <p><font size="2" face="Verdana, Arial, Helvetica, sans-serif">From this information, it was possible to develop a comparative   analysis between the <i>p<sup>R</sup><sub>t</sub></i> and the forecast power   availability of the PVG (<i>p<sup>F</sup><sub>t</sub></i>). The results of this   analysis are presented in <a href="#fig07">Fig. 7</a>.</font></p>     <p align="center"><font size="2" face="Verdana, Arial, Helvetica, sans-serif"><a name="fig07"></a></font><img src="/img/revistas/dyna/v82n192/v82n192a10fig07.gif"></p>     <p><font size="2" face="Verdana, Arial, Helvetica, sans-serif"><a href="#fig07">Fig. 7</a> shows that the <i>p<sup>R</sup><sub>t</sub></i> behavior is located within the standard deviation bounds in the forecast power   availability of the PVG, during much of the forecast horizon. However, the <i>p<sup>R</sup><sub>t</sub></i> exceeds the up standard deviation bound at the hours 9 and 10 in 19.93 W and   101.01 W, respectively.</font></p>     <p><font size="2" face="Verdana, Arial, Helvetica, sans-serif">These results verify that the time series technique used   represents in a proper way the primary resources of the PVG (solar radiation   and temperature). However, forecasting these variables with high precision is   quite a demanding task due to their high stochastic behavior.</font></p>     <p><font size="2" face="Verdana, Arial, Helvetica, sans-serif">Nonetheless, it was possible to develop a comparative   analysis between the <i>d<sup>R</sup><sub>t</sub></i> and the forecast demand (<i>d<sup>F</sup><sub>t</sub></i>).   The results of this analysis are presented in <a href="#fig08">Fig. 8</a>.</font></p>     ]]></body>
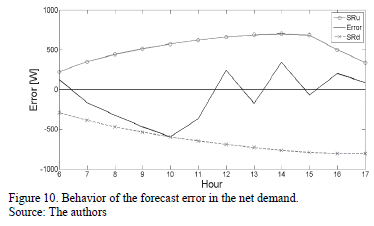
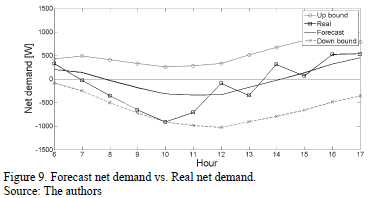
<body><![CDATA[<p align="center"><font size="2" face="Verdana, Arial, Helvetica, sans-serif"><a name="fig08"></a></font><img src="/img/revistas/dyna/v82n192/v82n192a10fig08.gif"></p>     <p><font size="2" face="Verdana, Arial, Helvetica, sans-serif"><a href="#fig08">Fig. 8</a> shows that the <i>d<sup>R</sup><sub>t</sub></i> behavior is located within the standard deviation bounds in the forecast   demand, during the whole forecast horizon.</font></p>     <p><font size="2" face="Verdana, Arial, Helvetica, sans-serif">Additionally, it was   possible to determine the real net demand (<i>nd<sup>R</sup><sub>t</sub></i>)   using the equation (7), and to develop a comparative analysis between the <i>nd<sup>R</sup><sub>t</sub></i> and the forecast net demand (<i>nd<sup>F</sup><sub>t</sub></i>). The results of   this analysis are presented in <a href="#fig09">Fig. 9</a>.</font></p>     <p align="center"><font size="2" face="Verdana, Arial, Helvetica, sans-serif"><a name="fig09"></a></font><img src="/img/revistas/dyna/v82n192/v82n192a10fig09.gif"></p>     <p><font size="2" face="Verdana, Arial, Helvetica, sans-serif"><a href="#fig09">Fig. 9</a> shows that the <i>nd<sup>R</sup><sub>t</sub></i> behavior is located within the spinning reserve bounds, during the whole   forecast horizon.</font></p>     <p><font size="2" face="Verdana, Arial, Helvetica, sans-serif">The comparative analysis presented in <a href="#fig09">Fig. 9</a> served to   determine the forecast error in the net demand, using the equation (8). The   results of the validation analysis are presented in <a href="#tab02">Table 2</a>.</font></p>     <p align="center"><font size="2" face="Verdana, Arial, Helvetica, sans-serif"><a name="tab02"></a></font><img src="/img/revistas/dyna/v82n192/v82n192a10tab02.gif"></p>     <p><font size="2" face="Verdana, Arial, Helvetica, sans-serif"><a href="#tab02">Table 2</a> shows that <i><font face="Symbol">e</font><sub>t</sub></i> is lower than <i>SR<sup>U</sup><sub>t</sub></i> for positive values of <i><font face="Symbol">e</font><sub>t</sub></i>,   which is in accordance with equation (9). This table also shows that |<i><font face="Symbol">e</font><sub>t</sub></i>|   is lower than <i>SR<sup>D</sup><sub>t</sub></i> for negative values of <i><font face="Symbol">e</font><sub>t</sub></i>,   which is in accordance with equation (10).</font></p>     <p><font size="2" face="Verdana, Arial, Helvetica, sans-serif">It is worth noting   that the <i>p<sup>R</sup><sub>t</sub></i> has a significant increase in its   value with respect to the <i>p<sup>F</sup><sub>t</sub></i> at hours 9 and 10.   However, the <i>d<sup>R</sup><sub>t</sub></i> also increases its value with   respect to the <i>d<sup>F</sup><sub>t</sub></i> at these hours. This means that   the <i><font face="Symbol">e</font><sub>t</sub></i> does not exceed the <i>SR<sup>D</sup><sub>t</sub></i> at these hours.</font></p>     <p><font size="2" face="Verdana, Arial, Helvetica, sans-serif">The behavior of <i><font face="Symbol">e</font><sub>t</sub></i> at each study   hour can be clearly observed in <a href="#fig10">Fig. 10</a>.</font></p>     ]]></body>
<body><![CDATA[<p align="center"><font size="2" face="Verdana, Arial, Helvetica, sans-serif"><a name="fig10"></a></font><img src="/img/revistas/dyna/v82n192/v82n192a10fig10.gif"></p>     <p><font size="2" face="Verdana, Arial, Helvetica, sans-serif"><a href="#fig10">Fig. 10</a> shows that the <i><font face="Symbol">e</font><sub>t</sub></i> is   located within the security bounds represented by the <i>SR<sup>U</sup><sub>t</sub></i> and <i>SR<sup>D</sup><sub>t</sub></i>, during the whole forecast horizon. The   security scheme designed allowed us to ensure the frequency stability of the   microgrid at each study hour, after the occurrence of events associated with   forecast errors in both the electricity demand and the power availability of   the PVG.</font></p>     <p> </p>     <p><font size="3" face="Verdana, Arial, Helvetica, sans-serif"><b>5. Conclusions</b></font></p>     <p><font size="2" face="Verdana, Arial, Helvetica, sans-serif">The main contribution   of this paper is the development of a methodology capable of modeling the   security scheme required by a microgrid that considers the participation of   intermittent energy sources. The security scheme is represented by an up and   down spinning reserve located in the generators of the microgrid with   controllable power output.</font></p>     <p><font size="2" face="Verdana, Arial, Helvetica, sans-serif">The methodology consists of performing a four stage   analysis at each study hour of the next day: a generation analysis, that   evaluates the uncertainty in the forecast power availability of the RES; a demand   analysis, which evaluates the uncertainty in the forecast electricity demand; a   net demand analysis, which quantifies and evaluates the up and down spinning   reserve required by the microgrid to ensure the frequency stability; and a   validation analysis, that verifies the proper sizing of the up and down   spinning reserve.</font></p>     <p><font size="2" face="Verdana, Arial, Helvetica, sans-serif">In order to implement the proposed methodology, a   forecasting technique was employed based on structural models, by means of the   statistical software OxMetrics 6.3 - module STAMP.</font></p>     <p><font size="2" face="Verdana, Arial, Helvetica, sans-serif">The proposed methodology was implemented on a real   microgrid located at the Universidad Nacional de Colombia's campus, that   considers the interconnection of a PVG. From this, it was concluded that the   time series technique used represents in a proper way the electricity demand   and the primary resources of the PVG (solar radiation and temperature).</font></p>     <p><font size="2" face="Verdana, Arial, Helvetica, sans-serif">The security scheme designed for the microgrid allowed us to   efficiently ensure the relationship between generation and demand at each study   hour, after the occurrence of events associated with forecast errors in both   the electricity demand and the power availability of the PVG.</font></p>     <p><font size="2" face="Verdana, Arial, Helvetica, sans-serif">It is clear that the interconnection of RESs in a   microgrid significantly changes the security conditions of this grid, but it represents   a challenge for the near future that needs to be assumed and evaluated with   appropriate methodologies to ensure the microgrid stability.</font></p>     ]]></body>
<body><![CDATA[<p> </p>     <p><font size="3" face="Verdana, Arial, Helvetica, sans-serif"><b>Acknowledgments</b></font></p>     <p><font size="2" face="Verdana, Arial, Helvetica, sans-serif">The authors would like to thank the SILICE group, and the Universidad   Nacional de Colombia, for their support and suggestions. The authors would also   like to thank the statistical consulting group for their invaluable assistance   in the time series analysis.</font></p>     <p> </p>     <p><font size="3" face="Verdana, Arial, Helvetica, sans-serif"><b>References</b></font></p>     <!-- ref --><p><font size="2" face="Verdana, Arial, Helvetica, sans-serif"><b>&#91;1&#93;</b> Luna,   L.E. and Parra, E.E., Methodology for assessing the feasibility of interconnecting   distributed generation, Proceedings of IEEE PES PowerTech, 2011.    &nbsp;&nbsp;&nbsp;&nbsp;&nbsp;&nbsp;&nbsp;&nbsp;[&#160;<a href="javascript:void(0);" onclick="javascript: window.open('/scielo.php?script=sci_nlinks&ref=000178&pid=S0012-7353201500040001000001&lng=','','width=640,height=500,resizable=yes,scrollbars=1,menubar=yes,');">Links</a>&#160;]<!-- end-ref --></font></p>     <!-- ref --><p><font size="2" face="Verdana, Arial, Helvetica, sans-serif"><b>&#91;2&#93;</b> Luna, L.E. and Parra, E.E., Methodology for assessing the impacts   of distributed generation interconnection. Revista Ingenier&iacute;a   e Investigaci&oacute;n, 31 (2), pp. 36-44, 2011.    &nbsp;&nbsp;&nbsp;&nbsp;&nbsp;&nbsp;&nbsp;&nbsp;[&#160;<a href="javascript:void(0);" onclick="javascript: window.open('/scielo.php?script=sci_nlinks&ref=000180&pid=S0012-7353201500040001000002&lng=','','width=640,height=500,resizable=yes,scrollbars=1,menubar=yes,');">Links</a>&#160;]<!-- end-ref --></font></p>     <!-- ref --><p><font size="2" face="Verdana, Arial, Helvetica, sans-serif"><b>&#91;3&#93;</b> Hatziargyriou,   N., Asano, H., Iravani, R. and Marnay, C., Microgrids. IEEE Power &amp; Energy   Magazine, 5 (4), pp. 78-94, 2007. DOI: 10.1109/MPAE.2007.376583</font>&nbsp;&nbsp;&nbsp;&nbsp;&nbsp;&nbsp;&nbsp;&nbsp;[&#160;<a href="javascript:void(0);" onclick="javascript: window.open('/scielo.php?script=sci_nlinks&ref=000182&pid=S0012-7353201500040001000003&lng=','','width=640,height=500,resizable=yes,scrollbars=1,menubar=yes,');">Links</a>&#160;]<!-- end-ref --><!-- ref --><p><font size="2" face="Verdana, Arial, Helvetica, sans-serif"><b>&#91;4&#93;</b> IEEE,   Smart Grid Research. IEEE Vision for smart grid controls: 2030 and beyond. Institute   of Electrical and Electronics Engineers, ISBN: 978-0-7381-8458-6, 2013.    &nbsp;&nbsp;&nbsp;&nbsp;&nbsp;&nbsp;&nbsp;&nbsp;[&#160;<a href="javascript:void(0);" onclick="javascript: window.open('/scielo.php?script=sci_nlinks&ref=000183&pid=S0012-7353201500040001000004&lng=','','width=640,height=500,resizable=yes,scrollbars=1,menubar=yes,');">Links</a>&#160;]<!-- end-ref --></font></p>     <!-- ref --><p><font size="2" face="Verdana, Arial, Helvetica, sans-serif"><b>&#91;5&#93;</b> Standard   IEEE 1547.4., IEEE guide for design, operation, and integration of distributed   resource island systems with electric power systems. IEEE Standards   Coordinating Committee 21 on Fuel Cells, Photovoltaics, Dispersed Generation,   and Energy Storage, 2011.    &nbsp;&nbsp;&nbsp;&nbsp;&nbsp;&nbsp;&nbsp;&nbsp;[&#160;<a href="javascript:void(0);" onclick="javascript: window.open('/scielo.php?script=sci_nlinks&ref=000185&pid=S0012-7353201500040001000005&lng=','','width=640,height=500,resizable=yes,scrollbars=1,menubar=yes,');">Links</a>&#160;]<!-- end-ref --></font></p>     <!-- ref --><p><font size="2" face="Verdana, Arial, Helvetica, sans-serif"><b>&#91;6&#93;</b> Bouffard,   F., Galiana, F.D. and Conejo, A.J., Market-clearing with stochastic security -   Part I: Formulation. IEEE Transactions on Power Systems, 20 (4), pp. 1818-1826,   2005. DOI: 10.1109/TPWRS.2005.857016, 10.1109/TPWRS.2005.857015</font>&nbsp;&nbsp;&nbsp;&nbsp;&nbsp;&nbsp;&nbsp;&nbsp;[&#160;<a href="javascript:void(0);" onclick="javascript: window.open('/scielo.php?script=sci_nlinks&ref=000187&pid=S0012-7353201500040001000006&lng=','','width=640,height=500,resizable=yes,scrollbars=1,menubar=yes,');">Links</a>&#160;]<!-- end-ref --><!-- ref --><p><font size="2" face="Verdana, Arial, Helvetica, sans-serif"><b>&#91;7&#93;</b> Bouffard,   F., Galiana, F.D. and Conejo, A.J., Market-clearing with stochastic security -   Part II: Case studies. IEEE Transactions on Power Systems, 20 (4), pp. 1827-1835,   2005. DOI: 10.1109/TPWRS.2005.857016, 10.1109/TPWRS.2005.857015</font>&nbsp;&nbsp;&nbsp;&nbsp;&nbsp;&nbsp;&nbsp;&nbsp;[&#160;<a href="javascript:void(0);" onclick="javascript: window.open('/scielo.php?script=sci_nlinks&ref=000188&pid=S0012-7353201500040001000007&lng=','','width=640,height=500,resizable=yes,scrollbars=1,menubar=yes,');">Links</a>&#160;]<!-- end-ref --><!-- ref --><p><font size="2" face="Verdana, Arial, Helvetica, sans-serif"><b>&#91;8&#93;</b> Ortega-Vazquez,   M. and Kirschen, D., Optimizing the Spinning Reserve Requirements Using a   Cost/Benefit Analysis. IEEE Transactions on Power Systems, 22 (1), pp. 24-33,   2007. DOI: 10.1109/TPWRS.2006.888951</font>&nbsp;&nbsp;&nbsp;&nbsp;&nbsp;&nbsp;&nbsp;&nbsp;[&#160;<a href="javascript:void(0);" onclick="javascript: window.open('/scielo.php?script=sci_nlinks&ref=000189&pid=S0012-7353201500040001000008&lng=','','width=640,height=500,resizable=yes,scrollbars=1,menubar=yes,');">Links</a>&#160;]<!-- end-ref --><!-- ref --><p><font size="2" face="Verdana, Arial, Helvetica, sans-serif"><b>&#91;9&#93;</b> Bouffard,   F. and Galiana, F.D., Stochastic security for operations planning with significant   wind power generation. IEEE Transactions on Power Systems, 23 (2), pp. 306-316,   2008. DOI: 10.1109/TPWRS.2008.919318</font>&nbsp;&nbsp;&nbsp;&nbsp;&nbsp;&nbsp;&nbsp;&nbsp;[&#160;<a href="javascript:void(0);" onclick="javascript: window.open('/scielo.php?script=sci_nlinks&ref=000190&pid=S0012-7353201500040001000009&lng=','','width=640,height=500,resizable=yes,scrollbars=1,menubar=yes,');">Links</a>&#160;]<!-- end-ref --><!-- ref --><p><font size="2" face="Verdana, Arial, Helvetica, sans-serif"><b>&#91;10&#93;</b> Ortega-Vazquez,   M. and Kirschen, D., Assessing the impact of wind power generation on operating   costs. IEEE Transactions on Smart Grid, 1 (3), pp. 295-301, 2010. DOI: 10.1109/TSG.2010.2081386</font>&nbsp;&nbsp;&nbsp;&nbsp;&nbsp;&nbsp;&nbsp;&nbsp;[&#160;<a href="javascript:void(0);" onclick="javascript: window.open('/scielo.php?script=sci_nlinks&ref=000191&pid=S0012-7353201500040001000010&lng=','','width=640,height=500,resizable=yes,scrollbars=1,menubar=yes,');">Links</a>&#160;]<!-- end-ref --><!-- ref --><p><font size="2" face="Verdana, Arial, Helvetica, sans-serif"><b>&#91;11&#93;</b> Wang, M.   and Gooi, H., Spinning reserve estimation in microgrids. IEEE Transactions on   Power Systems, 26 (3), pp. 1164-1174, 2011. DOI: 10.1109/TPWRS.2010.2100414</font>&nbsp;&nbsp;&nbsp;&nbsp;&nbsp;&nbsp;&nbsp;&nbsp;[&#160;<a href="javascript:void(0);" onclick="javascript: window.open('/scielo.php?script=sci_nlinks&ref=000192&pid=S0012-7353201500040001000011&lng=','','width=640,height=500,resizable=yes,scrollbars=1,menubar=yes,');">Links</a>&#160;]<!-- end-ref --><!-- ref --><p><font size="2" face="Verdana, Arial, Helvetica, sans-serif"><b>&#91;12&#93;</b> Morales,   J.M., Conejo, A.J., Madsen, H., Pinson, P. and Zugno, M., Integrating   renewables in electricity markets: Operational problems. New York: Springer,   2014. DOI: 10.1007/978-1-4614-9411-9</font>&nbsp;&nbsp;&nbsp;&nbsp;&nbsp;&nbsp;&nbsp;&nbsp;[&#160;<a href="javascript:void(0);" onclick="javascript: window.open('/scielo.php?script=sci_nlinks&ref=000193&pid=S0012-7353201500040001000012&lng=','','width=640,height=500,resizable=yes,scrollbars=1,menubar=yes,');">Links</a>&#160;]<!-- end-ref --><!-- ref --><p><font size="2" face="Verdana, Arial, Helvetica, sans-serif"><b>&#91;13&#93;</b> Lutkepohl,   H., New introduction to multiple time series analysis. New York: Springer,   2005. DOI: 10.1007/978-3-540-27752-1</font>&nbsp;&nbsp;&nbsp;&nbsp;&nbsp;&nbsp;&nbsp;&nbsp;[&#160;<a href="javascript:void(0);" onclick="javascript: window.open('/scielo.php?script=sci_nlinks&ref=000194&pid=S0012-7353201500040001000013&lng=','','width=640,height=500,resizable=yes,scrollbars=1,menubar=yes,');">Links</a>&#160;]<!-- end-ref --><!-- ref --><p><font size="2" face="Verdana, Arial, Helvetica, sans-serif"><b>&#91;14&#93;</b> Gross G.   and Galiana F.D., Short-term load forecasting, Proceedings of IEEE, 75 (12),   pp. 1558-1573, 1987. DOI: 10.1109/PROC.1987.13927</font>&nbsp;&nbsp;&nbsp;&nbsp;&nbsp;&nbsp;&nbsp;&nbsp;[&#160;<a href="javascript:void(0);" onclick="javascript: window.open('/scielo.php?script=sci_nlinks&ref=000195&pid=S0012-7353201500040001000014&lng=','','width=640,height=500,resizable=yes,scrollbars=1,menubar=yes,');">Links</a>&#160;]<!-- end-ref --><!-- ref --><p><font size="2" face="Verdana, Arial, Helvetica, sans-serif"><b>&#91;15&#93;</b> Papoulis,   A., Probability, random variables, and stochastic processes, 3rd edition.   Boston, MA: McGraw-Hill, 1991.    &nbsp;&nbsp;&nbsp;&nbsp;&nbsp;&nbsp;&nbsp;&nbsp;[&#160;<a href="javascript:void(0);" onclick="javascript: window.open('/scielo.php?script=sci_nlinks&ref=000196&pid=S0012-7353201500040001000015&lng=','','width=640,height=500,resizable=yes,scrollbars=1,menubar=yes,');">Links</a>&#160;]<!-- end-ref --></font></p>     <!-- ref --><p><font size="2" face="Verdana, Arial, Helvetica, sans-serif"><b>&#91;16&#93;</b> Hern&aacute;ndez,   J., Luna, L.E. and Blanco, A.M., Design and installation of a smart grid with   distributed generation. A pilot case in the Colombian networks, Proceedings of IEEE   Photovoltaic Specialists Conference, 2012. DOI: 10.1109/pvsc.2012.6317677</font>&nbsp;&nbsp;&nbsp;&nbsp;&nbsp;&nbsp;&nbsp;&nbsp;[&#160;<a href="javascript:void(0);" onclick="javascript: window.open('/scielo.php?script=sci_nlinks&ref=000198&pid=S0012-7353201500040001000016&lng=','','width=640,height=500,resizable=yes,scrollbars=1,menubar=yes,');">Links</a>&#160;]<!-- end-ref --><!-- ref --><p><font size="2" face="Verdana, Arial, Helvetica, sans-serif"><b>&#91;17&#93;</b> Hern&aacute;ndez,   J., Gordillo, G. and Vallejo, W., Predicting the behavior of a grid-connected   photovoltaic system from measurements of solar radiation and ambient   temperature. Applied Energy Journal, 104, pp. 527-537, 2013. DOI: 10.1016/j.apenergy.2012.10.022</font>&nbsp;&nbsp;&nbsp;&nbsp;&nbsp;&nbsp;&nbsp;&nbsp;[&#160;<a href="javascript:void(0);" onclick="javascript: window.open('/scielo.php?script=sci_nlinks&ref=000199&pid=S0012-7353201500040001000017&lng=','','width=640,height=500,resizable=yes,scrollbars=1,menubar=yes,');">Links</a>&#160;]<!-- end-ref --><p> </p>     <p><font size="2" face="Verdana, Arial, Helvetica, sans-serif"><b>L.E. Luna-Ram&iacute;rez,</b> received the BSc. Eng degree   in Electrical Engineering from the Escuela Colombiana de Ingenier&iacute;a &quot;Julio   Garavito&quot;, Bogot&aacute;, Colombia, in 2007, and the MSc. degree in Electrical   Engineering from the Universidad Nacional de Colombia, Bogot&aacute;, Colombia, in   2011. He is currently pursuing the PhD. degree at the Universidad Nacional de   Colombia. He is a junior research of the PAAS-UN Group and he was recently a   visiting scholar at the National Renewable Energy Center (CENER), Sarriguren,   Spain. His research interests include power systems economics, reliability and   stochastic programming.</font></p>     <p><font size="2" face="Verdana, Arial, Helvetica, sans-serif"><b>H. Torres-S&aacute;nchez,</b> received the BSc. Eng and MSc.   degrees in Electrical Engineering from the Universidad Nacional de Colombia,   Bogot&aacute;, Colombia, in 1976 and 1982, respectively, and realized PhD. studies at   the Technical University of Darmstadt, Darmstadt, Germany (1978-1982). He is   currently a professor at the Universidad Nacional de Colombia, Bogot&aacute; Colombia and   the head of the PAAS-UN Group. His research interests include power quality,   electromagnetic compatibility and probabilistic aspects of power quality.</font></p>     ]]></body>
<body><![CDATA[<p><font size="2" face="Verdana, Arial, Helvetica, sans-serif"><b>F.A. Pavas-Mart&iacute;nez,</b> received the BSc. Eng, MSc.   and PhD. degrees in Electrical Engineering from the Universidad Nacional de   Colombia, Bogot&aacute;, Colombia, in 2003, 2005 and 2013, respectively. He is   currently a professor at the Universidad Nacional de Colombia and a researcher in   the PAAS-UN Group. His research interests include power quality,   electromagnetic compatibility and probabilistic aspects of power quality.</font></p>      ]]></body><back>
<ref-list>
<ref id="B1">
<label>1</label><nlm-citation citation-type="confpro">
<person-group person-group-type="author">
<name>
<surname><![CDATA[Luna]]></surname>
<given-names><![CDATA[L.E.]]></given-names>
</name>
<name>
<surname><![CDATA[Parra]]></surname>
<given-names><![CDATA[E.E.]]></given-names>
</name>
</person-group>
<article-title xml:lang="en"><![CDATA[Methodology for assessing the feasibility of interconnecting distributed generation]]></article-title>
<source><![CDATA[]]></source>
<year></year>
<conf-name><![CDATA[ Proceedings of IEEE PES PowerTech]]></conf-name>
<conf-date>2011</conf-date>
<conf-loc> </conf-loc>
</nlm-citation>
</ref>
<ref id="B2">
<label>2</label><nlm-citation citation-type="journal">
<person-group person-group-type="author">
<name>
<surname><![CDATA[Luna]]></surname>
<given-names><![CDATA[L.E.]]></given-names>
</name>
<name>
<surname><![CDATA[Parra]]></surname>
<given-names><![CDATA[E.E.]]></given-names>
</name>
</person-group>
<article-title xml:lang="en"><![CDATA[Methodology for assessing the impacts of distributed generation interconnection]]></article-title>
<source><![CDATA[Revista Ingeniería e Investigación]]></source>
<year>2011</year>
<volume>31</volume>
<numero>2</numero>
<issue>2</issue>
<page-range>36-44</page-range></nlm-citation>
</ref>
<ref id="B3">
<label>3</label><nlm-citation citation-type="journal">
<person-group person-group-type="author">
<name>
<surname><![CDATA[Hatziargyriou]]></surname>
<given-names><![CDATA[N.]]></given-names>
</name>
<name>
<surname><![CDATA[Asano]]></surname>
<given-names><![CDATA[H.]]></given-names>
</name>
<name>
<surname><![CDATA[Iravani]]></surname>
<given-names><![CDATA[R.]]></given-names>
</name>
<name>
<surname><![CDATA[Marnay]]></surname>
<given-names><![CDATA[C.]]></given-names>
</name>
</person-group>
<article-title xml:lang="en"><![CDATA[Microgrids]]></article-title>
<source><![CDATA[IEEE Power & Energy Magazine]]></source>
<year>2007</year>
<volume>5</volume>
<numero>4</numero>
<issue>4</issue>
<page-range>78-94</page-range></nlm-citation>
</ref>
<ref id="B4">
<label>4</label><nlm-citation citation-type="book">
<collab>IEEE</collab>
<source><![CDATA[Smart Grid Research: IEEE Vision for smart grid controls: 2030 and beyond]]></source>
<year>2013</year>
<publisher-name><![CDATA[Institute of Electrical and Electronics Engineers]]></publisher-name>
</nlm-citation>
</ref>
<ref id="B5">
<label>5</label><nlm-citation citation-type="confpro">
<source><![CDATA[Standard IEEE 1547.4.: IEEE guide for design, operation, and integration of distributed resource island systems with electric power systems.]]></source>
<year></year>
<conf-name><![CDATA[ IEEE Standards Coordinating Committee 21 on Fuel Cells, Photovoltaics, Dispersed Generation, and Energy Storage]]></conf-name>
<conf-date>2011</conf-date>
<conf-loc> </conf-loc>
</nlm-citation>
</ref>
<ref id="B6">
<label>6</label><nlm-citation citation-type="journal">
<person-group person-group-type="author">
<name>
<surname><![CDATA[Bouffard]]></surname>
<given-names><![CDATA[F.]]></given-names>
</name>
<name>
<surname><![CDATA[Galiana]]></surname>
<given-names><![CDATA[F.D.]]></given-names>
</name>
<name>
<surname><![CDATA[Conejo]]></surname>
<given-names><![CDATA[A.J.]]></given-names>
</name>
</person-group>
<article-title xml:lang="en"><![CDATA[Market-clearing with stochastic security - Part I: Formulation]]></article-title>
<source><![CDATA[IEEE Transactions on Power Systems]]></source>
<year>2005</year>
<volume>20</volume>
<numero>4</numero>
<issue>4</issue>
<page-range>1818-1826</page-range></nlm-citation>
</ref>
<ref id="B7">
<label>7</label><nlm-citation citation-type="journal">
<person-group person-group-type="author">
<name>
<surname><![CDATA[Bouffard]]></surname>
<given-names><![CDATA[F.]]></given-names>
</name>
<name>
<surname><![CDATA[Galiana]]></surname>
<given-names><![CDATA[F.D.]]></given-names>
</name>
<name>
<surname><![CDATA[Conejo]]></surname>
<given-names><![CDATA[A.J.]]></given-names>
</name>
</person-group>
<article-title xml:lang="en"><![CDATA[Market-clearing with stochastic security: Part II: Case studies]]></article-title>
<source><![CDATA[IEEE Transactions on Power Systems]]></source>
<year>2005</year>
<volume>20</volume>
<numero>4</numero>
<issue>4</issue>
<page-range>1827-1835</page-range></nlm-citation>
</ref>
<ref id="B8">
<label>8</label><nlm-citation citation-type="journal">
<person-group person-group-type="author">
<name>
<surname><![CDATA[Ortega-Vazquez]]></surname>
<given-names><![CDATA[M.]]></given-names>
</name>
<name>
<surname><![CDATA[Kirschen]]></surname>
<given-names><![CDATA[D.]]></given-names>
</name>
</person-group>
<article-title xml:lang="en"><![CDATA[Optimizing the Spinning Reserve Requirements Using a Cost/Benefit Analysis.]]></article-title>
<source><![CDATA[IEEE Transactions on Power Systems]]></source>
<year>2007</year>
<volume>22</volume>
<numero>1</numero>
<issue>1</issue>
<page-range>24-33</page-range></nlm-citation>
</ref>
<ref id="B9">
<label>9</label><nlm-citation citation-type="journal">
<person-group person-group-type="author">
<name>
<surname><![CDATA[Bouffard]]></surname>
<given-names><![CDATA[F.]]></given-names>
</name>
<name>
<surname><![CDATA[Galiana]]></surname>
<given-names><![CDATA[F.D.]]></given-names>
</name>
</person-group>
<article-title xml:lang="en"><![CDATA[Stochastic security for operations planning with significant wind power generation]]></article-title>
<source><![CDATA[IEEE Transactions on Power Systems]]></source>
<year>2008</year>
<volume>23</volume>
<numero>2</numero>
<issue>2</issue>
<page-range>306-316</page-range></nlm-citation>
</ref>
<ref id="B10">
<label>10</label><nlm-citation citation-type="journal">
<person-group person-group-type="author">
<name>
<surname><![CDATA[Ortega-Vazquez]]></surname>
<given-names><![CDATA[M.]]></given-names>
</name>
<name>
<surname><![CDATA[Kirschen]]></surname>
<given-names><![CDATA[D.]]></given-names>
</name>
</person-group>
<article-title xml:lang="en"><![CDATA[Assessing the impact of wind power generation on operating costs]]></article-title>
<source><![CDATA[IEEE Transactions on Smart Grid]]></source>
<year>2010</year>
<volume>1</volume>
<numero>3</numero>
<issue>3</issue>
<page-range>295-301</page-range></nlm-citation>
</ref>
<ref id="B11">
<label>11</label><nlm-citation citation-type="journal">
<person-group person-group-type="author">
<name>
<surname><![CDATA[Wang]]></surname>
<given-names><![CDATA[M.]]></given-names>
</name>
<name>
<surname><![CDATA[Gooi]]></surname>
<given-names><![CDATA[H.]]></given-names>
</name>
</person-group>
<article-title xml:lang="en"><![CDATA[Spinning reserve estimation in microgrids]]></article-title>
<source><![CDATA[IEEE Transactions on Power Systems]]></source>
<year>2011</year>
<volume>26</volume>
<numero>3</numero>
<issue>3</issue>
<page-range>1164-1174</page-range></nlm-citation>
</ref>
<ref id="B12">
<label>12</label><nlm-citation citation-type="book">
<person-group person-group-type="author">
<name>
<surname><![CDATA[Morales]]></surname>
<given-names><![CDATA[J.M.]]></given-names>
</name>
<name>
<surname><![CDATA[Conejo]]></surname>
<given-names><![CDATA[A.J.]]></given-names>
</name>
<name>
<surname><![CDATA[Madsen]]></surname>
<given-names><![CDATA[H.]]></given-names>
</name>
<name>
<surname><![CDATA[Pinson]]></surname>
<given-names><![CDATA[P.]]></given-names>
</name>
<name>
<surname><![CDATA[Zugno]]></surname>
<given-names><![CDATA[M.]]></given-names>
</name>
</person-group>
<source><![CDATA[Integrating renewables in electricity markets: Operational problems]]></source>
<year>2014</year>
<publisher-loc><![CDATA[New York ]]></publisher-loc>
<publisher-name><![CDATA[Springer]]></publisher-name>
</nlm-citation>
</ref>
<ref id="B13">
<label>13</label><nlm-citation citation-type="book">
<person-group person-group-type="author">
<name>
<surname><![CDATA[Lutkepohl]]></surname>
<given-names><![CDATA[H.]]></given-names>
</name>
</person-group>
<source><![CDATA[New introduction to multiple time series analysis.]]></source>
<year>2005</year>
<publisher-loc><![CDATA[New York ]]></publisher-loc>
<publisher-name><![CDATA[Springer]]></publisher-name>
</nlm-citation>
</ref>
<ref id="B14">
<label>14</label><nlm-citation citation-type="journal">
<person-group person-group-type="author">
<name>
<surname><![CDATA[Gross]]></surname>
<given-names><![CDATA[G.]]></given-names>
</name>
<name>
<surname><![CDATA[Galiana]]></surname>
<given-names><![CDATA[F.D.]]></given-names>
</name>
</person-group>
<article-title xml:lang="en"><![CDATA[Short-term load forecasting]]></article-title>
<source><![CDATA[Proceedings of IEEE]]></source>
<year>1987</year>
<volume>75</volume>
<numero>12</numero>
<issue>12</issue>
<page-range>1558-1573</page-range></nlm-citation>
</ref>
<ref id="B15">
<label>15</label><nlm-citation citation-type="book">
<person-group person-group-type="author">
<name>
<surname><![CDATA[Papoulis]]></surname>
<given-names><![CDATA[A.]]></given-names>
</name>
</person-group>
<source><![CDATA[Probability, random variables, and stochastic processes]]></source>
<year>1991</year>
<edition>3rd</edition>
<publisher-loc><![CDATA[Boston^eMA MA]]></publisher-loc>
<publisher-name><![CDATA[McGraw-Hill]]></publisher-name>
</nlm-citation>
</ref>
<ref id="B16">
<label>16</label><nlm-citation citation-type="confpro">
<person-group person-group-type="author">
<name>
<surname><![CDATA[Hernández]]></surname>
<given-names><![CDATA[J.]]></given-names>
</name>
<name>
<surname><![CDATA[Luna]]></surname>
<given-names><![CDATA[L.E.]]></given-names>
</name>
<name>
<surname><![CDATA[Blanco]]></surname>
<given-names><![CDATA[A.M.]]></given-names>
</name>
</person-group>
<article-title xml:lang="en"><![CDATA[Design and installation of a smart grid with distributed generation.: A pilot case in the Colombian networks]]></article-title>
<source><![CDATA[]]></source>
<year></year>
<conf-name><![CDATA[ Proceedings of IEEEPhotovoltaic Specialists Conference]]></conf-name>
<conf-date>2012</conf-date>
<conf-loc> </conf-loc>
</nlm-citation>
</ref>
<ref id="B17">
<label>17</label><nlm-citation citation-type="journal">
<person-group person-group-type="author">
<name>
<surname><![CDATA[Hernández]]></surname>
<given-names><![CDATA[J.]]></given-names>
</name>
<name>
<surname><![CDATA[Gordillo]]></surname>
<given-names><![CDATA[G.]]></given-names>
</name>
<name>
<surname><![CDATA[Vallejo]]></surname>
<given-names><![CDATA[W.]]></given-names>
</name>
</person-group>
<article-title xml:lang="en"><![CDATA[Predicting the behavior of a grid-connected photovoltaic system from measurements of solar radiation and ambient temperature.]]></article-title>
<source><![CDATA[Applied Energy Journal]]></source>
<year>2013</year>
<numero>104</numero>
<issue>104</issue>
<page-range>527-537</page-range></nlm-citation>
</ref>
</ref-list>
</back>
</article>