Comparing the efficiency of performing complex tasks with a tablet and a smartphone
Comparando la eficiencia al realizar tareas complejas con una tableta frente a un smartphone
Federico Botella a, Juan P. Moreno b & Antonio Peñalver a
a Center of Operations Research University Institute, Miguel Hernandez University of Elche, Alicante, Spain, federico@umh.es, a.penalver@umh.es
b Statistics, Mathematics and Informatics Department, Miguel Hernandez University of Elche, Alicante, Spain, juan.morenom@umh.es
Received: February 18th, 2015. Received in revised form: March 16th, 2015. Accepted: September 26th, 2015
]]>This work is licensed under a Creative Commons Attribution-NonCommercial-NoDerivatives 4.0 International License.
Abstract
The number of users who today use a smartphone or a tablet as a tool on a daily basis is increasing. Professionals, in certain environments, are moving towards mobile devices instead of the traditional laptop or desktop computer. From manufacturing to e-health and e-commerce, more and more apps can be used to improve companies' efficiency and efficacy. Thus, there are apps developed for tablet and smartphone platforms as well as for the traditional desktop version. But how can we define user efficiency with each platform? In this work we present a comparative usability study of one CRM app that is designed for all that three platforms (laptop, smartphone, and tablet). We conducted a study with eight participants in which the efficiency of one mobile app designed for iPad and iPhone was measured. Results of the study demonstrate that users are more efficient with a tablet than with a smartphone for undertaking complex tasks.
Keywords: mobile usability; screen size; mobile efficiency; mobile effectiveness.
Resumen
El número de usuarios que usan diariamente un smartphone o una tableta como su herramienta de trabajo está aumentando. Muchos profesionales están cambiando sus ordenadores de escritorio o portátiles por dispositivos móviles en ciertos entornos. Desde factorías hasta sectores de e-health o e-commerce, cada vez más aplicaciones móviles están siendo usadas para mejorar la eficacia y eficiencia de las empresas. Así, podemos encontrar apps desarrolladas par tabletas o smartphones además de sus versiones tradicionales de escritorio. Pero, ¿cómo podemos medir la eficiencia de una usuario sobre cada plataforma? En este trabajo presentamos un estudio comparativo de usabilidad sobre una aplicación de gestión CRM diseñada para las tres plataformas. Realizamos un estudio con ocho participantes para medir la eficiencia de una aplicación móvil diseñada para iPad y para iPhone. Los resultados demuestran que los usuarios son más eficientes con una tableta que con un smartphone para realizar tareas complejas.
Palabras clave: usabilidad móvil; tamaño pantalla; eficiencia móvil; efectividad móvil.
1. Introduction
]]> Mobile phones have been evolving ever since the 1980s and at a faster rate than any other device. The original mobile concept has inspired new devices, which have led to the development of smartphones and tablets, increasingly with touchscreen capabilities.We can currently find smartphones with a screen size from 3 to 6 inches (small screen mobile devices), and tablets with a screen size from 7 up to 10-12 inches (extra-large screen mobiles devices) [4]. Nevertheless, a new kind of mobile device has recently been introduced that is halfway between a smartphone and a tablet, with a screen size from 5 to 6.9 inches: known as the "phablet". Thus, we have a wide range of portable devices with different screen sizes. It is therefore difficult for a user to select the most adequate size to perform a concrete task or use a particular app for his/her daily work.
Moreover, the wide range of laptops on offer start from a 10-11 inch screen size and go up to a maximum of 18 inches [9], increasing by one inch. Users can also find computer monitors with screen sizes from 19 to 30 inches (or even larger in some cases) [5]. Today, therefore, users can interact with screen sizes from only 3 inches up to 30 inches, when they work with a specific application to perform a concrete task. Therefore, we could ask a question: What is the breakpoint for designing a different application for a smartphone, a tablet, a laptop or a desktop computer?
It is clear that an application designed for a desktop computer will run without any problem on a laptop. A user could perform the same tasks with the same efficiency using both platforms. But can we be sure that one app designed for a smartphone will run in the same way on a tablet (or a phablet)? Will the user be able to perform all tasks that can be done on a tablet with the same efficiency on a smartphone? Are there tasks that cannot be performed on a smartphone? Will all users be equally as productive with a tablet as with a smartphone?
In this paper we will test our hypothesis that one app designed for smartphones and adapted for tablets will have different usability aspects: users will perform one task in a different manner and it will take longer on smartphones than on tablets. We designed an experiment to measure the usability of a commercial app designed for both iPhone and iPad. We conducted the experiment with several users to discover the efficiency when executing certain complex tasks. We also collected qualitative data about the usage of the app while users interacted with both devices performing the same tasks sequentially. And, finally, we discovered the main usability problems that users experienced with each device. This experiment reveals that it is important to have a good design for different devices with different screen sizes and quantifies how much more time users spend performing a concrete complex task on a smartphone than on a tablet.
The rest of the paper is organized as follows: an outline of related work is presented in section 2. Next, we present a description of the app designed for both smartphones and tablets that will be used in this study. This is followed by a detailed description of the experiment conducted and methodology employed. The results are then presented and the data obtained are analyzed and compared to the research data. Finally, conclusions and future work are presented.
2. Related work
Several studies have focused on the ability of the users to read text on small screens and the capacity of the participants to remember information they have read. In [13] Sanchez & Goolsbee performed a study to find out what the user deficit was when they were remembering information that had been read on a full-size screen compared to when they used a small device. When users rotated the screen of a smart device to landscape orientation that deficit was significantly reduced. The effect of scrolling on a small screen is one of the factors that can lead to this deficit. In a later study, these authors proved that reading on small screens had a negative impact on remembering information, which depended on text and screen size [14]. If the user augments the text size on a small device, the need to scroll increases and the amount of information recalled decreases. Those users who read a large amount of text on his/her device that has a small screen will need to scroll constantly and consequently the performance of this task will be lower.
The information and text presented on a small screen should be easily comprehensible. The user can be confused if one app presents a large amount of information with a font size that is hard to read. Moreover, the app menus can have a negative effect on reading the screen, unless the user can find a large preview on his/her device and the amount of information in each screen has been optimized. Ziefle presented one study that researches the tradeoff between visual density and menu foresight [16]. The main factors in this tradeoff were the font sizes (8 pts, 12 pts) and the size of the preview with one to five functions per screen at a time. The navigation performance was optimal when font size and the size of the preview were large. The lowest performance was obtained when the preview was small and the font size large, showing that proper orientation is more important than visibility demands.
]]> Screen size and sentence splitting can have an influence on the manipulation of a small device as well as the comprehension of the text by users and therefore the perceived usability or personal perceptions. If the user has to frequently scroll the text, comprehension is not affected. However, when sentences are split on small screens the user has to return to a previous screen to re-read more text. As such, users prefer larger screens to read text as they obtain better comprehension with less effort [7].When users have to perform complex tasks by typing text on small screens, they achieved a low performance in the execution of their tasks. Texts should be easily readable with large font sizes and, as such, less text will fit on the screen. If the user needs to type some text in this context, the task will be harder to accomplish the virtual keyboard is present on the screen and, thus, the amount of information presented will be even lower. The virtual keyboard reduces the visual area with the information presented on the screen and the user has to enter a certain amount of text, usually with one finger or using a stylus: a hard task in itself [6].
The menus and other navigation areas will also affect the performance and usability of an application designed for small screens [15]. Adapting the interface of an application designed for small screens to the user's needs normally increases the performance and efficiency. Users are more satisfied and perform better with those applications that have adaptive menus instead of applications with an interface not adapted from an application designed for desktop or larger screens [8]. However, the problem when adapting menus is the user's low awareness of the full set of items on the interface, resulting in it being more difficult to discover new features of the application for users.
The attractiveness of a smartphone can affect the perceived usability of a device. In [10] authors found that participants sometimes rate products high in usability despite experiencing obvious usability problems such as low effectiveness or efficiency. The brand and pleasant design can outweigh the low effectiveness or efficiency of the device. They report that attractiveness, effectiveness and efficiency each has independent influence on usability ratings and; moreover, attractiveness had the largest impact.
3. Layout
In this work, the tablet and smartphone versions of a mobile application for integral management of a photo studio company were used. PhotoSolutionPro is an application designed for desktops but it also offers versions for iPad and iPhone. We used a demo version of this application for iPad and iPhone and we selected certain modules for the tests design of our experiment.
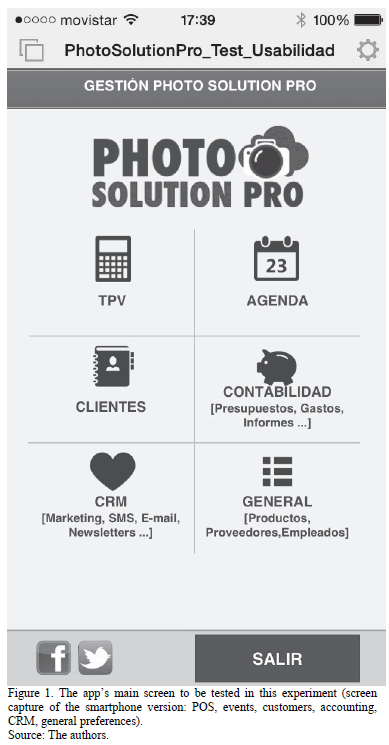
PhotoSolutionPro is an application that allows the entire workflow to be managed: from appointments, budgets, meetings, models, invoicing, expenses, marketing, profits and cash reports. In Fig. 1 we can see this application's main screen.
The application was developed using a FileMaker Pro database, which allows for the application to be distributed on different platforms: iPad, iPhone, desktop and web.
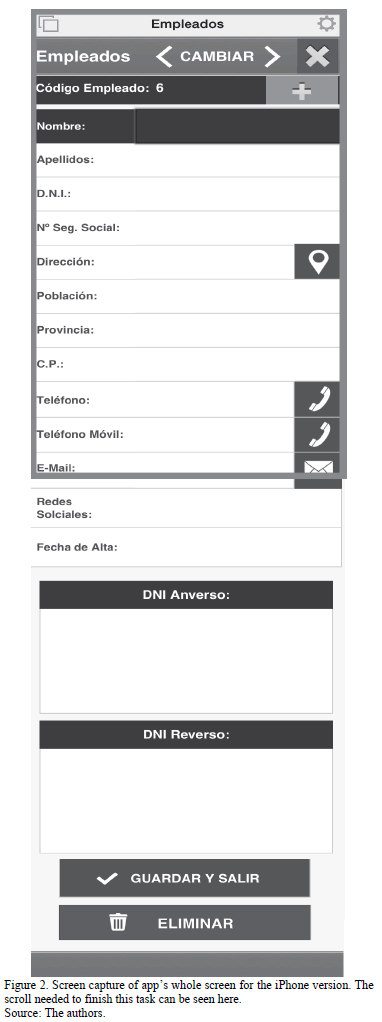
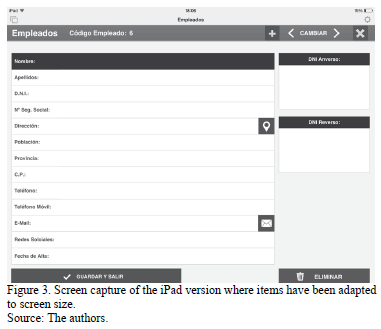
]]> The design of the PhotoSolutionPro application has been adapted from the desktop version for each mobile device on which the application can be run: iPhone and iPad. Different layouts for the adaptation of the interface to each individual device, in order to achieve the best style were used: different font sizes were employed, the sizes of the buttons were defined for each platform, and different menus or the layout of the different elements of the interface were designed (see Figs. 2, 3).
4. Method
In this experiment we installed a demo version of the PhotoSolutionPro app on an iPad mini with a 7.9 inch screen and a demo of the iPhone version in an iPhone5 with a 4 inch screen. We wanted to test how much time it takes a user to perform certain tasks on a tablet and how much time it takes to perform the same tasks on a smartphone, i.e. we wanted to compare the user's efficiency when performing certain complex tasks on a small screen device with a large screen device. Moreover, we wanted to analyze if the user's effectiveness for each version and perceived usability of the application were affected by the use of devices with different screen sizes.
The definition of usability in ISO 9241 [2] was applied as well as the evaluation questionnaire SUS [1]. All participants were recorded on video using different cameras and devices while they were performing all the tasks that are set out in this experiment.
4.1. Participants
In this experiment we selected eight users who voluntarily attended the test we performed in March 2014. We selected 3 female and 5 males with an age range from 24 to 35 (mean= 31.50, SD=4.38). All the participants owned their own smartphone and their own tablet (although not all of them had an iPhone or an iPad mini like the ones we used in our laboratory). Generally speaking, all participants intensively used their mobile devices on a weekly basis (mean = 20.38 hours/week; SD=14.60), but not all participants had extensive experience in the management of their mobile devices. None of them had previously worked with the app used in this experiment. As all participants were in the same age range, the effect of perceived usability due to the age of participant was minimized [1].
4.2. Procedure
]]> Selected participants were divided into two groups of 4 members each: the, minimum number of users acceptable for valid results in usability studies [10]. The first group performed a set of five tasks in sequential order on a tablet and then the same five tasks in sequential order in a smartphone. The second group of 4 users performed a set of five tasks in sequential order on a smartphone and then the same five tasks in sequential order on a tablet. We followed the within-subjects design method to mitigate the effect of learning and we also applied the testing multiple product versions method to compare the two versions of the app [12].When participants arrived at the lab, they had both devices prepared (iPad mini and iPhone) with the app installed on each device in order to begin testing. Participants did not have to install or configure any parameter on any device. We had previously agreed that the total time to perform all tasks and to fulfill all questionnaires by the same participant should be up to hour.
All participants performed the same tests in the same laboratory under the same conditions. When the participant arrived at the laboratory we explained to her/him the purpose of the tests and we invited her/him to sign a statement of informed consent, given that all participant activities were recorded during the tests.
As none of the participants had used the app previously, we allowed them about 3 minutes to navigate around the screens and menus of the app in the device in which they were going to perform the tasks. We asked participants to orally explain what they thought about the app in general. The participants were allowed to finish all tasks at their own pace and the moderator did not give them any feedback about success or failure in each task. Only in one task did a participant become clogged and, consequently, the moderator stopped the task and invited the participant to continue with the next task.
We then started with the undertaking of the five tasks on each device, and depending on the group the participant was assigned they first started with either the iPad or the iPhone. This process took about 35 minutes for both devices. After finishing the test they completed the SUS questionnaire [3] to register their perceived usability of the overall application.
4.2.1. Equipment and materials
In our laboratory we used a 64Gb iPad Mini with 7.9-inch retina display and 64GB iPhone 5 with 4-inch retina display. We used an iPevo Ziggi-HD 5 Megapixel document camera with built-in microphone to record the movements of the participants' hands while interacting with the mobile device in each test. We also recorded her/his voice with the microphone. In addition, we use a Canon EOS 5D Mark II camera to record a video of the participants' faces in full hd.
4.2.2. Experimental tasks
The five tasks the participants had to perform and the description of each one are described below:
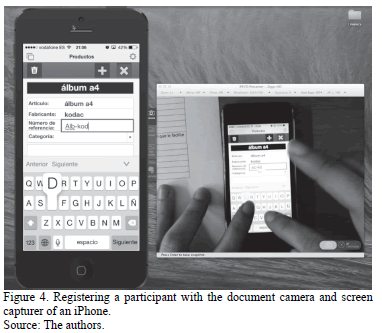
In Fig. 4 we can see one participant using an iPhone introducing a new product into the app. We captured her hands with the Presenter app of the iPevo document camera and we can view the full screen of the iPhone with the Reflector app in the screen of an iMac to register in detail all the keystrokes performed by the participant.
4.3. Measures
4.3.1. Effectiveness on each device
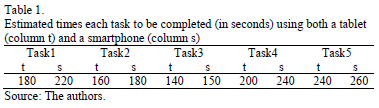
We previously performed all tasks in the laboratory to estimate the time required to undertake each one of the five tasks on both the tablet and the smartphone (see Table 1):
]]>
All activities performed by the participants with the tablet and the smartphone were recorded on video. Thus, we can check if the participant had completely finished the task and then calculate the time it took them. Moreover, we have a valuable qualitative data record of each participant's impressions during the tests. The moderator did not give participants any feedback about their success or failure in each task.
4.3.2. Perceived usability of the application
We used the System Usability Scale (SUS) questionnaire [3] after a participant completed all the tasks in both devices in order to measure the perceived usability of the application. Participants rated the ten items in the SUS questionnaire using a scale from 1 (strongly disagree) to 5 (strongly agree). We selected this tool due to its wide acceptance in the usability community and because it is free and easy to complete.
5. Results
5.1. Effectiveness in tasks
All participants performed the five previous tasks on both an iPad mini and an iPhone. Depending on the group they were assigned, they first performed all tasks sequentially on the tablet and then all tasks sequentially on the smartphone or vice versa. Thus, we could check the effect of learning the application using firstly a large screen device or a small screen device. None of the participants had used the application before. The interface of each version (iPad or iPhone) of the application was not exactly the same; depending on the device and its screen size each version had a different layout, font size or widgets size, because the application was responsively designed for each device (see Figs. 2, 3).
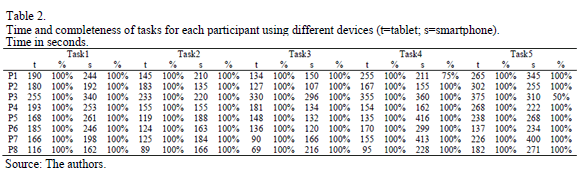
In Table 2 we can see the results for the undertaking of all the tasks by all the participants. Participants 1 to 4 performed the tasks firstly on the tablet (on the iPad mini) and then on the smartphone (the iPhone) while participants 5 to 8 performed all tasks firstly on the smartphone (with the iPhone) and then on the tablet (with the iPad).
]]> We can see that all participants completed 100% of all tasks except Participant 1 who only completed 75% of task 4 using the iPhone and Participant 3 who completed 50% of task 5 also using the iPhone. All times showed in this table were real times taken by each participant. The times of participant 1 and 3 who left the two tasks unfinished were estimated in order to gain an approximate time that they would have needed to complete the task so we could compare them with the rest of times and complete the first group study. In the second group of participants (P5 to P8), all participants fully performed their tasks so we did not need to estimate any times.5.1.1. Task performance measures
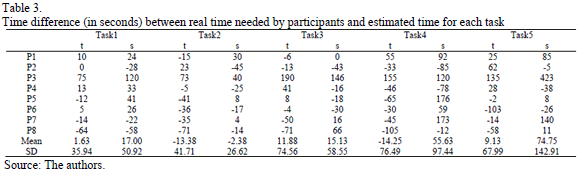
In Table 3 we can see the difference in time spent by each participant in each task and using each device with respect to the times defined for each task's undertaking by the usability team. In general, most participants took less time to perform the tasks using both the tablet and the smartphone. Only Participant 3 required significantly more time while using the tablet instead of the smartphone. This was due to the participant not having enough experience with the use of mobile devices. Participant 8 needed less time to perform all tasks using both the tablet and the smartphone.
Regarding tasks, we can see that Task 4 was the most complex for most participants using a smartphone: three of them needed more than 50% of the estimated time to complete the task (Participant 3 needed 50% extra time, Participant 5 needed 73% extra time and Participant 7 needed 72% extra time). It was a complex task using a previous information search that the participant had undertaken in Task 3, changing this information by adding more data and finally sending one email to a customer. Note that the three above mentioned participants completed this task while Participant 1 was the only one that completed 75% of this task.
Task 5 was also a complex one where the participant had to take a picture with the device, write text and send an email. Only Participant 7 needed 54% extra time than the estimated time to complete this task, while the remaining participants completed this task in the estimated time or less. Note that Participant 3 completed 50% of this task (he would have needed almost twice the time estimated by the usability team to fully complete the task). Therefore it can be considered that this task presents a cognitive load for some users who may consider that they have finished the task when actually they had only completed half of the task.
Nevertheless, all participants completed both Task 4 and Task 5 using the tablet in the estimated time, some of them using far less time than the estimated duration.
Interestingly enough, the most complex task for participants performed on a smartphone (Task 4) was also the task which participants needed less time to complete with the tablet, especially for the group of participants who used the tablet last. This proves that an adequate responsive design and a large screen can greatly improve efficiency in the undertaking of a complex task.
5.2. Efficiency in the undertaking of tasks
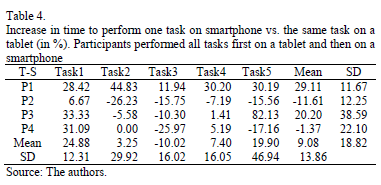
Participants carried out the five tasks on both a tablet and a smartphone. The first group performed first the tasks on a tablet and then on the smartphone. We calculated the time difference to perform each task on the iPhone in comparison to the iPad. In Table 4 we can see the percentage of time that each participant in the first group needed to perform all tasks on an iPhone with regards to the same task on an iPad (data in %). We can see that in general, one user will need around 9% more time to perform all tasks with an iPhone than with an iPad when participants performed all tasks using the tablet first.
]]>
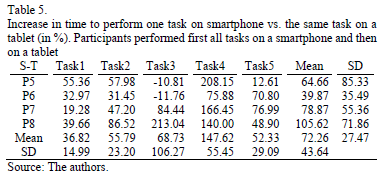
The second group performed the tasks first on a smartphone and then on a tablet. Again, we calculated the time difference to perform each task on the iPhone in comparison to the iPad. In Table 5 we can see the percentage of time that each participant in the second group needed to perform all tasks on an iPhone in comparison to the same task on an iPad (data in %). We can see that generally, a user will need around 72% more time to perform all tasks in an iPhone than on an iPad when users performed all tasks first on a smartphone.
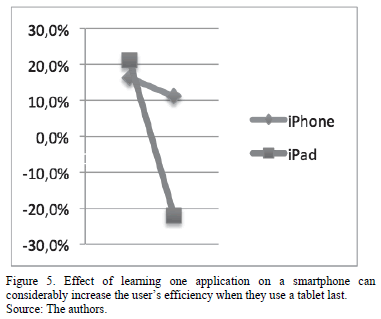
The effect of learning the application on a smartphone implies that participants were much more effective in executing the same tasks on a tablet (a device with larger screen) with which much less scroll was required. We can see that the times it took to undertake the tasks performed with an iPhone are much greater than times of the tasks performed with an iPad. As such, we can say that users who use an iPad are more productive if they have previously learned the application on an iPhone. However, if the users learned an application on a large screen device and then they use that application on a small screen device, they can achieve faster times but not as fast as they achieved with a large screen.
5.3. Efficiency per device
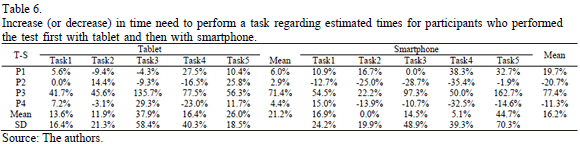
Participants 1 to 4 performed all tasks on a tablet first and then on the smartphone. In Table 6 we can see the increase (or decrease) in time needed to perform all tasks in comparison to the estimated time for each task using each device. Our participants needed on average 21% more time to finish the tasks with a tablet, whereas they needed on average only 16% extra time to perform all tasks with a smartphone. So, they needed on average 5% less time to perform all tasks with the second device when they learned the use of the application on the tablet.
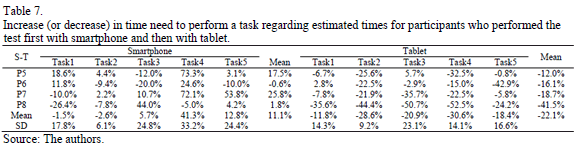
Moreover, participants 5 to 8 performed all tasks on a smartphone first and then on the tablet. In Table 7 we can see the increase (or decrease) in time needed to perform all tasks compared to the estimated time for each task with each device. These participants needed on average 11% more time to finish the tasks with a smartphone, whereas they needed on average only 22% less time to perform all tasks with a tablet. So, they needed on average 33% less time to perform all tasks with the second device when they learned the application on the smartphone.
Therefore, we can conclude that the device that was firstly used to perform the tasks can greatly influence the participants' efficiency. Users who used the tablet first needed 5% less time on average to perform the same tasks than those using the tablet last. However, users who learned the application with the smartphone and then repeated the tasks with the tablet were able to reduce the time required by an average of 33% to perform all tasks. It can be seen that the use of large screen devices can very considerably increase users' efficiency (see Fig. 5)
]]>
5.4. Usability problems detected
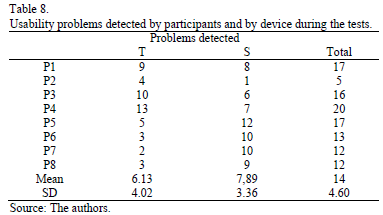
All participant activities were video recorded during testing. Usability problems reported by participants were noted when reviewing the post-test recordings. In Table 8 we can see the number of problems reported by each participant for both the tablet and the smartphone. We can see that the average number of problems reported for tablets was 6.13, while the average number of the problems reported for smartphones was 7.89. We can also see that the participants who performed the tasks primarily with a tablet (P1 to P4) reported more usability problems with this tablet (36) than after testing with smartphone (22). However, participants who performed the tests with the smartphone first (P5 to P8) reported more errors (41) when using the smartphone than when testing with the tablet last (13). Moreover, the most number of problems were reported when using the smartphone first. When these users repeated the tasks with the tablet last, they were more efficient and reported fewer problems.
5.4.1. Types of usability problems detected
We analyzed all the videos recorded with the participants and noted all their usability problems. We prioritized each problem by how critical it was to organize the problems that should be first solved by the development team. We also categorized each problem by severity using the Jeffrey Rubin four-point scale [12] to rank each problem: 4-Unusable, 3-Severe, 2-Moderate, 1-Irritant.
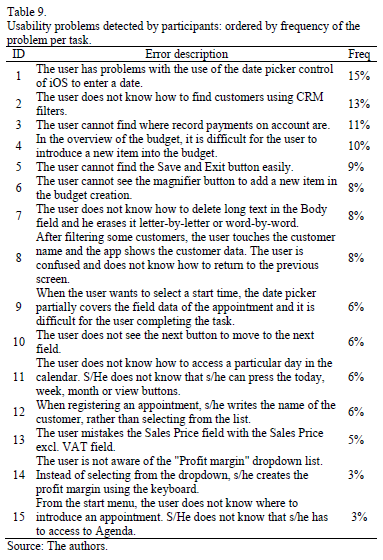
Table 9 shows the main usability problems detected by participants for all tasks and is ordered by the number of times the problem was detected by any participant while undertaking any task (Frequency). The main problems are related to the date picker control of the iOS system and to how to find any field or button to perform a concrete task.
Next, we assigned a severity index to each one of all of these usability problems detected by our participants. We defined two usability problems with a severity index of 3. In both cases the user was not able to find a field to introduce data and so s/he could not accomplish the task in time. In certain cases s/he could not finish the task properly. We marked four usability problems with a severity index of 2, all of them related to problems with the handling of some control (date picker, magnifier button) or with the use the iOS operating system itself. The remaining nine usability problems detected were defined with a severity index of 1 as we considered them to be minor usability problems and normally participants could accomplish the tasks without more problems.
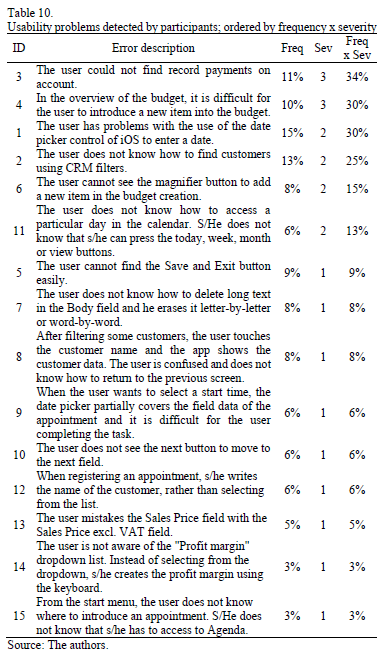
In order to define a list of problems to be solved by the PhotoSolutionPro app development team we calculated a new factor by multiplying the frequency of the usability problem by the severity index assigned. Thus, we obtained a new list with a different order, which can be seen in Table 10. All usability problems are presented in order as per how frequently they were reported and their level of severity. It is our opinion that first problems that should be considered by the development team were those problems with a factor index greater than 10%. So, we recommended that the application development team first solve the six problems relating to the introduction of data into the app.
]]>
5.5. Perceived usability
After finishing their tests, all participants completed the SUS questionnaire in order that the perceived usability of the application was defined. An average of 83.44 (SD = 11.18) was obtained.
We observed that participants who performed the tasks first with the tablet and then with the smartphone obtained a mean score of 82.5 (SD = 8.17), while participants who performed the tasks first with the smartphone and then with the tablet obtained a mean score of 84.34 (SD = 14.91).
As can be seen, the perceived usability for users who first performed tests with a small screen device is greater than if they first used a large screen device. When first using a smartphone, with which the user needs more time to perform all tasks, the results obtained were that the perceived usability of the application was greater than users who performed the tasks first with tablet and later with the smartphone.
6. Conclusion
In this research we observed how the use of large screen devices could improve the user efficacy when they have to accomplish complex tasks.
All users were able to perform all tasks both on a tablet and a smartphone, or they at least thought they had finished their tasks successfully. Only two participants did not completely finish tasks on a smartphone. So, in general, it can be said that complex tasks can be performed on a smartphone, although the same task performed on a large screen device will be executed more efficiently.
Normally a user needs more time to complete a task on a smartphone than the same task in a tablet. This time may increase considerably when the user has to type any text on the device or has to search for information on a small screen device. Users who managed a smartphone first and a tablet later took much less time to perform the tasks on the tablet. When we gave a smartphone first to the users and asked them to perform the tasks, they usually needed the same or lees time than we had estimated, but when they performed the same tasks with the tablet, the learning effect was greater than if the users would have been first trained with a tablet (see Fig. 5)
]]> It can be concluded that one tablet user can be up to 72% more productive on a tablet than on a smartphone. When we asked users to perform the tasks on a smartphone, and then on a tablet, it was observed that users needed much less time to complete all the tasks. The perceived usability of the application is slightly greater when users employed a smartphone for the first time. When a user has to perform a task with a large screen device, s/he normally feels more comfortable and her/his perceived usability of the app will increase. The number of usability problems reported when performing the tasks with a tablet is lower on average than the number reported when performing the tasks with a smartphone. When the users have to perform the tasks first with a smartphone, they report the biggest amount of usability problems.
References
[1] Bangor, A., Kortum, P.T. and Miller, J.T., An empirical evaluation of the system usability scale. Intl. Journal of Human-Computer Interaction, 24 (6), pp. 574-594, 2008. [ Links ]
[2] Bevan, N., International standards for usability should be more widely used. Journal of Usability Studies, 4 (3), pp. 106-113, 2009. [ Links ]
[3] Brooke, J., SUS: A 'quick and dirty' usability scale. Usability evaluation in industry., pp. 189-194, 1996. [ Links ]
[4] Cnet. Tablets buying guide. [Online]. Available at: http://www.cnet.com/topics/tablets/buying-guide/ [ Links ]
[5] Computer monitor buying guide. [Online]. Available at: http://www.digitaltrends.com/buying-guides/computer-monitor-buying-guide/#!BkZYF [ Links ]
[6] Dell'Amico, M., Díaz, J.C.D., Iori, M. and Montanari, R., The single-finger keyboard layout problem. Computers & Operations Research, 36 (11), pp. 3002-3012, 2009. [ Links ]
[7] Dillon, A., Richardson, J. and Mcknight, C., The effects of display size and text splitting on reading lengthy text from screen. Behaviour & Information Technology, 9 (3), pp. 215-227, 1990. DOI: 10.1080/01449299008924238 [ Links ]
[8] Findlater, L. and McGrenere, J., Impact of screen size on performance, awareness, and user satisfaction with adaptive graphical user interfaces. In Proceedings of the SIGCHI Conference on Human Factors in Computing Systems CHI '08, pp. 1247-1256, 2008. [ Links ]
[9] Laptop Buying Guide. 9 Essential Tips, 2014. [Online]. Available at: http://blog.laptopmag.com/laptop-buying-guide [ Links ]
[10] Nielsen, J., Why you only need to test with 5 users, 2000. [Online]. Available at: http://www.useit.com/alertbox/20000319.html [ Links ]
[11] Quinn, J.M. and Tran, T.Q., Attractive phones don't have to work better: Independent effects of attractiveness, effectiveness, and efficiency on perceived usability. In Proceedings of the SIGCHI Conference on Human Factors in Computing Systems. CHI '10. Pp. 353-362, 2010. [ Links ]
]]>[12] Rubin, J. and Chisnell, D., Handbook of usability testing: How to plan, design, and conduct effective tests. John Wiley & Sons. 2008. [ Links ]
[13] Sanchez, C.A. and Branaghan, R.J., Turning to learn: Screen orientation and reasoning with small devices. Computers in Human Behavior, 27 (2), pp. 793-797, 2011. [ Links ]
[14] Sanchez, C.A. and Goolsbee, J.Z., Character size and reading to remember from small displays. Computers & Education, 55 (3), pp. 1056-1062, 2010. [ Links ]
[15] Schmitz, B. and Zwick, C., Designing for small screens. AVA Publishing, 2006. [ Links ]
[16] Ziefle, M., Information presentation in small screen devices: the trade-off between visual density and menu foresight. Applied Ergonomics, 41 (6), pp. 719-723, 2010. [ Links ]
]]>F. Botella, received his MSc. in Computer Science and his PhD. in Computer Science from the University of Alicante, Spain. Currently he is associate professor at the Department of Statistics, Mathematics and Computer Science of the Miguel Hernández University (MHU) in Elche, Spain, where he joined in 1997. He has also been a member of the Center of Operations Research University Institute of the MHU since 1999. He has been Director of this Institute from 2011. He has also led the Webdecision Research Group at the MHU since 2007. His research interests are focused on HCI, UX, Usability, UCD, Personalization and e-Health mobile apps.
J. P. Moreno, received his MSc. in Research in Industrial Technologies and Telecommunication at the Miguel Hernández University (MHU) in Elche, Spain. He is currently a PhD. student on the Doctoral Program in Statistics, Optimization and Applied Mathematics at the Miguel Hernández University, Spain. He is also part-time professor at the Department of Statistics, Mathematics and Computer Science at Miguel Hernández University. His research interests are focused on HCI, mobile usability and UCD.
A. Peñalver, received his MSc. in Computing Science and his PhD. from the University of Alicante, Spain. He works as an assistant professor at the Department of Statistics, Mathematics and Computer Science of the Miguel Hernández University (MHU), Spain. He is the leader of the Human Computer Interaction and Pattern Recognition Group at the Center of Operations Research University Institute in MHU and he is also a member of the Mobile Vision Research Lab group at Alicante University, Spain. He was also Deputy Director of the Center of Operations Research University Institute of the MHU. His research interests are focused on HCI, Usability, mobile apps, Information Theory and Statistical Pattern Recognition.
]]>