quality systems. This research demonstrates the superiority of variable parameters quality monitoring architectures over traditional statistical process monitoring tools.]]>
tradicional. Esta investigación demuestra la superioridad de sistemas de calidad vasados en esquemas con parámetros variables comparado con las técnicas tradicionales de control estadístico de procesos.]]>
Statistical performance of control charts with variable parameters for autocorrelated processes
Desempeño estadístico de cartas de control con parámetros variables para procesos autocorrelacionados
Oscar Oviedo-Trespalacios a,b & Rita Peñabaena-Niebles a
a Departamento de Ingeniería Industrial, Universidad del Norte, Barranquilla, Colombia. ooviedot@gmail.com
b Centre for Accident Research and Road Safety - Queensland (CARRS-Q), Institute of Health and Biomedical Innovation (IHBI), Queensland University of Technology (QUT), Kelvin Grove, Australia
Received: February 25th, 2015. Received in revised form: February 29th, 2016. Accepted: March 9th, 2016.
]]>This work is licensed under a Creative Commons Attribution-NonCommercial-NoDerivatives 4.0 International License.
Abstract
Chemical process and automation of data collection for industrial processes are known to result in auto-correlated data. The independence of observations is a basic assumption made by traditional tools that are used for the statistical monitoring of processes. If this is not adhered to then the number of false alarms and quality costs are increased. This research considers the use of variable parameters (VP) charts in the presence of autocorrelation. The objective is to determine the impact on the detection velocity and false alarms of different degrees of autocorrelation and their interaction with process conditions-the aim being to effectively select parameters. The VP chart showed improvements in its performance when detecting large average runs as the autocorrelation coefficient increased in contrast with the traditional variable sample interval (VSI) and  quality systems. This research demonstrates the superiority of variable parameters quality monitoring architectures over traditional statistical process monitoring tools.
Keywords: Autocorrelation, Variable parameters control charts, Statistical Quality Monitoring, Simulation, Quality
Resumen
Procesos químicos y automatización en la recolección de datos en procesos productivos son reconocidos por producir datos autocorrelacionados. La independencia de las observaciones es uno de los supuestos básicos de las herramientas tradicionales para el monitoreo estadístico de procesos, omitirlo hace que se incremente el número de falsas alarmas y los costos de calidad. Esta investigación considera a través de técnicas de simulación, la utilización de cartas de control con parámetros variables (VP) en presencia de datos autocorrelacionados con el objetivo de determinar el impacto en la velocidad de detección y falsas alarmas de diferentes grados de autocorrelación y su interacción con diferentes condiciones de proceso como la varianza y longitudes del corrimiento de la media, en búsqueda de realizar una selección efectiva de parámetros. La carta VP mostro mejoras en su desempeño en la detección de grandes corrimientos de media en la medida que incrementaba el coeficiente de auto correlación y sostenidamente mejores resultados en una mayor cantidad de condiciones de simulación, en contraste al sistema VSI y tradicional. Esta investigación demuestra la superioridad de sistemas de calidad vasados en esquemas con parámetros variables comparado con las técnicas tradicionales de control estadístico de procesos.
Palabras clave: Autocorrelación, Cartas de control con Parámetros Variables, Monitoreo Estadístico de la Calidad, Simulación, Calidad
1. Introduction
]]> Traditional tools used in the statistical monitoring of processes assume no correlation between consecutive observations of the quality characteristic being controlled. This assumption is violated if there is a set of data that shows a trend towards moving in moderately long "runs" to both sides of the mean [1]; this is known as memory process. Specifically, the effect of violating this assumption in traditional control charts such as the chart will produce an increase in out of control false alarms [2]. Similarly, if the correlation is negative, it is possible that the control chart is not detecting disturbances or assignable causes different to the natural variation of the process [3].
 Barr [4] demonstrated that correlation between data means that Shewhart control charts are ambiguous tools to identify assignable causes. This means that it is necessary to invest efforts into their adjustment or to develop new monitoring alternatives. The strategies that were designed to handle autocorrelation in productive processes include five procedures: (i) Modifying the traditional control chart parameters, (ii) Adjusting time series models to use normal residuals in typical control charts, (iii) Applying transformations that correct the correlation in the data, (iv) Forming an observation vector that facilitates the application of multivariable techniques, and (v) Applying artificial intelligence techniques to discover patterns in the data.
The first study on the procedure of varying parameters in control charts was undertaken by Reynolds, et al. [5], who suggested modifying the sampling interval (h) according to the performance observed for the process. The second parameter considered in the literature was the size of the samples (n), which was investigated by Prabhu, et al. [6], and the factor that determines the width of the control limits (k) that was studied by Costa [7]. Similarly, some models, such as the one proposed by Mahadik [8], include the warning limit coefficient (w). Initially, each of these variables was considered independently, and subsequently, there have been schemes in which the sampling interval and size of the sample change simultaneously. The concept of varying all the parameters simultaneously can be attributed to Costa [7], who used possible maximum and minimum values to adjust all the parameters based on information of the previous sample; this type of chart is currently known as an adaptive chart or a variable parameter (VP) chart.
The present research work aims to use simulation to evaluate the robustness of a VP chart process-control system in scenarios in which observations are autocorrelated. In order to do so, different design parameters in the control chart will be considered, including the following: control coefficients; sample size and interval; and process conditions such as the variance, autocorrelation coefficient, and run length.
VP control charts require the use of new performance indicators, given that the average run length (ARL), which is the most frequently used indicator, is not adequate for adaptive charts because it has no constant sampling intervals and sample sizes. Accordingly, the following indicators were used to evaluate the statistical performance of the VP chart: the average number of observations until a signal is emitted (ANOS), the average time between the point in which an average run occurs and the emission of a signal (AATS), and the average number of false alarms per cycle (ANFA). Including a metric for false alarms improves the performance evaluation proposals of VP charts in environments with autocorrelated observations because the literature that has been revised only lists comparisons based on the detection velocity of an average run.
This paper follows a structure that primarily includes a presentation of the variable parameter chart model. This is followed by a historical review of the studies that are dedicated exclusively to analyzing the statistical performance of control chart models with variable parameters in environments with univariate data with correlations between observations. Next, the characteristics of the autocorrelated quality variables are presented, and we describe the methodology used to evaluate the performance of VP charts with different process conditions and design parameters for the control chart in the presence of autocorrelation. Finally, we present the results of the simulation, making a comparison between the chart and the VSI chart, and then state our conclusions.
2. Control Charts with Variable Parameters (VP)
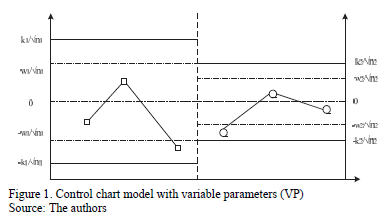
When designing a VP chart, as well as a traditional chart, parameters such as the sample size (n), sampling interval (h), and control limit and warning limit coefficients (k, w) must be taken into account. These parameters vary between two values, minimum and maximum, the selection of which reduces or increases the strictness of the control. Consequently, the selection of the parameters must fulfill the following conditions: n1<n2, h1>h2, w1>w2 y k1>k2, in such a manner that the scenario with values (n1, h1, w1, k1) corresponds to the relaxed control and the scenario with values (n2, h2, w2, k2) corresponds to the strict control.
The VP chart is divided into three different regions: the central region that is bounded by the lower warning limit and the upper warning limit (LAI, LAS, for their initials in Spanish); the warning region that is bounded by the areas between the lower control limit up to the lower warning limit (LCI, LAI, for their initials in Spanish) and the upper warning limit up to the upper control limit (LAS, LCS, for their initials in Spanish); and the action region that is bounded by the values that surpass the upper control limits (LCS, for its initials in Spanish) and the values that are lower than lower control limit (LCI) (see Fig. 1).
]]>
The decision policy states that the position in which each sample falls determines which set of control parameters (relaxed or strict) will be used in the following sample. Equation (1) follows:.
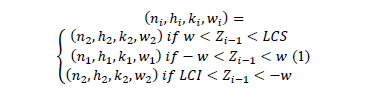
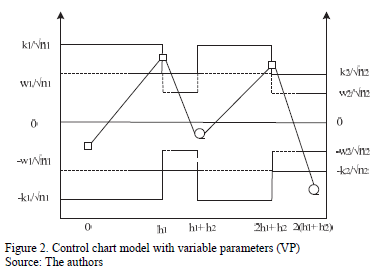
On the one hand, if the point falls in the central region, control is reduced, the sample size must be small n1, and the sampling interval and control and warning coefficients must be large: h1, k1, and w1. On the other hand, if the point falls in the warning region, control is increased, resulting in a large sample size n2, and the sampling interval and control and warning coefficients must be small: h2, k2, and w2 (see Fig. 2). Finally, if the point falls in the action region, the possible occurrence of an assignable cause must be investigated, and if pertinent, an intervention must be initiated.
To implement the VP chart, a statistical design must be used by selecting parameters that optimize the statistical properties of interest (see equation 1). However, when it is preferred that the costs associated with the control process are low, without taking into account the loss of statistical characteristics of the process, we refer to this as the economical design of a control chart. When it is desirable to select parameters that balance the statistical behavior and costs of the process, we are referring to an economical-statistical design of a control chart. Consequently, the type of design is based on what is being sought: cost reduction and high performance in detecting imbalances in the process or equilibrium between these two variables [9, 10]. Identically to the traditional chart, the VP chart emits a signal to stop the process when an observation is found to be outside of the control limits [7].
3. Literature Review
A limited number of published studies address the problem of autocorrelation in the performance of charts with variable parameters. Among the first studies is the one conducted by Reynolds, et al. [11], which uses the efficiency shown by control chart schemes with a variable sampling interval (VSI) as a reference to detect changes in the mean more quickly than a fixed model does, thereby exploring the impact of the presence of autocorrelation on the chart performance. This study was motivated by the assumption that the correlation between observations would be more evident in this type of chart when having shorter sampling intervals than in those with the traditional scheme. Experimentally, a first order, autoregressive, temporal, series model AR (1) was selected to model observations; subsequently, with the help of a Markovian process, the properties of the VSI scheme were contrasted with those of the traditional scheme. As a result, as the autocorrelation levels increased, no significant differences were found between the performance of the variable scheme and those of the traditional scheme.
Prybutok, et al. [12], compared the response time of the fixed scheme of traditional charts with that of the proposal of control with VSI proposed by Reynolds, et al. [5] in the presence of autocorrelation. In their research, they explored the impact of utilizing a policy of pre-establishing control limits based on theoretical parameters that are typically determined as the three-sigma limits (sx) for data that follow a standard normal distribution. This was contrasted with a policy based on calculating control limits that understood the first 25 samples according to Montgomery [13]. The limits calculated are based on the theoretical relationship between the autocorrelation process and its (sx) according to the model proposed by Wardell, et al. [14]. These authors explain how s depends, for certain types of autocorrelated processes, on the parameter f and on the standard deviation (sa) [see Equation (2)]. The use of values different from the sa values in the control charts was also considered a method of adjusting the chart to the number of false alarms detriment.

The results of the present study reveal that adjusting the control limits in a fixed sampling scheme for large values of f helps to reduce the rate of false alarms. With moderate autocorrelation levels, the pre-established process limits demonstrate a better performance, identifying when the process is out of control in contrast with the calculated limits; however, when the process is under control, the result that comes from using a predetermined scheme shows a considerable increase in the number of false alarms. In processes with high levels of correlation between observations, the pre-established limits are more effective in maintaining a low rate of false alarms but are inefficient in detecting changes in the mean. In general, a variable sampling scheme is beneficial for statistical monitoring because it improves the average time before emitting a stoppage signal when the process is under control.
Zou, et al. [15] indicated years later that the literature using charts with variable parameters is scarce; specifically, they mention that there is still work to be undertaken on the dependence of the correlation between observations on their distance at the time of sampling This is because, in a VSI scheme there is uncertainty regarding the interval length and also because, in many cases, it does not match the natural periods of the process. In addition, these authors state that very little is known about the level of advantage offered by such a scheme, and there is still no correct way of estimating the control parameters despite the impact they have in determining the power of the charts. This study establishes the VSI chart parameters to take samples in fixed time periods, limiting the study to cases in which the same power of the original scheme was registered with independent data. It is, therefore, possible to compare their performance with the process modeled through an AR(1) process. The results show that VSI charts with a fixed time and sampling rate, despite providing implementation benefits, do not show improvements in the monitoring of autocorrelated processes within the levels evaluated 0.4 < f < 0.8.
Lin [16] evaluated the performance of the VP control charts in the presence of autocorrelated observations, through a comparative study between the traditional  chart, VSI, VP, and the cumulative sum chart (CUSUM) in an AR(1) process. The results indicate that, in principle, high levels of autocorrelation require more time and samples to detect changes in the process mean. Of the different chart schemes studied (traditional, VSI, and VP), the VP chart has a substantially lower AATS to detect small changes in the mean when the correlation is not very high. This is because it appears to become ineffective as the variable parameters increase.. The CUSUM scheme, in contrast with the VP scheme, has a better detection capacity and also exhibits the lowest sampling costs for the detection of small changes. When the autocorrelation increases, this advantage becomes more important. However, to detect large changes in the mean, the VP chart is generally faster than the CUSUM. The correlation levels considered in this study were 0.4 < f < 0.8, and the running magnitude was 0.5 < d < 2.
Recently, Costa and Machado [17] developed comparisons between the detection velocities of an out-of-control, first-order, autoregressive process AR(1) whilst following a Markovian approach of a VP chart and a double sampling chart scheme. Changes in the mean between 0.5 < d < 2.0 and correlation levels of f=0.4 and f=0.8 were considered. The results obtained reveal that: i. With high f and variance proportion levels due to the random average y that is defined in Equation (3), the use of VP schemes is not justified because the change in the temporal detection efficiency of an assignable cause in the process is marginal; ii. The control chart with variable parameters has a better performance when the values of the small samples are used to choose the size of the next sample in the process instead of the state of the process; and iii. The double sampling scheme works better when the process never sends signals before proceeding to the second stage of sampling.

4. Autocorrelated quality variables
The usual assumption that generally justifies the use of control chart systems is that the data generated by the process of the quality characteristic of interest X are normally distributed and independent, with a mean µ and known variance s2 [11]. For this study, we will operate under the assumption that there is a correlation between the observations. In order to model it, a temporarily discretized random variable has to be considered to describe t-th element is contained in the following Equation (4).

 is a stochastic process
  is a family of indexed random variables, where
  is the set of discrete indices, (e.g.,
  ). In the model of control charts, this implies that
  contains all the discrete points in time t [18].
 We refer to autocorrelation when the linear association between observations of the process is significant. For processes in which the mean and covariance is finite and independent of time and  , observations are generated at a time
  , the autocorrelation in the delay k is given by Equation (5) [19].

Autoregressive models are frequently used in the literature to represent the correlation of productive processes. Gilbert, et al. [19] demonstrated that there are no systematic works cited in the literature that directly address the monitoring of different autoregressive models. This approach is characterized by the fact that the behavior of a variable in a specific moment in time depends on the past behavior of the variable. Therefore, the value taken by the variable at time t can be written linearly with the values taken by the variable at times t-1, t-2, t-3…, t-p. In this scheme, p in the term AR(p) indicates the delays taken into account to describe or determine the value of xt. If the dependency relationship is established with the p previous delays, the process will be first order autoregressive AR(1), according to Equation (6).

where  is a white noise process, with a mean of 0, a constant variance of
  , and zero covariance, and
  corresponds to the autoregressive parameter.
5. Methodology
This study was conducted by simulation to compare the performance of VP charts in monitoring autocorrelated processes under different process conditions and design control chart parameters. The following performance indicators were used: the AATS, ANOS out of control, and the ANFA. To develop the simulations, the methodology was organized as follows:
5.1. Modeling of the AR(1) series
]]> To simulate the autocorrelation of the process through an autoregressive model, we take into account the considerations made by Reynolds, et al. [11] and Lin [20], in which observation can be written as
  where
where  is the main random process of the sample taken0 in time
  and
and  is the random error. To include an AR(1) process, the expression developed in (6) is included in Equation (4), resulting in:
In Equation (7),  represents the correlation level between and
  . The paramter
  corresponds to the global mean of the process, specifically,
  . The variable
  corresponds to a random shock that is normally distributed with a mean of 0 and a variance of
  and which is independent from other sources of random error. The initial value of the mean
  is assumed to be normally distributed with a mean and variance
  . Reynolds, et al. [11] demonstrated that follows a normal distribution with mean and variance
  . As a result, the distribution of has mean and variance
  . Similarly, Lu and Reynolds [21] considered that can be seen as the long-term variability, while
  is a combination between the short-term variance and measurement errors. Subsequently, Lin [20] simplifies the model by assuming a ratio
  as the proportion of the process variance due to the random mean , where
  . With this step, we find that the proportion of the variance due to the random error is
 .
.
5.2. Definition of the process parameters
For this study, the process parameters considered were the autocorrelation coefficient, the proportion of the variance of the process due to random mean , the occurrence of the assignable cause, and the average run length. The autocorrelation coefficient with which we will work is positive. This follows the recommendation by Reynolds, et al. [11] regarding the scarce presence of processes with a negative correlation between observations in the manufacturing industry. Because the number of simulation runs must remain computationally manageable, the values of the autocorrelation coefficient were limited to  = 0.2, 0.4, 0.6, 0.8, 0.99, ensuring that a wide range of values were included. The proportions of the process variance due to random mean used follow the Lin's [20] recommendation , who defined three levels:
  = 0.2, 0.5, 0.9.
The occurrence of the assignable cause or the point at which the mean of the process suffers a run of known magnitude  , is determined randomly through an exponential distribution with mean
  . It is noteworthy that the model of a single assignable cause with a known effect does not respond to real process conditions; however, it provides us with an acceptable and quasi-optimal approximation to carry out the economic and statistical designs in a more realistic process that is subject to multiple assignable causes [22].
The running length uses changes in the absolute value , in an attempt to detect increments and decreases in the value of the process mean. This is allowed because the formulation of the  control charts for both sides of the process mean is exactly the same [22]. Increments of d = 0.5sx, 1sx, 2sx, 3sx are appropriate to establish patterns of change in the behavior; in addition, they take advantage of the values proposed by Prybutok, et al. [12] by allowing the evaluation of small changes in the mean (0.5sx) and widening the spectrum of values considered by Lin [20], who changed the values without considering the natural variance of the process. Particularly, in this study, we will consider run lengths of 0.5sx as low, 1sx medium, 2sx as high, and 3sx as very high.
5.3. Defining the chart parameters
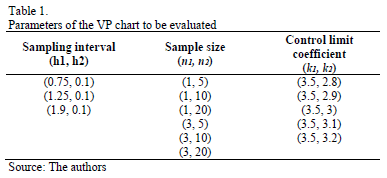
The interest of this study is to evaluate the impact of the autocorrelation coefficient on the performance of the VP chart. The objective is to offer a guide to its performance under certain combinations of chart parameters. To select the levels over which the simulation will be developed, we took into account the study performed by Lin [20]. The values and combinations of h1, h2, n1, n2, k1, and k2 are listed in Table 1.
]]> Mathematically, we can express the control chart according to equations (8-9), where is the mean of the process when it is under control,
  is the standard deviation of
  ,
,  is the control limit parameter, and
  the warning limit parameter with sample size
  , where
  for the case

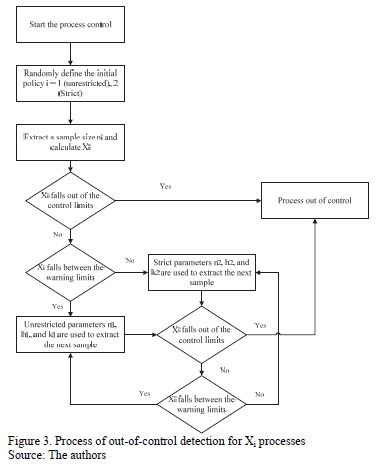
Selecting the initial policy to be strict or relaxed is conducted randomly to avoid the effect it might have on the detection capacity of the chart in the presence of false alarms.
5.4. Performance indicators
We take the model proposed by Lin [16] and Lin [14], which uses the average number of observations until a signal is emitted (ANOS) and the average adjusted time calculated from the point in which an average run occurs and a signal is emitted (AATS) when the process is out of control as performance metrics for variable parameter schemes. An important contribution of this research, in contrast with the work undertaken by Lin [14], is that the values of false alarms are not maintained constant and that they are considered a response variable of the simulations. To that end, we take the model by Franco, Costa, and Machado (2012), which records the average number of false alarms per cycle (ANFA). In general, it is desirable for ANFA values to be small in order to reduce the frequency of false alarms [20].
5.5. Simulation conditions
The simulation was executed by programming an application in MATLAB 8.1 and programming 32,400 runs, for each combination of the autocorrelation coefficient/proportion of the process variance due to random mean m;i/sampling interval/sample size/control coefficient/run length, following the logic described in Fig. 3. This means a new data series is simulated five times in each of the experimental conditions and stopped until the chart emits a signal to warn that the process is out of control and recording false alarms. Finally, the values of AATS, ANOS out of control, and ANFA are calculated as criteria to measure the performance of the control chart.
6. Results and discussion
]]> The results for AATS, ANOS out of control, and ANFA for each autocorrelation coefficient/proportion of the process variance due to random mean m;i/sampling interval/sample size/control coefficient/run length were calculated. The chart performance was evaluated by distinguishing between the different run lengths, considering the impact of increments in the coefficient of correlation and the different levels of variance. The appendix shows the results for different simulation conditions.6.1. Short run length d=0.5sx
The chart's detection capacity improves as the autocorrelation coefficient increases because the AATS and ANOS values decrease. However, the rate of false alarms increases with the coefficient of autocorrelation, which is consistent with the results of tests conducted by Harris and Ross [23], Mastrangelo [2], and Barr [4]. As the proportion of the process variance due to random mean increases, the AATS and ANOS results decrease while the ANFA increases. Regarding the VP chart parameters, the results with larger n2 values (e.g., n2 = 20) and lower k2 values (e.g., k2 = 2.8 and 2.9) have the lowest AATS and ANOS. The highest ANFA values were found with lower k2 values (e.g., k2 = 2.8, 2.9, and 3.0).
6.2. Medium run length d=1sx
The detection capacity of the chart is not affected by increments in the autocorrelation coefficient. However, the rate of false alarms was increased as the autocorrelation coefficient increased. The highest value for the process variances due to the random mean (e.g., y = 0.9) is associated with a higher AATS, ANOS, and ANFA. There appears to be no difference between y = 0.1 and y = 0.5. The prevalence of the VP chart's better performance was found for (h1, h2) values = (0.75, 0.1), higher n2 values (e.g., n2 = 20), and lower k2 values (e.g., k2 =2.8, 2.9, 3.0). The highest ANFA values were found for lower k2 values (e.g., k2 = 2.9 and 3.1) and (n1, n2) = (1, 20).
6.3. High run length d=2sx
The detection capacity of average runs of the VP chart and the presence of false alarms exhibits a growing trend because the autocorrelation coefficient and the process variance increase due to the random mean . The design parameters of the VP chart with the best performance in AATS and ANOS were (h1, h2) = (0.75, 0.1) and n1 = 3. Low ANOS values were also found [(h1, h2) = (1.25, 0.1) and n1 = 3]. The highest ANFA values were found for (h1, h2) = (1.9, 0.1), n1 = 1 and the lowest k2 values (e.g., k2 = 2.8, 2.9).
6.4. Very high run length d=3sx
The detection capacity of the chart was not affected by autocorrelation coefficient increments and the proportion of the variance due to random mean ; however, the ANFA did exhibit increments. The prevalence of better performance of the VP chart was found for (h1, h2) values = (0.75, 0.1) and n1 = 3, and the same result was found for the high run length case. The number of false alarms increased with h1 values = 0.75 and 1.25, (n1, n2) = (3, 20) and h2 = 2.8 y 3.
6.5. Impact of the Autocorrelation in the VSI and  Charts
chart, the increments in autocorrelation do not improve performance in terms of the AATS and ANOS out of control; however, there is a tendency to increase false alarms. Better chart performances the are exhibited in low y levels. With medium, high, and very high run lengths (e.g., d = 1sx, 2sx, 3sx), the performance of the VSI chart appears not to be affected by increments in the autocorrelation coefficient for any of the metrics being studied (AATS, ANOS, and ANFA). This phenomenon also occurs in the  chart for high and very high run lengths (e.g., d = 2sx, 3sx); however, for a value of d = 1sx, the chart improves its performance (AATS and ANOS) and increases the ANFA as the autocorrelation coefficient increases.
In the chart for the cases with d = 0.5sx and 3sx, the proportion of the variance causes a reduction in performance in terms of the ANFA, while it has no effect on the AATS and ANOS. In contrast, the VSI chart for the intermediate level of y exhibits the worst performance. The best results for all the conditions simulated for the VSI chart were obtained with the combination of sampling intervals (h1, h2) = (0.75, 0.1).
6.6. Performance comparison between the VP, VSI and charts
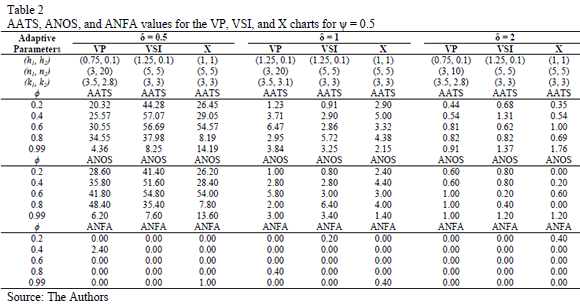
To evaluate the statistical performance of the VP chart relative to other traditionally proposed schemes in the literature, we contrast its performance in terms of the AATS, ANOS out of control, and ANFA under different levels of autocorrelation and run length (see Table 2). The results show how the increase in the autocorrelation coefficient of the process negatively affects the chart performance. However, with an elevated autocorrelation level of 0.99, there appears to be no negative impact in the performance of the chart, and in the in the case of detection of short runs d = 0.5sx, it appears to improve its power.
The VP chart consistently exhibits better performance compared with traditional VSI and schemes. The VP chart registers its best performance for large runs using d = 2sx. In general, it is possible to observe the superiority of the adaptive schemes over fixed monitoring schemes.
7. Results and discussion
The VP chart is presented in this article as an alternative to monitor processes with autocorrelated data. For that purpose, we developed an experiment based on simulation, considering different process conditions and control chart parameters in order to evaluate their performance. During the data monitoring, it was observed that the chart works better with larger runs using d=1sx. In addition, it was demonstrated that the VP chart exhibits better performance indicators when the data present low autocorrelation (e.g., r= 0.2) and a higher proportion of the process variance due to the random mean m;_i (e.g., r= 0.9).
The VP chart designed for autocorrelated data proved to be a statistically good alternative to monitor processes showing autocorrelation. The authors suggest new studies should be conducted that focus on the design of detection policies that enable this type of chart to detect changes in the mean more effectively.
]]> In contrast with the VP andcharts, the VSI chart exhibited the best performance in terms of the absolute value of AATS and ANOS in conditions with elevated correlation coefficients for observations with a larger number of simulation conditions.. Similarly, the VP chart appears to be a better monitoring alternative compared with the traditional chart in environments with high autocorrelation levels.
8. Conclusions
This paper has shown that high levels of autocorrelation can have a significant effect on the performance of control charts. When autocorrelation is present, traditional control chart methodology should not be applied without modification. The VP and VSI Charts performed better than traditional x charts. The VSI is among these two the recommended charts for high correlation.
For future research, we suggest the use of techniques to evaluate the individual impact of each of the factors used to determine the best combinations that help optimize statistical performance and minimize false alarms. Recent studies have showed the effectiveness of combining optimization techniques and simulated systems [24]. It is also relevant that the study of other data models is still scarce in the literature and may provide important research opportunities.
Acknowledgement
The authors are grateful for the financial support that the Colombian Research Council COLCIENCIAS granted to this work, project 121552128846 under contract 651 2011.
References
]]>[1] Montgomery-Douglas, C., Engineering Statistics., 2011. [ Links ]
[2] Mastrangelo, C.M., Statistical Process Monitoring of Autocorrelated Data. Arizona State University, 1993. [ Links ]
[3] Wieringa, J.E., Statistical process control for serially correlated data, 1999. DOI: 10.1002/cjce.5450690106 [ Links ]
[4] Barr, T.J., Performance of quality control procedures when monitoring correlated processes. Thesis. School of Industrial and Systems Engineering, Georgia Institute of Technology, Atlanta, USA, 1993. [ Links ]
[5] Reynolds, M.R., Amin, R.W., Arnold, J.C. and Nachlas, J.A., Charts with variable sampling intervals, Technometrics, 30, pp. 181-192, 1988. DOI: 10.1080/0040 1706.1988.10488366 [ Links ]
[6] Prabhu, S., Runger, G. and Keats, J., X chart with adaptive sample sizes, The International Journal of Production Research, 31, pp. 2895-2909, 1993. DOI: 10.1080/00207549308956906 [ Links ]
[7] Costa, A.F., X charts with variable parameters, Journal of Quality Technology, 31, pp. 408-416, 1999. [ Links ]
[8] Mahadik, S.B., X charts with variable sample size, sampling interval, and warning limits, Quality and Reliability Engineering International, 29, pp. 535-544, 2013. DOI: 10.1002/qre.1403. [ Links ]
[9] Penabaena-Niebles, R., Oviedo-Trespalacios, O., Ramirez, K. and Moron, M., Statistical-economic design for variable parameters control chart in the presence of autocorrelation, Revista Iberoamericana de Automatica e Informática Industrial, 11, pp. 247-255, 2014. DOI: 10.1016/ j.riai.2014.02.007 [ Links ]
[10] Peñabaena-Niebles, R., Oviedo-Trespalacios, O., Cuentas-Hernandez, S. y García-Solano, E., Metodología para la implementación del diseño económico y/o estadístico de cartas de control X-barra con parámetros variables (VP), DYNA, 81(184), pp. 150-157, 2014. [ Links ]
[11] Reynolds, M.R., Arnold, J.C. and Baik, J.W., Variable sampling interval X charts in the presence of correlation, Journal of Quality Technology, 28, pp. 12-30, 1996. [ Links ]
[12] Prybutok, V.R., Clayton, H.R. and Harvey, M.M., Comparison of fixed versus variable samplmg interval shewhart control charts in the presence of positively autocorrelated data, Communications in Statistics - Simulation and Computation, 26, pp. 83-106, 1997. DOI: 10.1080/036109 19708813369. [ Links ]
]]>[13] Montgomery, D.C., Introduction to statistical quality control: John Wiley & Sons, USA, 2013. [ Links ]
[14] Wardell, D.G., Moskowitz, H. and Plante, R.D., Control charts in the presence of data correlation, Management Science, 38, pp. 1084-1105, 1992. DOI: 10.1287/MNSC.38.8.1084. [ Links ]
[15] Zou, C., Wang, Z. and Tsung, F., Monitoring autocorrelated processes using variable sampling schemes at fixed-times, Quality and Reliability Engineering International, 24, pp. 55-69, 2008. DOI: 10.1002/qre.86. [ Links ]
[16] Lin, Y.-C., The variable parameters control charts for monitoring autocorrelated processes, Communications in Statistics-Simulation and Computation, 38, pp. 729-749, 2009. DOI: 10.1080/03610910802645339. [ Links ]
[17] Costa, A.F.B. and Machado, M.A.G., Variable parameter and double sampling charts in the presence of correlation: The Markov chain approach, International Journal of Production Economics, 130, pp. 224-229, 2011. DOI: 10.1016/J.IJPE.2010.12.021. [ Links ]
]]>[18] Del Castillo, E., Statistical process adjustment for quality control. Wiley, New York, USA, 2002. [ Links ]
[19] Gilbert, K.C., Kirby, K. and Hild, C.R., Charting autocorrelated data: Guidelines for practitioners, Quality Engineering, 9, pp. 367-382, 1997. DOI: 10.1080/08982119708919057. [ Links ]
[20] Lin, Y.-C., The variable parameters control charts for monitoring autocorrelated processes, Communications in Statistics - Simulation and Computation, 38, pp. 729-749, 2009. DOI: 10.1080/03610910802645339. [ Links ]
[21] Lu, C.W. and Reynolds, M. R., EWMA control charts for monitoring the mean of autocorrelated processes, Journal of Quality Technology, 31, pp. 166-188, 1999. [ Links ]
[22] Tagaras, G. and Nikolaidis, Y., Comparing the effectiveness of various Bayesian X control charts, Operations Research, 50, pp. 878-888, 2002. DOI: 10.1287/OPRE.50.5.878.361. [ Links ]
]]>[23] Harris, T.J. and Ross, W.H., Statistical process control procedures for correlated observations, The Canadian Journal of Chemical Engineering, 69, pp. 48-57, 1991. DOI: 10.1002/cjce.5450690106. [ Links ]
[24] Oviedo-Trespalacios, O. y Peñabaena, R.P., Optimización de sistemas simulados a través de técnicas de superficie de respuesta, Ingeniare. Revista Chilena de Ingeniería, 23, pp. 421-428, 2015. [ Links ]
O. Oviedo-Trespalacios, received his BSc. in Industrial Engineering in 2006, and his MSc. in Industrial Engineering in 2013, both from the Universidad del Norte, Barranquilla, Colombia. From 2012 to 2014, he worked as full professor in the Industrial Engineering Department, Division of Engineering, Universidad del Norte, Barranquilla, Colombia. He is currently a Researcher Officer in human factors engineering applied to road safety at the Centre for Accident Research and Road Safety - Queensland (CARRS-Q), the Institute of Health and Biomedical Innovation (IHBI), and Queensland University of Technology (QUT), Australia. His research interests include: Traffic safety, statistical methods, human factors, cognitive engineering and industrial safety. ORCID: 0000-0001-5916-3996
R. Peñabaena-Niebles, received her BSc. in Industrial Engineering in 1995, and her MSc. degree in Industrial Engineering in 2004 from the Universidad del Norte, Barranquilla, Colombia. She has an MSc degree in Industrial and Systems Engineering in 2013, from the University of South Florida (USF), USA and a PhD in Civil Engineering in 2015, from the Universidad de Cantabria, Santander, Spain. She is currently a full professor in the Industrial Engineering Department, Division of Engineering, Universidad del Norte, Barranquilla, Colombia. Her research interests include: Traffic engineering, industrial statistics, data mining and quality control. ORCID: 0000-0003-4227-3798
]]>