<?xml version="1.0" encoding="ISO-8859-1"?><article xmlns:mml="http://www.w3.org/1998/Math/MathML" xmlns:xlink="http://www.w3.org/1999/xlink" xmlns:xsi="http://www.w3.org/2001/XMLSchema-instance">
<front>
<journal-meta>
<journal-id>0012-7353</journal-id>
<journal-title><![CDATA[DYNA]]></journal-title>
<abbrev-journal-title><![CDATA[Dyna rev.fac.nac.minas]]></abbrev-journal-title>
<issn>0012-7353</issn>
<publisher>
<publisher-name><![CDATA[Universidad Nacional de Colombia]]></publisher-name>
</publisher>
</journal-meta>
<article-meta>
<article-id>S0012-73532016000400011</article-id>
<article-id pub-id-type="doi">10.15446/dyna.v83n198.49930</article-id>
<title-group>
<article-title xml:lang="en"><![CDATA[New robust capability ratios approaches for quality control]]></article-title>
<article-title xml:lang="es"><![CDATA[Nueva propuesta de índices de capacidad robustos para el control de la calidad]]></article-title>
</title-group>
<contrib-group>
<contrib contrib-type="author">
<name>
<surname><![CDATA[Naya]]></surname>
<given-names><![CDATA[Salvador]]></given-names>
</name>
<xref ref-type="aff" rid="A01"/>
</contrib>
<contrib contrib-type="author">
<name>
<surname><![CDATA[Devia-Rivera]]></surname>
<given-names><![CDATA[Andrés]]></given-names>
</name>
<xref ref-type="aff" rid="A02"/>
</contrib>
<contrib contrib-type="author">
<name>
<surname><![CDATA[Tarrío-Saavedra]]></surname>
<given-names><![CDATA[Javier]]></given-names>
</name>
<xref ref-type="aff" rid="A01"/>
</contrib>
<contrib contrib-type="author">
<name>
<surname><![CDATA[Flores]]></surname>
<given-names><![CDATA[Miguel]]></given-names>
</name>
<xref ref-type="aff" rid="A03"/>
</contrib>
</contrib-group>
<aff id="A01">
<institution><![CDATA[,Escuela Politécnica Superior Departamento de Matemáticas ]]></institution>
<addr-line><![CDATA[ ]]></addr-line>
<country>España</country>
</aff>
<aff id="A">
<institution><![CDATA[,jtarrio@udc.es  ]]></institution>
<addr-line><![CDATA[ ]]></addr-line>
</aff>
<aff id="A02">
<institution><![CDATA[,Avon Cosmetics S.A.U. Departamento de Marketing Comercial ]]></institution>
<addr-line><![CDATA[Madrid ]]></addr-line>
<country>España</country>
</aff>
<aff id="A03">
<institution><![CDATA[,Escuela Politécnica Nacional Departamento de Matemáticas Facultad de Ciencias]]></institution>
<addr-line><![CDATA[Quito ]]></addr-line>
<country>Ecuador</country>
</aff>
<pub-date pub-type="pub">
<day>00</day>
<month>09</month>
<year>2016</year>
</pub-date>
<pub-date pub-type="epub">
<day>00</day>
<month>09</month>
<year>2016</year>
</pub-date>
<volume>83</volume>
<numero>198</numero>
<fpage>94</fpage>
<lpage>101</lpage>
<copyright-statement/>
<copyright-year/>
<self-uri xlink:href="http://www.scielo.org.co/scielo.php?script=sci_arttext&amp;pid=S0012-73532016000400011&amp;lng=en&amp;nrm=iso"></self-uri><self-uri xlink:href="http://www.scielo.org.co/scielo.php?script=sci_abstract&amp;pid=S0012-73532016000400011&amp;lng=en&amp;nrm=iso"></self-uri><self-uri xlink:href="http://www.scielo.org.co/scielo.php?script=sci_pdf&amp;pid=S0012-73532016000400011&amp;lng=en&amp;nrm=iso"></self-uri><abstract abstract-type="short" xml:lang="en"><p><![CDATA[Robustness of process capability measurements is a very important matter in statistical quality control. In this paper, two new classes of capability measurements are studied as robust mechanisms to detect the influence of factors that may cause large departures from the process' engineering specifications. The behavior of the new indices was analyzed by comparing their performance to other capability measures that have been widely studied in literature. The paper aims to investigate the robustness of the new capability ratios under the presence of outliers and a lack of normality. For this purpose, bootstrap techniques were applied to detect the true potential capability of a process via statistical inference methods. The accuracies of the proposed indices are discussed by means of numerical results from a real data example.]]></p></abstract>
<abstract abstract-type="short" xml:lang="es"><p><![CDATA[En este trabajo, se proponen dos nuevos índices de capacidad robustos para detectar la influencia de los factores que pueden causar grandes desviaciones de las especificaciones técnicas del proceso. El comportamiento de estos nuevos índices se analizó mediante la comparación de su rendimiento con respecto a otras medidas de capacidad ampliamente estudiados en la literatura. El trabajo tiene como objetivo investigar la robustez de estos nuevos índices de capacidad bajo la presencia de valores extremos y de falta de normalidad. Para este propósito, se aplicaron técnicas de remuestreo Bootstrap para detectar la verdadera capacidad potencial de un proceso a través de los métodos de inferencia estadística. La precisión de los índices propuestos es discutida por medio de resultados numéricos con un ejemplo de datos reales.]]></p></abstract>
<kwd-group>
<kwd lng="en"><![CDATA[Process capability ratio]]></kwd>
<kwd lng="en"><![CDATA[robust statistics]]></kwd>
<kwd lng="en"><![CDATA[bootstrap hypothesis testing]]></kwd>
<kwd lng="en"><![CDATA[bootstrap confidence intervals]]></kwd>
<kwd lng="es"><![CDATA[índices de capacidad]]></kwd>
<kwd lng="es"><![CDATA[estadística robusta]]></kwd>
<kwd lng="es"><![CDATA[contraste de hipótesis bootstrap]]></kwd>
<kwd lng="es"><![CDATA[intervalos de confianza bootstrap]]></kwd>
</kwd-group>
</article-meta>
</front><body><![CDATA[ <p><font size="1" face="Verdana, Arial, Helvetica, sans-serif"><b>DOI:</b> <a href="http://dx.doi.org/10.15446/dyna.v83n198.49930" target="_blank">http://dx.doi.org/10.15446/dyna.v83n198.49930</a></font></p>     <p align="center"><font size="4" face="Verdana, Arial, Helvetica, sans-serif"><b>New robust capability ratios   approaches for quality control</b></font></p>     <p align="center"><i><b><font size="3" face="Verdana, Arial, Helvetica, sans-serif">Nueva   propuesta de &iacute;ndices de capacidad robustos para el control de la calidad</font></b></i></p>     <p align="center">&nbsp;</p>     <p align="center"><b><font size="2" face="Verdana, Arial, Helvetica, sans-serif">Salvador Naya <i><sup>a</sup></i>,   Andr&eacute;s Devia-Rivera <i><sup>b</sup></i>,   Javier Tarr&iacute;o-Saavedra <i><sup>a </sup></i>&amp;   Miguel Flores <i><sup>c</sup></i></font></b></p>     <p align="center">&nbsp;</p>     <p align="center"><font size="2" face="Verdana, Arial, Helvetica, sans-serif"><sup><i>a </i></sup><i>Escuela Polit&eacute;cnica Superior, Departamento de Matem&aacute;ticas. Grupo   MODES, Universidad de A Coru&ntilde;a, Espa&ntilde;a. <a href="mailto:salva@udc.es">salva@udc.es</a>, <a href="mailto:jtarrio@udc.es">jtarrio@udc.es</a>    <br>   <sup>b </sup>Departamento de Marketing Comercial, Avon   Cosmetics S.A.U., Madrid, Espa&ntilde;a. <a href="mailto:andres.devia@avon.com">andres.devia@avon.com</a>    <br>   <sup>c</sup> Facultad de Ciencias, Departamento de Matem&aacute;ticas. Escuela   Polit&eacute;cnica Nacional, Quito, Ecuador. <a href="mailto:miguel.flores@epn.edu.ec">miguel.flores@epn.edu.ec</a></i></font></p>     <p align="center">&nbsp;</p>     ]]></body>
<body><![CDATA[<p align="center"><font size="2" face="Verdana, Arial, Helvetica, sans-serif"><b>Received: April 1<sup>rd</sup>, 2015.   Received in revised form: November 20<sup>th</sup>, 2015. Accepted: March 30<sup>th</sup>,   2016.</b></font></p>     <p align="center">&nbsp;</p>     <p align="center"><font size="1" face="Verdana, Arial, Helvetica, sans-seriff"><b>This work is licensed under a</b> <a rel="license" href="http://creativecommons.org/licenses/by-nc-nd/4.0/">Creative Commons Attribution-NonCommercial-NoDerivatives 4.0 International License</a>.</font><br />   <a rel="license" href="http://creativecommons.org/licenses/by-nc-nd/4.0/"><img style="border-width:0" src="https://i.creativecommons.org/l/by-nc-nd/4.0/88x31.png" /></a></p> <hr>     <p><font size="2" face="Verdana, Arial, Helvetica, sans-serif"><b>Abstract    <br>   </b></font><font size="2" face="Verdana, Arial, Helvetica, sans-serif">Robustness of process capability   measurements is a very important matter in statistical quality control. In this   paper, two new classes of capability measurements are studied as robust   mechanisms to detect the influence of factors that may cause large departures   from the process' engineering specifications. The behavior of the new indices   was analyzed by comparing their performance to other capability measures that   have been widely studied in literature. The paper aims to investigate the   robustness of the new capability ratios under the presence of outliers and a   lack of normality. For this purpose, bootstrap techniques were applied to   detect the true potential capability of a process via statistical inference   methods. The accuracies of the proposed indices are discussed by means of   numerical results from a real data example.</font></p>     <p><font size="2" face="Verdana, Arial, Helvetica, sans-serif"><i>Keywords</i>: Process capability ratio, robust statistics, bootstrap hypothesis   testing, bootstrap confidence intervals.</font></p>     <p><font size="2" face="Verdana, Arial, Helvetica, sans-serif"><b>Resumen    <br>   </b></font><font size="2" face="Verdana, Arial, Helvetica, sans-serif">En este   trabajo, se proponen dos nuevos &iacute;ndices de capacidad robustos para detectar la   influencia de los factores que pueden causar grandes desviaciones de las   especificaciones t&eacute;cnicas del proceso. El comportamiento de estos nuevos   &iacute;ndices se analiz&oacute; mediante la comparaci&oacute;n de su rendimiento con respecto a   otras medidas de capacidad ampliamente estudiados en la literatura. El trabajo   tiene como objetivo investigar la robustez de estos nuevos &iacute;ndices de capacidad   bajo la presencia de valores extremos y de falta de normalidad. Para este   prop&oacute;sito, se aplicaron t&eacute;cnicas de remuestreo Bootstrap para detectar la   verdadera capacidad potencial de un proceso a trav&eacute;s de los m&eacute;todos de   inferencia estad&iacute;stica. La precisi&oacute;n de los &iacute;ndices propuestos es discutida por   medio de resultados num&eacute;ricos con un ejemplo de datos reales.</font></p>     <p><font size="2" face="Verdana, Arial, Helvetica, sans-serif"><i>Palabras clave</i>: &iacute;ndices de capacidad; estad&iacute;stica robusta,   contraste de hip&oacute;tesis bootstrap, intervalos de confianza bootstrap.</font></p> <hr>     <p>&nbsp;</p>     ]]></body>
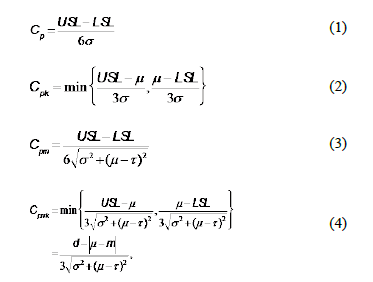
<body><![CDATA[<p><font size="3" face="Verdana, Arial, Helvetica, sans-serif"><b>1. Introduction</b></font></p>     <p><font size="2" face="Verdana, Arial, Helvetica, sans-serif">A process capability ratio (PCR) is a   numerical score that helps the manufacturers to know whether the output of a   process meets the engineering specifications. Large values of the ratio   indicate that the current process is capable of producing items that meet or   exceed customer requirements. Unfortunately, traditional assumptions of the   data, such as normality or independence are often violated in many real   situations. A common scenario, in which the assumptions of normality or   independent and identically distributed data (i.i.d.) does not hold, is, for   example, when the data are autocorrelated or when they belong to non-centered   and skewed distributions. Specifically, if the assumption of normality is   violated, it could then be very difficult, or even impossible, to obtain closed   expressions for the probability distribution of the PCR estimator. This means   that, in many cases, it is not possible to derive exact confidence intervals   for the estimates of process capability. As a consequence of this, capability   estimates may be far away from the true parameters of interest, and   manufacturers could, therefore, be making the wrong decisions about the quality   management of the process. </font></p>     <p><font size="2" face="Verdana, Arial, Helvetica, sans-serif">Many authors have studied different   estimators for process capability under various distributional settings. Recent   advances in inferential analysis applied to quality control techniques have   motivated more theoretical research into the distribution theory of estimated   PCR (see, for instance, the works by Chou and Owen &#91;1&#93;, Clements &#91;2&#93;, Pearn et   al. &#91;3&#93;, Ebadi and Shahriari &#91;4&#93;, Kotz and Johnson &#91;5&#93;, and Chien-Wei et al.   &#91;6&#93;). The last two presented an exhaustive discussion on a number of capability   indices, their sampling properties and practical applications. Moreover, there   are some studies that address capacity indexes applied to autocorrelated data,   such as Pan et al.'s &#91;7&#93; work that is applied to environmental features.   Additionally, in terms of the particular case that deals with non-normal data   and processes with unilateral specifications, extensive discussions can be   found in the work undertaken by the following authors: Somerville and   Montgomery &#91;8&#93;, Kotz and Lovelace &#91;9&#93;, Shore &#91;10&#93;, Tang and Than &#91;11&#93;, Chang et   al. &#91;12&#93;, Pearn and Chen &#91;13&#93;, and Kotz and Johnson &#91;14&#93;. Most of the   literature devoted to the study of process capability analysis frequently   considers four indices, <i>C<sub>p</sub>, C<sub>pk</sub>,   C<sub>pm</sub>, C<sub>pmk</sub>,</i> which are defined as: </font></p>     <p><img src="/img/revistas/dyna/v83n198/v83n198a11eq0104.gif"></p>     <p><font size="2" face="Verdana, Arial, Helvetica, sans-serif">Where <i>USL</i> and <i>LSL</i> are the upper and the lower   specification limits for the variations in the process, <sub><img  src="/img/revistas/dyna/v83n198/v83n198a11eq010.gif"></sub>is the process mean, <sub><img  src="/img/revistas/dyna/v83n198/v83n198a11eq012.gif"></sub> is the process   standard deviation, <sub><img  src="/img/revistas/dyna/v83n198/v83n198a11eq014.gif"></sub>is some target value of interest in   the process, <u>d</u> is the half of the spread between the upper and lower   engineering specifications, and <i>m</i> is the midpoint between the   specification limits.</font></p>     <p><font size="2" face="Verdana, Arial, Helvetica, sans-serif">It is well known that indices <i>C<sub>p</sub></i> and <i>C<sub>pm</sub></i> are improved when the process data comes from   symmetric distributions, e.g. the normal one. These are used to estimate   process capability when two-sided tolerance limits are of concern. In the case   of one-sided specifications, capability indices <i>C<sub>pk</sub></i> and <i>C<sub>pmk</sub></i>are preferred to obtain the desired process capability estimates &#91;15, 16&#93;.   The <i>C<sub>pmk</sub></i> index deals with   the departure of the process mean <font face="Symbol">m</font> from the target value <font face="Symbol">t</font>. It does   this faster than the indices, <i>C<sub>p</sub>,   C<sub>pk</sub></i> and <i>C<sub>pm</sub></i> while remaining sensitive to changes in the total deviation of the process (see   the expression in equation (4)). A handicap of most capability measures is   related to their efficiency, which strongly depends on the appropriate   estimation of the process variability. They are also influenced by the shape of   the underlying distribution function that characterizes it (see, for instance,   the papers by Heavlin &#91;17&#93;, Chou and Owen &#91;1&#93;, Pearn et al. &#91;3&#93; and Borges and   Ho &#91;18&#93; for a more theoretical discussion).</font></p>     <p><font size="2" face="Verdana, Arial, Helvetica, sans-serif">The present paper is concerned with the estimation   of process capability measurement when the data are possibly affected by   contamination, hereafter the outliers, which may be an alert from an   out-of-control process. A real data example is presented to compare the   performance of the new capability ratios relative to the standard indices (1)   to (4), that are under various schemes of distributions, sample sizes, and   percentages of contamination of data.</font></p>     <p><font size="2" face="Verdana, Arial, Helvetica, sans-serif">The analysis consisted of a double   inferential procedure. Bootstrap techniques for statistical inference were used   to study the degree of potential capability of processes generated by   distributions that have been affected by different outliers in different   percentages. Bootstrap techniques for statistical inferences were used to study   the degree of potential capability of processes that were generated by   distributions affected by the different percentage of outliers. Inferential   methods consisted of testing a standard null hypothesis in the context of   process capability analysis. Moreover, approximately 95 percent bootstrap   confidence intervals were obtained for the indices.</font></p>     <p><font size="2" face="Verdana, Arial, Helvetica, sans-serif">The present study is organized as   follows: in section 2, definitions and mathematical formulations to compute the   new capability indices are given. In section 3, theoretical basis of the   bootstrap approach for statistical inference are introduced in a process   capability analysis context. Section 4 is devoted to results obtained by   applying the indices and methods described in section 3. Finally, numerical   results and concluding remarks are discussed in section 5.</font></p>     <p>&nbsp;</p>     ]]></body>
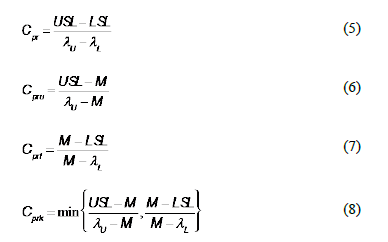
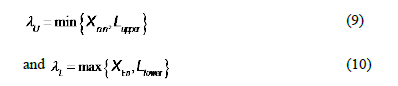
<body><![CDATA[<p><font size="3" face="Verdana, Arial, Helvetica, sans-serif"><b>2. Robust process capability ratios</b></font></p>     <p><font size="2" face="Verdana, Arial, Helvetica, sans-serif"><b><i>2.1. Robust capability measures for quality process</i></b></font></p>     <p><font size="2" face="Verdana, Arial, Helvetica, sans-serif">In a broad, but non theoretical sense,   since outliers are data that commonly come from distributions different from   the main set of data, it could be thought that the presence of outliers could   be evidence that the process is out of statistical control. In that sense,   there are a wide range of mathematical methods to deal with the problem of   outliers. All these methods are connected to robust statistics &#91;19&#93;. Robust   statistics are used in many applications of statistical process control   analysis. Abu-Shawiesh and Abdullah &#91;20&#93; studied control limits for control   charts by using robust estimates of process parameters (location, scale, shape,   etc.). In Grznar et al.'s paper &#91;21&#93;, the authors present a routine for outlier   detection based on the smoothing methods. Kocherlakota and Kocherlakota &#91;22&#93;   discuss different methods to obtain confidence intervals for PCR based on   robust estimates under non normal data. Prasad and Bramorski &#91;23&#93; studied the   interactions between outliers and correlation structures as unknown sources of   variability under the scope of time series. Also, Yeh and Bhattacharya &#91;24&#93;   proposed an index based on the idea of estimating non-conforming proportions.   They also discussed a methodology to obtain bootstrap confidence intervals.</font></p>     <p><font size="2" face="Verdana, Arial, Helvetica, sans-serif">In the following subsections, an ordered   sample of n independent identically distributed (i.i.d.) random variables   (r.v.) with the same distribution of the process <i>X</i> is represented by <img src="/img/revistas/dyna/v83n198/v83n198a11eq016.gif">, and a corresponding realization of <i>n</i> items taken from <i>X</i> is   denoted by <img src="/img/revistas/dyna/v83n198/v83n198a11eq018.gif">. Some robust estimators that will be used in the rest of this paper   are the standard deviation, <img src="/img/revistas/dyna/v83n198/v83n198a11eq020.gif">, the sample range, <img src="/img/revistas/dyna/v83n198/v83n198a11eq022.gif">, the median, <img src="/img/revistas/dyna/v83n198/v83n198a11eq024.gif">, and the first and third quantiles, <img src="/img/revistas/dyna/v83n198/v83n198a11eq026.gif"> and <img src="/img/revistas/dyna/v83n198/v83n198a11eq028.gif">.</font></p>     <p><font size="2" face="Verdana, Arial, Helvetica, sans-serif"><b><i>2.2. Definition of C<sub>pk</sub> and C<sub>prk</sub> indices</i></b></font></p>     <p><font size="2" face="Verdana, Arial, Helvetica, sans-serif">The introduction of these new process   capability estimates is justified since there are systems characterized by the   existence of sources of deviations that make large departures from the   engineering specifications. We assume that such sources of deviations take   place due to the presence of outliers in the data.</font></p>     <p><font size="2" face="Verdana, Arial, Helvetica, sans-serif">The first class of ratio that we   introduce, <i>C<sub>pr</sub></i>, is based   on the idea of the outlier detection criteria that is defined by the boxplot   charts. It is expected that <i>C<sub>pr</sub></i> will be robust for detecting outliers when it is used to estimate the process   capability of two-sided specifications systems. The second class of ratio,   denoted by <i>C<sub>prk</sub></i>, was   developed to estimate process capability for unilateral (one-sided)   specifications in a similar way to that of the equations (2) and (4). <i>C<sub>pr</sub></i> measure the potential   process capability while <i>C<sub>prk</sub></i> estimate the real capability of a process.</font></p>     <p><font size="2" face="Verdana, Arial, Helvetica, sans-serif">We define the new indices <i>C<sub>pr</sub></i> and C<sub>prk</sub> as:</font></p>     <p><img src="/img/revistas/dyna/v83n198/v83n198a11eq0508.gif"></p>     <p><font size="2" face="Verdana, Arial, Helvetica, sans-serif">We stress that <img src="/img/revistas/dyna/v83n198/v83n198a11eq038.gif"> and <img src="/img/revistas/dyna/v83n198/v83n198a11eq040.gif"> are, respectively, two robust   measures for the upper and the lower bounds of an in-control process, defined   as: </font></p>     ]]></body>
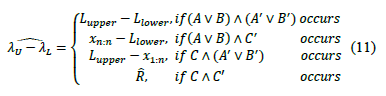
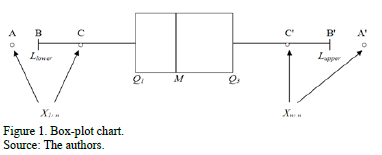
<body><![CDATA[<p><img src="/img/revistas/dyna/v83n198/v83n198a11eq0910.gif"></p>     <p><font size="2" face="Verdana, Arial, Helvetica, sans-serif">Where<sub><img  src="/img/revistas/dyna/v83n198/v83n198a11eq046.gif"></sub>, <sub><img  src="/img/revistas/dyna/v83n198/v83n198a11eq048.gif"></sub> and<sub><img  src="/img/revistas/dyna/v83n198/v83n198a11eq050.gif"></sub> is the sample interquartile range. Thus, the quantity <sub><img  src="/img/revistas/dyna/v83n198/v83n198a11eq052.gif"></sub> represents a new   robust measure for the process width.</font></p>     <p><font size="2" face="Verdana, Arial, Helvetica, sans-serif"><a href="#fig01">Fig. 1</a> shows a basic representation of a   univariate process distribution based on the idea of box-plot charts, i.e. based on a robust definition for outliers   into the data set. Thus, if we denote the domain of the process by <img src="/img/revistas/dyna/v83n198/v83n198a11eq056.gif"> , then any point   belonging to <img src="/img/revistas/dyna/v83n198/v83n198a11eq058.gif">, where <img src="/img/revistas/dyna/v83n198/v83n198a11eq058.gif"> is defined as the set <img src="/img/revistas/dyna/v83n198/v83n198a11eq060.gif"> ,   will represent an outlier for the process <i>X</i>. Let us analyze situations   represented in A, B or C, and A' , B' or C'. Under the new approach, three   elemental criteria can be used to construct process capability measures based   on the (natural) process variability estimation. The setting can be defined as   follows:</font></p>     <p align="center"><font size="2" face="Verdana, Arial, Helvetica, sans-serif"><a name="fig01"></a></font><img src="/img/revistas/dyna/v83n198/v83n198a11fig01.gif"></p>     <p><font size="2" face="Verdana, Arial, Helvetica, sans-serif">i) For bilateral specifications, the   process width is estimated by:</font></p>     <p><img src="/img/revistas/dyna/v83n198/v83n198a11eq11.gif"></p>     <p><font size="2" face="Verdana, Arial, Helvetica, sans-serif">ii) For one upper specification, the   process width is estimated by:</font></p>     <p><img src="/img/revistas/dyna/v83n198/v83n198a11eq12.gif"></p>     <p><font size="2" face="Verdana, Arial, Helvetica, sans-serif">iii) For one lower specification, the   process width is estimated by:</font></p>     <p><img src="/img/revistas/dyna/v83n198/v83n198a11eq13.gif"></p>     ]]></body>
<body><![CDATA[<p>&nbsp;</p>     <p><font size="3" face="Verdana, Arial, Helvetica, sans-serif"><b>3. Bootstrap analysis</b></font></p>     <p><font size="2" face="Verdana, Arial, Helvetica, sans-serif"><b><i>3.1. Bootstrap based inference methods</i></b></font></p>     <p><font size="2" face="Verdana, Arial, Helvetica, sans-serif">In recent   years, due to the analytical advances in industry control, not only point   estimation but also hypothesis testing and interval estimation, is often   obligatory for the producer to demonstrate process capability as part of the   contract. In that sense, an important part of the analysis included in the   present paper is based on the behavior results of hypothesis testing and   confidence intervals for the indices and<i> <sub><img  src="/img/revistas/dyna/v83n198/v83n198a11eq068.gif"></sub></i>, relative to the indices (1) to (4), that are obtained   via bootstrap techniques. Informally, bootstrap methods are based on sampling   with replacement following the next idea. Let <img src="/img/revistas/dyna/v83n198/v83n198a11eq070.gif">, a sequence of <i>n</i> i.i.d.   r.v. with the same distribution of the process <i>X</i>, and <img src="/img/revistas/dyna/v83n198/v83n198a11eq072.gif">a realization of size <i>n</i>;   then a uniformly distributed random variable <img src="/img/revistas/dyna/v83n198/v83n198a11eq074.gif"> taking values on the set <img src="/img/revistas/dyna/v83n198/v83n198a11eq076.gif"> is defined by the probability   distribution</font></p>     <p><img src="/img/revistas/dyna/v83n198/v83n198a11eq14.gif"></p>     <p><font size="2" face="Verdana, Arial, Helvetica, sans-serif">Thus, a bootstrap sample, denoted by <img src="/img/revistas/dyna/v83n198/v83n198a11eq082.gif">, is a sample drawn with replacement from the original sample <img src="/img/revistas/dyna/v83n198/v83n198a11eq076.gif"> by using the law of   probability distribution defined in (14). In the next sections we describe the   methods used in this paper in the context of statistical inference for PCR. </font></p>     <p><font size="2" face="Verdana, Arial, Helvetica, sans-serif"><b><i>3.2. Hypothesis testing</i></b></font></p>     <p><font size="2" face="Verdana, Arial, Helvetica, sans-serif">From industry   experience, it is frequently necessary to demonstrate that the capability ratio <sub><img  src="/img/revistas/dyna/v83n198/v83n198a11eq084.gif"></sub> meets or exceeds a   particular target value, say <sub><img  src="/img/revistas/dyna/v83n198/v83n198a11eq086.gif"></sub>. This may be formulated as a hypothesis testing problem,   i.e. <sub><img  src="/img/revistas/dyna/v83n198/v83n198a11eq088.gif"></sub> (Process is not   capable) and <sub><img  src="/img/revistas/dyna/v83n198/v83n198a11eq090.gif"></sub> (Process is   potentially capable). We would like to test <sub><img  src="/img/revistas/dyna/v83n198/v83n198a11eq092.gif"></sub> against <sub><img  src="/img/revistas/dyna/v83n198/v83n198a11eq094.gif"></sub> in the case of the   indices <i><sub><img  src="/img/revistas/dyna/v83n198/v83n198a11eq096.gif"></sub></i>and <i><sub><img  src="/img/revistas/dyna/v83n198/v83n198a11eq098.gif"></sub></i> relative to the indices (1)   to (4), in different scenarios. Several authors have investigated this test   (see for instance Kane &#91;25&#93;, Montgomery &#91;26&#93;, Lin and Pearn &#91;27&#93;, Shu and Lu   &#91;28&#93;, Mathew et al. &#91;29&#93; and Albing &#91;30&#93;). In all mentioned works, the authors   have dealt with this problem by finding parametric distributions for test   statistics under the null hypothesis. Regarding the above, we have avoided   complicated mathematical processes to derive the null distribution of any   pivotal test statistic based on the <i><sub><img  src="/img/revistas/dyna/v83n198/v83n198a11eq099.gif"></sub></i>and <i><sub><img  src="/img/revistas/dyna/v83n198/v83n198a11eq100.gif"></sub> </i>indices. Thus, we have proposed a reasonable   alternative based on bootstrap techniques to test the null hypothesis<sub><img  src="/img/revistas/dyna/v83n198/v83n198a11eq102.gif"></sub>. The approach implemented in this paper is based on the ideas   discussed by Hall and Wilson &#91;31&#93; and Becher et al. &#91;32&#93;. The method is defined   as follows.</font></p>     <p><font size="2" face="Verdana, Arial, Helvetica, sans-serif">Let us denote <sub><img  src="/img/revistas/dyna/v83n198/v83n198a11eq104.gif"></sub> as the value of the   process capability ratio of the process <i>X</i>,   with <sub><img  src="/img/revistas/dyna/v83n198/v83n198a11eq106.gif"></sub> representing a   non-stochastic set of intrinsic parameters of the quality process <i>X</i>, and <i>u </i>representing one of the following classes of indices: <sub><img  src="/img/revistas/dyna/v83n198/v83n198a11eq108.gif"></sub>, <sub><img  src="/img/revistas/dyna/v83n198/v83n198a11eq110.gif"></sub>, <sub><img  src="/img/revistas/dyna/v83n198/v83n198a11eq112.gif"></sub>, <sub><img  src="/img/revistas/dyna/v83n198/v83n198a11eq114.gif"></sub>, <sub><img  src="/img/revistas/dyna/v83n198/v83n198a11eq116.gif"></sub> and <sub><img  src="/img/revistas/dyna/v83n198/v83n198a11eq118.gif"></sub>. In what follows, we shall consider that <sub><img  src="/img/revistas/dyna/v83n198/v83n198a11eq106.gif"></sub> contains   (non-identical) subsets of intrinsic parameters such as: <sub><img  src="/img/revistas/dyna/v83n198/v83n198a11eq121.gif"></sub>, <sub><img  src="/img/revistas/dyna/v83n198/v83n198a11eq123.gif"></sub>,<sub><img  src="/img/revistas/dyna/v83n198/v83n198a11eq125.gif"></sub>,<sub><img  src="/img/revistas/dyna/v83n198/v83n198a11eq127.gif"></sub>,<sub><img  src="/img/revistas/dyna/v83n198/v83n198a11eq129.gif"></sub>,<sub><img  src="/img/revistas/dyna/v83n198/v83n198a11eq131.gif"></sub>,<sub><img  src="/img/revistas/dyna/v83n198/v83n198a11eq133.gif"></sub>,<sub><img  src="/img/revistas/dyna/v83n198/v83n198a11eq135.gif"></sub>,<sub><img  src="/img/revistas/dyna/v83n198/v83n198a11eq137.gif"></sub>, and <sub><img  src="/img/revistas/dyna/v83n198/v83n198a11eq139.gif"></sub>, where <sub><img  src="/img/revistas/dyna/v83n198/v83n198a11eq141.gif"></sub>, and <sub><img  src="/img/revistas/dyna/v83n198/v83n198a11eq143.gif"></sub> are the upper and   lower proportions of non-conformity detected in the process, respectively. The   corresponding sample estimator and bootstrap estimator of the index <sub><img  src="/img/revistas/dyna/v83n198/v83n198a11eq145.gif"></sub> are <img src="/img/revistas/dyna/v83n198/v83n198a11eq147.gif">,<img src="/img/revistas/dyna/v83n198/v83n198a11eq149.gif"> and <img src="/img/revistas/dyna/v83n198/v83n198a11eq151.gif">, where sub index <i>b</i> represents the <i>b</i>-th bootstrap   replicate <img src="/img/revistas/dyna/v83n198/v83n198a11eq153.gif">.</font></p>     <p><font size="2" face="Verdana, Arial, Helvetica, sans-serif">The study of the probability distribution   of the estimator <img src="/img/revistas/dyna/v83n198/v83n198a11eq155.gif"> is equivalent to finding the   distribution of the inverse of a random variable. As it can be seen from the   equations (11) to (13), this random variable contains a highly nonlinear   transformation of order statistics. To solve this problem, long and   tedious algebra are necessary, as well   as the application of asymptotic results from the distribution theory of order   statistics. This is outside the scope of this paper and has been left to future   work. </font></p>     ]]></body>
<body><![CDATA[<p><font size="2" face="Verdana, Arial, Helvetica, sans-serif">A common alternative to constructing   useful pivotal statistics, avoiding such a theoretical analysis, is based on   the idea of using bootstrap techniques. Hall and Wilson &#91;31&#93; proposed two   guidelines to test hypotheses for the population mean based on percentiles of   the null distribution of a bootstrap test statistic. Due to every <i>u</i>-th class of capability, ratio <img src="/img/revistas/dyna/v83n198/v83n198a11eq157.gif"> is an univariate real-valued   function of the sample <img src="/img/revistas/dyna/v83n198/v83n198a11eq159.gif">. We can adapt the first guideline in the above mentioned paper to   test <sub><img  src="/img/revistas/dyna/v83n198/v83n198a11eq161.gif"></sub> against <sub><img  src="/img/revistas/dyna/v83n198/v83n198a11eq163.gif"></sub> for a specific value <sub><img  src="/img/revistas/dyna/v83n198/v83n198a11eq165.gif"></sub>. The implementation of the test is synthesized as follows:</font></p>     <p><font size="2" face="Verdana, Arial, Helvetica, sans-serif">i) <i>Null   statistic</i>: Computing the ratio <sub><img  src="/img/revistas/dyna/v83n198/v83n198a11eq167.gif"></sub> with the original   sample <img src="/img/revistas/dyna/v83n198/v83n198a11eq159.gif">, a natural null statistic <sub><img  src="/img/revistas/dyna/v83n198/v83n198a11eq169.gif"></sub> is given by</font></p>     <p><img src="/img/revistas/dyna/v83n198/v83n198a11eq15" /></p>     <p><font size="2" face="Verdana, Arial, Helvetica, sans-serif">where <img src="/img/revistas/dyna/v83n198/v83n198a11eq173.gif"> is a suitable estimator of   the squared root of<img src="/img/revistas/dyna/v83n198/v83n198a11eq175.gif">. In the present work, we propose to use a large enough number <i>B<sub>0</sub></i> of bootstrap samples of<img src="/img/revistas/dyna/v83n198/v83n198a11eq177.gif"> to compute</font></p>     <p><img src="/img/revistas/dyna/v83n198/v83n198a11eq16.gif"></p>     <p><font size="2" face="Verdana, Arial, Helvetica, sans-serif">where <img src="/img/revistas/dyna/v83n198/v83n198a11eq181.gif"> is the bootstrap estimator of<img src="/img/revistas/dyna/v83n198/v83n198a11eq183.gif">. It can be proved that <img src="/img/revistas/dyna/v83n198/v83n198a11eq185.gif"> with probability one &#91;31,33&#93;.</font></p>     <p><font size="2" face="Verdana, Arial, Helvetica, sans-serif">ii) <i>Test </i>statistic: The statistic <sub><img  src="/img/revistas/dyna/v83n198/v83n198a11eq187.gif"></sub> is computed with the <i>b</i>-th resample <img src="/img/revistas/dyna/v83n198/v83n198a11eq189.gif">. Thus, the <i>b</i>-th bootstrap   test statistic is obtained by computing</font></p>     <p><img src="/img/revistas/dyna/v83n198/v83n198a11eq17.gif"></p>     <p><font size="2" face="Verdana, Arial, Helvetica, sans-serif">for <img src="/img/revistas/dyna/v83n198/v83n198a11eq193.gif">. Here, <img src="/img/revistas/dyna/v83n198/v83n198a11eq173.gif"> is the bootstrap estimator of the squared root   of <img src="/img/revistas/dyna/v83n198/v83n198a11eq195.gif">, which is obtained in the same way as</font></p>     <p><img src="/img/revistas/dyna/v83n198/v83n198a11eq171.gif"></p>     ]]></body>


<body><![CDATA[<p><font size="2" face="Verdana, Arial, Helvetica, sans-serif">Informally,   the basic idea of the expression (17) is based on the assumption that the   distribution of the statistic <img src="/img/revistas/dyna/v83n198/v83n198a11eq203.gif"> accurately mimics the   distribution of <img src="/img/revistas/dyna/v83n198/v83n198a11eq205.gif">. Thus, the decision rule for the test at the <i>b</i> replication is to rejec<img src="/img/revistas/dyna/v83n198/v83n198a11eq207.gif">t if <img src="/img/revistas/dyna/v83n198/v83n198a11eq209.gif"> or not to reject <img src="/img/revistas/dyna/v83n198/v83n198a11eq207.gif"> if <img src="/img/revistas/dyna/v83n198/v83n198a11eq211.gif">.</font></p>     <p><font size="2" face="Verdana, Arial, Helvetica, sans-serif">iii) <i>P value</i>: Se<img src="/img/revistas/dyna/v83n198/v83n198a11eq213.gif">t, where the probability or p-value in the expression (17) is   computed by:</font></p>     <p><img src="/img/revistas/dyna/v83n198/v83n198a11eq18.gif"></p>     <p><font size="2" face="Verdana, Arial, Helvetica, sans-serif"><b><i>3.3. Confidence intervals</i></b></font></p>     <p><font size="2" face="Verdana, Arial, Helvetica, sans-serif">Bootstrap   methods to construct confidence intervals for PCR, have been widely studied by   several authors, e.g. Franklin and Wasserman &#91;34,35&#93;, Choi et al. &#91;36&#93;, Tong and Chen &#91;37&#93;, Yeh   and Bhattacharya &#91;24&#93;, Balamurali and Kalyanasundaram &#91;38&#93;, Mathew et al. &#91;29&#93;,   and Wang et al. &#91;39&#93; among others. The conventional parametric approach would   suggest that the probability distribution of capability ratios <img src="/img/revistas/dyna/v83n198/v83n198a11eq155.gif"> and <img src="/img/revistas/dyna/v83n198/v83n198a11eq217.gif">, but due to the same reasons explained in section 3.2, from a   practical point of view, it makes more sense to try to approximate the   distribution of every class of ratio, <img src="/img/revistas/dyna/v83n198/v83n198a11eq219.gif">, via bootstrap techniques. In this paper, we have used the method   of bias corrected percentile bootstrap (BCPB). A complete justification of this   method is in Efron &#91;40&#93;.</font></p>     <p><font size="2" face="Verdana, Arial, Helvetica, sans-serif">The method is   summarized as follows: firstly, using the ordered distribution of <img src="/img/revistas/dyna/v83n198/v83n198a11eq221.gif">,…,<img src="/img/revistas/dyna/v83n198/v83n198a11eq223.gif">, a significance level is fixed, <i><font face="Symbol">a</font></i> , and then the following quantities are calculated: <img src="/img/revistas/dyna/v83n198/v83n198a11eq225.gif">, <sub><img  src="/img/revistas/dyna/v83n198/v83n198a11eq227.gif"></sub>, <sub><img  src="/img/revistas/dyna/v83n198/v83n198a11eq229.gif"><img  src="/img/revistas/dyna/v83n198/v83n198a11eq231.gif"></sub>, where <sub><img  src="/img/revistas/dyna/v83n198/v83n198a11eq233.gif"></sub> is the inverse of the   standard normal probability distribution and <sub><img  src="/img/revistas/dyna/v83n198/v83n198a11eq235.gif"></sub> is the <sub><img  src="/img/revistas/dyna/v83n198/v83n198a11eq237.gif"></sub>th-quantile of the standard normal distribution. Then, using   a large number <sub><img  src="/img/revistas/dyna/v83n198/v83n198a11eq239.gif"></sub> of bootstrap   resamples, a <img src="/img/revistas/dyna/v83n198/v83n198a11eq241.gif"> percent <i>BCBP</i> confidence interval for <img src="/img/revistas/dyna/v83n198/v83n198a11eq219.gif">, is given by <img src="/img/revistas/dyna/v83n198/v83n198a11eq243.gif">.</font></p>     <p><font size="2" face="Verdana, Arial, Helvetica, sans-serif">Efron and   Tibshirani &#91;41&#93; indicated that a rough minimum of 1000 bootstrap samples is   usually sufficient to compute reasonably accurate confidence interval   estimates. Nevertheless, numerical results included in the present paper have   been obtained by using <i>B=</i>10000 bootstrap samples. </font></p>     <p>&nbsp;</p>     <p><font size="3" face="Verdana, Arial, Helvetica, sans-serif"><b>4. Numerical results</b></font></p>     <p><font size="2" face="Verdana, Arial, Helvetica, sans-serif">The   following subsections presents the results corresponding to the application of   the proposed capability indices (and their quality assessment methodology) to   the real data.</font></p>     ]]></body>

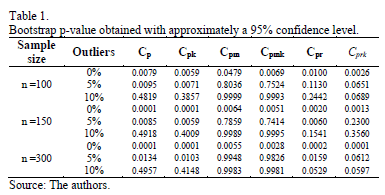
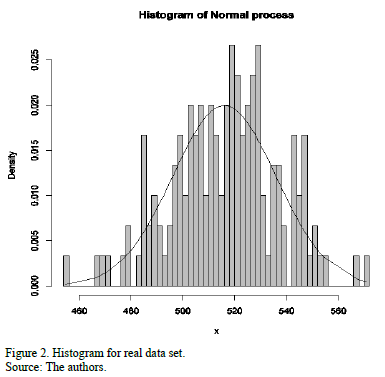
<body><![CDATA[<p><font size="2" face="Verdana, Arial, Helvetica, sans-serif"><b><i>4.1. Real data example</i></b></font></p>     <p><font size="2" face="Verdana, Arial, Helvetica, sans-serif">For the purpose of investigating whether   outliers can affect decisions in a quality management process, in this section   we present numerical results obtained from the application of the new approach   to a real data application.</font></p>     <p><font size="2" face="Verdana, Arial, Helvetica, sans-serif">Original experimental data were collected   from a study of 150 test steel pipes, which were analyzed in the Science and   Engineering of Materials labs at the University of A Coru&ntilde;a in Spain.   Originally, the study consisted of developing statistical quality control   measurements on traction-resistance by using the European norm UNE-EN   10002-140. Previous analyses of goodness of fit confirmed that the data were   normally distributed with a 516 mean and standard deviation of 20 for 95% of   confidence level. <a href="#fig02">Fig. 2</a>, shows a histogram describing the real data set.</font></p>     <p align="center"><font size="2" face="Verdana, Arial, Helvetica, sans-serif"><a name="fig02" id="fig02"></a></font><img src="/img/revistas/dyna/v83n198/v83n198a11fig02.gif"></p>     <p><font size="2" face="Verdana, Arial, Helvetica, sans-serif"><a href="#fig02">Fig. 2</a> shows that the data are centered to its mean value. In this case, the sample   mean is very close to the sample median, 516.3 and 517.6 respectively, and the   sample standard deviation is 20.81. Moreover, the histogram also shows that the   data set is a little skewed to the left: the skewness coefficient is -0.1641,   whereas the kurtosis excess is 3.0112.</font></p>     <p><font size="2" face="Verdana, Arial, Helvetica, sans-serif">In terms of capability, several   indices were computed to characterize the process <i>X </i>and for which the   estimates of <i>LSL </i>and <i>USL </i>are 453.87 and 578.73 respectively.   These values remained fixed during the whole bootstrap analysis and their   results will be discussed in subsection 4.2.</font></p>     <p><font size="2" face="Verdana, Arial, Helvetica, sans-serif">For the first classical   approach, the estimate <img src="/img/revistas/dyna/v83n198/v83n198a11eq247.gif">. This value tells us that the process   seems to be potentially possible under the 3<i><font face="Symbol">s</font></i> criteria. The other classical ratios showed little differences with respect to   the <img src="/img/revistas/dyna/v83n198/v83n198a11eq249.gif"> measure. In fact, the estimates were <img src="/img/revistas/dyna/v83n198/v83n198a11eq251.gif">, <img src="/img/revistas/dyna/v83n198/v83n198a11eq253.gif">,  and <img src="/img/revistas/dyna/v83n198/v83n198a11eq255.gif">, which suggest that process is not   possible. In this case, <img src="/img/revistas/dyna/v83n198/v83n198a11eq257.gif"> and <img src="/img/revistas/dyna/v83n198/v83n198a11eq259.gif"> were computed by choosing the value <img src="/img/revistas/dyna/v83n198/v83n198a11eq261.gif"> (target = median). Finally, the proposed   measures, <img src="/img/revistas/dyna/v83n198/v83n198a11eq263.gif"> and <img src="/img/revistas/dyna/v83n198/v83n198a11eq265.gif"> suggest the same conclusion: the <img src="/img/revistas/dyna/v83n198/v83n198a11eq267.gif"> index, i.e., the process is potentially   possible, and <img src="/img/revistas/dyna/v83n198/v83n198a11eq269.gif"> and <img src="/img/revistas/dyna/v83n198/v83n198a11eq271.gif">.</font></p>     <p><font size="2" face="Verdana, Arial, Helvetica, sans-serif"><b><i>4.2. Bootstrap-based inference results</i></b></font></p>     <p><font size="2" face="Verdana, Arial, Helvetica, sans-serif">In this section, we present the results   obtained by the bootstrap based statistical inference approach. The results   collected in the following tables were obtained after varying the sample size   and also the percentage of outliers in the original experimental data. After   having applied the goodness of fit tests for contaminated data, we conclude   that both 5 percent and 10 percent of outliers resulted in lack of normality   for the original data. This fact added a third source of lack of robustness for   all capability measures.</font></p>     <p><font size="2" face="Verdana, Arial, Helvetica, sans-serif"><a href="#tab01">Table 1</a> shows results of the bootstrap   hypothesis testing that was described in section 3.1. Firstly, allow us to draw   your attention to the columns in <a href="#tab01">Table 1</a>. It can be seen that in case of   normally distributed data (0% outliers), p-values seem to decrease as the   sample size increases for all indices even though, as it was expected, p-values   are less than the 0.05 nominal   significance level. Thus, in this experiment, the tests do not fail by   rejecting the null hypothesis. </font></p>     ]]></body>

<body><![CDATA[<p align="center"><font size="2" face="Verdana, Arial, Helvetica, sans-serif"><a name="tab01"></a></font><img src="/img/revistas/dyna/v83n198/v83n198a11tab01.gif"></p>     <p><font size="2" face="Verdana, Arial, Helvetica, sans-serif">When data   significantly departs from normality (5% and 10% outliers), some differences   can be observed in the performance behavior of indices <img src="/img/revistas/dyna/v83n198/v83n198a11eq273.gif">, <img src="/img/revistas/dyna/v83n198/v83n198a11eq275.gif"> and <img src="/img/revistas/dyna/v83n198/v83n198a11eq155.gif">, relative   to the indices <img src="/img/revistas/dyna/v83n198/v83n198a11eq277.gif">, <img src="/img/revistas/dyna/v83n198/v83n198a11eq279.gif"> and <img src="/img/revistas/dyna/v83n198/v83n198a11eq281.gif">.</font></p>     <p><font size="2" face="Verdana, Arial, Helvetica, sans-serif">For a moderate level of contamination of   data (5% outliers), indices <img src="/img/revistas/dyna/v83n198/v83n198a11eq273.gif">, <img src="/img/revistas/dyna/v83n198/v83n198a11eq275.gif"> do   not reject the null hypothesis. However, it seems that the test tends are not   rejected when sample size increase. For a higher level of outliers (10%   outliers), results show that all indices behave as expected and they gain in   robustness. In fact, this happens because they do not reject <i>H<sub>0,</sub></i>no matter the sample size.</font></p>     <p><font size="2" face="Verdana, Arial, Helvetica, sans-serif">Results for indices <img src="/img/revistas/dyna/v83n198/v83n198a11eq277.gif">, <img src="/img/revistas/dyna/v83n198/v83n198a11eq279.gif"> show   that these capability measures were more robust than the other indices. These   measurements do not fail by rejecting <i>H<sub>0</sub></i>.</font></p>     <p><font size="2" face="Verdana, Arial, Helvetica, sans-serif">Finally, results concerning the proposed   indices <img src="/img/revistas/dyna/v83n198/v83n198a11eq155.gif"> and <img src="/img/revistas/dyna/v83n198/v83n198a11eq281.gif"> show some evidence   that the indices are robust capability measures. This is because these indices   do not reject the null hypothesis when data are completely out-of-control.</font></p>     <p><font size="2" face="Verdana, Arial, Helvetica, sans-serif"><a href="#tab02">Table 2</a> shows results on approximately 95   percent confidence intervals obtained via the bias corrected percentile   bootstrap method. It can be seen that some results are somewhat surprising,   relative to the results collected in <a href="#tab01">Table 1</a>.</font></p>     <p align="center"><font size="2" face="Verdana, Arial, Helvetica, sans-serif"><a name="tab02"></a></font><img src="/img/revistas/dyna/v83n198/v83n198a11tab02.gif"></p>     <p><font size="2" face="Verdana, Arial, Helvetica, sans-serif">Firstly, for normal distributed data (0%   outliers), natural intuition tells us that confidence intervals should contain   the hypothetical value <i>C<sub>0</sub></i> = 1 when sample sizes increase. As it can be seen in <a href="#tab02">Table 2</a>, the results of   our experiment show that the proposed indices <img src="/img/revistas/dyna/v83n198/v83n198a11eq155.gif"> and <img src="/img/revistas/dyna/v83n198/v83n198a11eq281.gif"> showed   the expected behavior when the sample size was greater than or equal to 300.   This result suggests that these two new classes of process capability   measurements have robust properties in normal conditions.</font></p>     <p><font size="2" face="Verdana, Arial, Helvetica, sans-serif">Nevertheless,   when there are non-normal conditions (5% and 10% outliers), the 95% confidence   intervals for the proposed indices are surprisingly unified (<i>C<sub>pr</sub></i> and <i>C<sub>prk</sub></i> lies within the confidence interval).</font></p>     <p><font size="2" face="Verdana, Arial, Helvetica, sans-serif">For both,   moderate and highly contaminated data (5% and 10% outliers), upper limits of   obtained confidence intervals tend to be less than 1 (<i>C<sub>p</sub>,</i> <i>C<sub>pk</sub></i>, <i>C<sub>pm</sub></i> and <i>C<sub>pmk</sub></i> are out of the   interval). This fact allows to consider that classical measures <img src="/img/revistas/dyna/v83n198/v83n198a11eq283.gif">and <img src="/img/revistas/dyna/v83n198/v83n198a11eq275.gif"> show a better behavior   when sample size increase (<i>n </i>&gt;100).</font></p>     ]]></body>
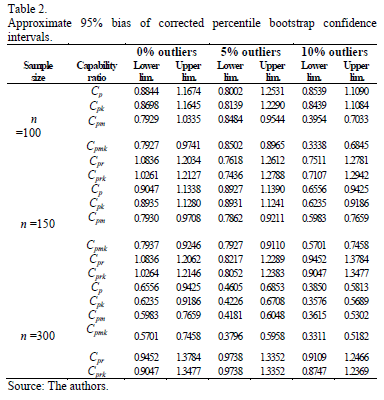
<body><![CDATA[<p><font size="2" face="Verdana, Arial, Helvetica, sans-serif">Finally, <img src="/img/revistas/dyna/v83n198/v83n198a11eq285.gif">and <img src="/img/revistas/dyna/v83n198/v83n198a11eq287.gif">indices can be seen to be more conservative than the other indices,   no matter the sample size. These two measurements suggest that when data are   not normal the process is not possible.</font></p>     <p><font size="2" face="Verdana, Arial, Helvetica, sans-serif">Taking the results into account, the   proposed robust indices could be applied in a wide range of study cases, e.g.   energy efficiency evaluation, academic evaluation, or the assessment of   technology and innovation in companies &#91;42-46&#93;.</font></p>     <p>&nbsp;</p>     <p><font size="3" face="Verdana, Arial, Helvetica, sans-serif"><b>5. Conclusions</b></font></p>     <p><font size="2" face="Verdana, Arial, Helvetica, sans-serif">In this paper, two classes of capability   measurements inspired by the idea of robustness derived from the theory of   construction box-plot charts have been studied. These new measurements were   formulated by defining two new classes of robust process capability ratios that   were then compared with traditional ratios in the literature, under several   experimental schemes.</font></p>     <p><font size="2" face="Verdana, Arial, Helvetica, sans-serif">Due to the difficulty of obtaining the   probability distribution of the new capability ratios, bootstrap methods were   applied to study the robustness of the indices via the statistical inference   approach. Thus, bootstrap hypothesis testing and bootstrap confidence intervals   were used to test and estimate the true level of capability of a quality   process.</font></p>     <p><font size="2" face="Verdana, Arial, Helvetica, sans-serif">The bootstrap experimental analysis was   implemented by using a set of laboratory data that came from the analysis of   the traction-resistance of steel pipes by using the European norm UNE-EN   10002-1 at the University of A Coru&ntilde;a, Spain.</font></p>     <p><font size="2" face="Verdana, Arial, Helvetica, sans-serif">The inference based results showed that   the proposed capability measurements were comparable with the traditional   process capability ratios. Comparative analyses suggested that the new ratios   are robust measures to estimate the true level of process capability under   normality. Moreover, the new capability ratios were shown to be less   conservative than some traditional ratios under the presence of outliers; this   produced a moderate lack of normality that seems to improve when increasing the   sample size.</font></p>     <p>&nbsp;</p>     <p><font size="3" face="Verdana, Arial, Helvetica, sans-serif"><b>Acknowledgements</b></font></p>     ]]></body>
<body><![CDATA[<p><font size="2" face="Verdana, Arial, Helvetica, sans-serif">This research has been partially   supported by the Spanish Ministry of Science and Innovation, Grant   MTM2014-52876-R (ERDF included) and the Vicerrectorado de Investigaci&oacute;n de la   EPN (Ecuador).</font></p>     <p>&nbsp;</p>     <p><font size="3" face="Verdana, Arial, Helvetica, sans-serif"><b>References</b></font></p>     <!-- ref --><p><font size="2" face="Verdana, Arial, Helvetica, sans-serif"><b>&#91;1&#93;</b> Chou, Y.M. and Owen, D.B., On   the distribution of the estimated process capability indices. Communications in   Statistics - Theory and Methods, 18, pp. 4549-4560, 1989. DOI:   10.1515/EQC.2003.5</font>&nbsp;&nbsp;&nbsp;&nbsp;&nbsp;&nbsp;&nbsp;&nbsp;[&#160;<a href="javascript:void(0);" onclick="javascript: window.open('/scielo.php?script=sci_nlinks&ref=1148097&pid=S0012-7353201600040001100001&lng=','','width=640,height=500,resizable=yes,scrollbars=1,menubar=yes,');">Links</a>&#160;]<!-- end-ref --><!-- ref --><p><font size="2" face="Verdana, Arial, Helvetica, sans-serif"><b>&#91;2&#93;</b> Clements, J.A., Process   capability indices for non normal calculations. Quality Progress, 22, pp. 49-55,   1989. DOI: 10.1080/08982119408918772</font>&nbsp;&nbsp;&nbsp;&nbsp;&nbsp;&nbsp;&nbsp;&nbsp;[&#160;<a href="javascript:void(0);" onclick="javascript: window.open('/scielo.php?script=sci_nlinks&ref=1148098&pid=S0012-7353201600040001100002&lng=','','width=640,height=500,resizable=yes,scrollbars=1,menubar=yes,');">Links</a>&#160;]<!-- end-ref --><!-- ref --><p><font size="2" face="Verdana, Arial, Helvetica, sans-serif"><b>&#91;3&#93;</b> Pearn, W., Kotz, S. and   Johnson, N.L., Distributional and inferential properties of process capability   indices. Journal of Quality Technology, 24, pp. 216-231, 1992.    &nbsp;&nbsp;&nbsp;&nbsp;&nbsp;&nbsp;&nbsp;&nbsp;[&#160;<a href="javascript:void(0);" onclick="javascript: window.open('/scielo.php?script=sci_nlinks&ref=1148099&pid=S0012-7353201600040001100003&lng=','','width=640,height=500,resizable=yes,scrollbars=1,menubar=yes,');">Links</a>&#160;]<!-- end-ref --> </font></p>     <!-- ref --><p><font size="2" face="Verdana, Arial, Helvetica, sans-serif"><b>&#91;4&#93;</b> Ebadi, M. and Shahriari, H., A process capability index for simple linear profile. The International Journal of   Advanced Manufacturing Technology, 64, pp. 857-865, 2013. DOI:   10.1007/s00170-012-4066-7</font>&nbsp;&nbsp;&nbsp;&nbsp;&nbsp;&nbsp;&nbsp;&nbsp;[&#160;<a href="javascript:void(0);" onclick="javascript: window.open('/scielo.php?script=sci_nlinks&ref=1148101&pid=S0012-7353201600040001100004&lng=','','width=640,height=500,resizable=yes,scrollbars=1,menubar=yes,');">Links</a>&#160;]<!-- end-ref --><!-- ref --><p><font size="2" face="Verdana, Arial, Helvetica, sans-serif"><b>&#91;5&#93;</b> Kotz, S. and Johnson, N.L.,   Process Capability Indices. Chapman &amp; Hall, London, 1993.    &nbsp;&nbsp;&nbsp;&nbsp;&nbsp;&nbsp;&nbsp;&nbsp;[&#160;<a href="javascript:void(0);" onclick="javascript: window.open('/scielo.php?script=sci_nlinks&ref=1148102&pid=S0012-7353201600040001100005&lng=','','width=640,height=500,resizable=yes,scrollbars=1,menubar=yes,');">Links</a>&#160;]<!-- end-ref --></font></p>     ]]></body>
<body><![CDATA[<!-- ref --><p><font size="2" face="Verdana, Arial, Helvetica, sans-serif"><b>&#91;6&#93;</b> Chien-Wei, W., Pearn, W.L. and   Kotz, S., An overview of theory and practice on process capability indices for   quality assurance. International Journal of Production Economics, 117, pp.   338-359, 2009. DOI: 10.1016/j.ijpe.2008.11.008</font>&nbsp;&nbsp;&nbsp;&nbsp;&nbsp;&nbsp;&nbsp;&nbsp;[&#160;<a href="javascript:void(0);" onclick="javascript: window.open('/scielo.php?script=sci_nlinks&ref=1148104&pid=S0012-7353201600040001100006&lng=','','width=640,height=500,resizable=yes,scrollbars=1,menubar=yes,');">Links</a>&#160;]<!-- end-ref --><!-- ref --><p><font size="2" face="Verdana, Arial, Helvetica, sans-serif"><b>&#91;7&#93;</b> Pan, J.N., Li, C.I. and Chen,   F.Y., Evaluating environmental performance using new process capability indices   for autocorrelated data. Environmental Monitoring and Assessment, 186, pp.   6369-6384, 2014. DOI: 10.1007/s10661-014-3861-z</font>&nbsp;&nbsp;&nbsp;&nbsp;&nbsp;&nbsp;&nbsp;&nbsp;[&#160;<a href="javascript:void(0);" onclick="javascript: window.open('/scielo.php?script=sci_nlinks&ref=1148105&pid=S0012-7353201600040001100007&lng=','','width=640,height=500,resizable=yes,scrollbars=1,menubar=yes,');">Links</a>&#160;]<!-- end-ref --><!-- ref --><p><font size="2" face="Verdana, Arial, Helvetica, sans-serif"><b>&#91;8&#93;</b> Somerville, S.E. and   Montgomery, D.C., Process capability indices and non-normal distributions.   Quality Engineering, 9, pp. 305-316, 1996. DOI: 10.1080/08982119608919047</font>&nbsp;&nbsp;&nbsp;&nbsp;&nbsp;&nbsp;&nbsp;&nbsp;[&#160;<a href="javascript:void(0);" onclick="javascript: window.open('/scielo.php?script=sci_nlinks&ref=1148106&pid=S0012-7353201600040001100008&lng=','','width=640,height=500,resizable=yes,scrollbars=1,menubar=yes,');">Links</a>&#160;]<!-- end-ref --><!-- ref --><p><font size="2" face="Verdana, Arial, Helvetica, sans-serif"><b>&#91;9&#93;</b> Kotz, S. and Lovelace, C.R.,   Introduction to Process Capability Indices: Theory and Practice. Arnold,   London, 1998.    &nbsp;&nbsp;&nbsp;&nbsp;&nbsp;&nbsp;&nbsp;&nbsp;[&#160;<a href="javascript:void(0);" onclick="javascript: window.open('/scielo.php?script=sci_nlinks&ref=1148107&pid=S0012-7353201600040001100009&lng=','','width=640,height=500,resizable=yes,scrollbars=1,menubar=yes,');">Links</a>&#160;]<!-- end-ref --> </font></p>     <!-- ref --><p><font size="2" face="Verdana, Arial, Helvetica, sans-serif"><b>&#91;10&#93;</b> Shore, H., A new approach to analysing   non-normal quality data with applications to process capability analysis.   International Journal of Production Research, 36, pp. 1917-1933, 1998. DOI:   10.1080/002075498193039</font>&nbsp;&nbsp;&nbsp;&nbsp;&nbsp;&nbsp;&nbsp;&nbsp;[&#160;<a href="javascript:void(0);" onclick="javascript: window.open('/scielo.php?script=sci_nlinks&ref=1148109&pid=S0012-7353201600040001100010&lng=','','width=640,height=500,resizable=yes,scrollbars=1,menubar=yes,');">Links</a>&#160;]<!-- end-ref --><!-- ref --><p><font size="2" face="Verdana, Arial, Helvetica, sans-serif"><b>&#91;11&#93;</b> Tang, L.C. and Than, S.E.,   Computing process capability indices for non normal data: A review and   comparative study. Quality and Reliability Engineering International, 15, pp.   339-353, 1999. DOI:   10.1002/(SICI)1099-1638(199909/10)15:5&lt;339::AID-QRE259&gt;3.0.CO;2-A</font>&nbsp;&nbsp;&nbsp;&nbsp;&nbsp;&nbsp;&nbsp;&nbsp;[&#160;<a href="javascript:void(0);" onclick="javascript: window.open('/scielo.php?script=sci_nlinks&ref=1148110&pid=S0012-7353201600040001100011&lng=','','width=640,height=500,resizable=yes,scrollbars=1,menubar=yes,');">Links</a>&#160;]<!-- end-ref --><!-- ref --><p><font size="2" face="Verdana, Arial, Helvetica, sans-serif"><b>&#91;12&#93;</b> Chang, Y.S., Choi, I.S. and   Bai, D.S., Quality and Reliability Engineering International, 18, pp. 383-393,   2002.    &nbsp;&nbsp;&nbsp;&nbsp;&nbsp;&nbsp;&nbsp;&nbsp;[&#160;<a href="javascript:void(0);" onclick="javascript: window.open('/scielo.php?script=sci_nlinks&ref=1148111&pid=S0012-7353201600040001100012&lng=','','width=640,height=500,resizable=yes,scrollbars=1,menubar=yes,');">Links</a>&#160;]<!-- end-ref --></font></p>     <!-- ref --><p><font size="2" face="Verdana, Arial, Helvetica, sans-serif"><b>&#91;13&#93;</b> Pearn, W.L. and Chen, K.S.,   One-sided capability indices Cpu and Cpl: decision making with sample   information. International Journal of Quality and Reliability Management, 19,   pp. 221-245, 2002. DOI: 10.1108/02656710210421544</font>&nbsp;&nbsp;&nbsp;&nbsp;&nbsp;&nbsp;&nbsp;&nbsp;[&#160;<a href="javascript:void(0);" onclick="javascript: window.open('/scielo.php?script=sci_nlinks&ref=1148113&pid=S0012-7353201600040001100013&lng=','','width=640,height=500,resizable=yes,scrollbars=1,menubar=yes,');">Links</a>&#160;]<!-- end-ref --><!-- ref --><p><font size="2" face="Verdana, Arial, Helvetica, sans-serif"><b>&#91;14&#93;</b> Kotz, S. and Johnson, N.L.,   Process capability indices -A review, 1992-2000 with discussion. Journal of   Quality Technology, 34, pp. 2-53, 2002.    &nbsp;&nbsp;&nbsp;&nbsp;&nbsp;&nbsp;&nbsp;&nbsp;[&#160;<a href="javascript:void(0);" onclick="javascript: window.open('/scielo.php?script=sci_nlinks&ref=1148114&pid=S0012-7353201600040001100014&lng=','','width=640,height=500,resizable=yes,scrollbars=1,menubar=yes,');">Links</a>&#160;]<!-- end-ref --> </font></p>     <!-- ref --><p><font size="2" face="Verdana, Arial, Helvetica, sans-serif"><b>&#91;15&#93;</b> Grau, D., New process   capability indices for one-sided tolerances. Quality Technology &amp; Quantitative   Management, 6, pp. 107-124, 2009.    &nbsp;&nbsp;&nbsp;&nbsp;&nbsp;&nbsp;&nbsp;&nbsp;[&#160;<a href="javascript:void(0);" onclick="javascript: window.open('/scielo.php?script=sci_nlinks&ref=1148116&pid=S0012-7353201600040001100015&lng=','','width=640,height=500,resizable=yes,scrollbars=1,menubar=yes,');">Links</a>&#160;]<!-- end-ref --></font></p>     <!-- ref --><p><font size="2" face="Verdana, Arial, Helvetica, sans-serif"><b>&#91;16&#93;</b> Grau, D., Process yield,   process centering and capability indices for one-sided tolerance processes.   Quality Technology &amp; Quantitative Management, 9, pp. 153-170, 2012.    &nbsp;&nbsp;&nbsp;&nbsp;&nbsp;&nbsp;&nbsp;&nbsp;[&#160;<a href="javascript:void(0);" onclick="javascript: window.open('/scielo.php?script=sci_nlinks&ref=1148118&pid=S0012-7353201600040001100016&lng=','','width=640,height=500,resizable=yes,scrollbars=1,menubar=yes,');">Links</a>&#160;]<!-- end-ref --></font></p>     <!-- ref --><p><font size="2" face="Verdana, Arial, Helvetica, sans-serif"><b>&#91;17&#93;</b> Heavlin, W.D., Statistical   properties of capability indices. Technical Report 320. Technical Library,   Advanced Micro Devices, Inc., Sunnyvale, CA, 1988.    &nbsp;&nbsp;&nbsp;&nbsp;&nbsp;&nbsp;&nbsp;&nbsp;[&#160;<a href="javascript:void(0);" onclick="javascript: window.open('/scielo.php?script=sci_nlinks&ref=1148120&pid=S0012-7353201600040001100017&lng=','','width=640,height=500,resizable=yes,scrollbars=1,menubar=yes,');">Links</a>&#160;]<!-- end-ref --></font></p>     <!-- ref --><p><font size="2" face="Verdana, Arial, Helvetica, sans-serif"><b>&#91;18&#93;</b> Borges, W. and Ho, L.L., A   fraction defective based capability index. Quality and Reliability Engineering   International, 17, pp. 447-458, 2001. DOI: 10.1002/qre.438</font>&nbsp;&nbsp;&nbsp;&nbsp;&nbsp;&nbsp;&nbsp;&nbsp;[&#160;<a href="javascript:void(0);" onclick="javascript: window.open('/scielo.php?script=sci_nlinks&ref=1148122&pid=S0012-7353201600040001100018&lng=','','width=640,height=500,resizable=yes,scrollbars=1,menubar=yes,');">Links</a>&#160;]<!-- end-ref --><!-- ref --><p><font size="2" face="Verdana, Arial, Helvetica, sans-serif"><b>&#91;19&#93;</b> Huber, P., Robust Statistics.   John Wiley &amp; Sons, New York, 1981. DOI: 10.1007/978-3-642-04898-2_594</font>&nbsp;&nbsp;&nbsp;&nbsp;&nbsp;&nbsp;&nbsp;&nbsp;[&#160;<a href="javascript:void(0);" onclick="javascript: window.open('/scielo.php?script=sci_nlinks&ref=1148123&pid=S0012-7353201600040001100019&lng=','','width=640,height=500,resizable=yes,scrollbars=1,menubar=yes,');">Links</a>&#160;]<!-- end-ref --><!-- ref --><p><font size="2" face="Verdana, Arial, Helvetica, sans-serif"><b>&#91;20&#93;</b> Abu-Shawiesh, M.O. and   Abdullah, M.B., New robust statistical process control chart for location.   Quality Engineering, 12, pp. 149-159, 1999. DOI: 10.1080/08982119908962572</font>&nbsp;&nbsp;&nbsp;&nbsp;&nbsp;&nbsp;&nbsp;&nbsp;[&#160;<a href="javascript:void(0);" onclick="javascript: window.open('/scielo.php?script=sci_nlinks&ref=1148124&pid=S0012-7353201600040001100020&lng=','','width=640,height=500,resizable=yes,scrollbars=1,menubar=yes,');">Links</a>&#160;]<!-- end-ref --><!-- ref --><p><font size="2" face="Verdana, Arial, Helvetica, sans-serif"><b>&#91;21&#93;</b> Grznar, J. and Booth, D.E., A   robust smoothing approach to statistical process control. Journal of Chemical   Information and Computer Sciences, 37, pp. 241-248, 1997. DOI:   10.1021/ci9600317</font>&nbsp;&nbsp;&nbsp;&nbsp;&nbsp;&nbsp;&nbsp;&nbsp;[&#160;<a href="javascript:void(0);" onclick="javascript: window.open('/scielo.php?script=sci_nlinks&ref=1148125&pid=S0012-7353201600040001100021&lng=','','width=640,height=500,resizable=yes,scrollbars=1,menubar=yes,');">Links</a>&#160;]<!-- end-ref --><!-- ref --><p><font size="2" face="Verdana, Arial, Helvetica, sans-serif"><b>&#91;22&#93;</b> Kocherlakota, S. and Kocherlakota,   K., Confidence intervals for the process capability ratio based on robust   estimators. Communications in Statistics - Theory and Methods, 23, pp. 257-276,   1994. DOI: 10.1080/03610929408831252</font>&nbsp;&nbsp;&nbsp;&nbsp;&nbsp;&nbsp;&nbsp;&nbsp;[&#160;<a href="javascript:void(0);" onclick="javascript: window.open('/scielo.php?script=sci_nlinks&ref=1148126&pid=S0012-7353201600040001100022&lng=','','width=640,height=500,resizable=yes,scrollbars=1,menubar=yes,');">Links</a>&#160;]<!-- end-ref --><!-- ref --><p><font size="2" face="Verdana, Arial, Helvetica, sans-serif"><b>&#91;23&#93;</b> Prasad, S. and Bramorski, T.,   Robust process capability indices. International Journal of Management Science,   26, pp. 425-435, 1998. DOI: 10.1016/S0305-0483(97)00075-3</font>&nbsp;&nbsp;&nbsp;&nbsp;&nbsp;&nbsp;&nbsp;&nbsp;[&#160;<a href="javascript:void(0);" onclick="javascript: window.open('/scielo.php?script=sci_nlinks&ref=1148127&pid=S0012-7353201600040001100023&lng=','','width=640,height=500,resizable=yes,scrollbars=1,menubar=yes,');">Links</a>&#160;]<!-- end-ref --><!-- ref --><p><font size="2" face="Verdana, Arial, Helvetica, sans-serif"><b>&#91;24&#93;</b> Yeh, A.B. and Bhattacharya, S.,   A robust process capability index. Communications in Statistics - Simulation   and Computation, 27, pp. 565-589, 1998. DOI: 10.1080/03610919808813495</font>&nbsp;&nbsp;&nbsp;&nbsp;&nbsp;&nbsp;&nbsp;&nbsp;[&#160;<a href="javascript:void(0);" onclick="javascript: window.open('/scielo.php?script=sci_nlinks&ref=1148128&pid=S0012-7353201600040001100024&lng=','','width=640,height=500,resizable=yes,scrollbars=1,menubar=yes,');">Links</a>&#160;]<!-- end-ref --><!-- ref --><p><font size="2" face="Verdana, Arial, Helvetica, sans-serif"><b>&#91;25&#93;</b> Kane, V.E., Process capability   indices. Journal of Quality Technology, 18, pp. 41-52, 1986.    &nbsp;&nbsp;&nbsp;&nbsp;&nbsp;&nbsp;&nbsp;&nbsp;[&#160;<a href="javascript:void(0);" onclick="javascript: window.open('/scielo.php?script=sci_nlinks&ref=1148129&pid=S0012-7353201600040001100025&lng=','','width=640,height=500,resizable=yes,scrollbars=1,menubar=yes,');">Links</a>&#160;]<!-- end-ref --> </font></p>     <!-- ref --><p><font size="2" face="Verdana, Arial, Helvetica, sans-serif"><b>&#91;26&#93;</b> Montgomery, D.C., Introduction   to Statistical Quality Control, 6th edition. John Wiley &amp; Sons, New York,   2009. DOI: 10.1002/qre.4680070316</font>&nbsp;&nbsp;&nbsp;&nbsp;&nbsp;&nbsp;&nbsp;&nbsp;[&#160;<a href="javascript:void(0);" onclick="javascript: window.open('/scielo.php?script=sci_nlinks&ref=1148131&pid=S0012-7353201600040001100026&lng=','','width=640,height=500,resizable=yes,scrollbars=1,menubar=yes,');">Links</a>&#160;]<!-- end-ref --><!-- ref --><p><font size="2" face="Verdana, Arial, Helvetica, sans-serif"><b>&#91;27&#93;</b> Lin, P.C. and Pearn, W.L.,   Testing process capability for one-sided specification limit with application   to the voltage level translator. Microelectronics Reliability, 42, pp.   1975-1983, 2002. DOI: 10.1016/S0026-2714(02)00103-8</font>&nbsp;&nbsp;&nbsp;&nbsp;&nbsp;&nbsp;&nbsp;&nbsp;[&#160;<a href="javascript:void(0);" onclick="javascript: window.open('/scielo.php?script=sci_nlinks&ref=1148132&pid=S0012-7353201600040001100027&lng=','','width=640,height=500,resizable=yes,scrollbars=1,menubar=yes,');">Links</a>&#160;]<!-- end-ref --><!-- ref --><p><font size="2" face="Verdana, Arial, Helvetica, sans-serif"><b>&#91;28&#93;</b> Shu, M.H., Lu, K.H., Hsu, B.M.   and Lou, K.R., Testing quality assurance using process capability indices CPU   and CPL based on several groups of samples with unequal sizes. Information and   Management Sciences, 17, pp. 47-65, 2006.    &nbsp;&nbsp;&nbsp;&nbsp;&nbsp;&nbsp;&nbsp;&nbsp;[&#160;<a href="javascript:void(0);" onclick="javascript: window.open('/scielo.php?script=sci_nlinks&ref=1148133&pid=S0012-7353201600040001100028&lng=','','width=640,height=500,resizable=yes,scrollbars=1,menubar=yes,');">Links</a>&#160;]<!-- end-ref --></font></p>     <!-- ref --><p><font size="2" face="Verdana, Arial, Helvetica, sans-serif"><b>&#91;29&#93;</b> Mathew, T., Sebastian, G. and   Kurian, K.M., Generalized confidence intervals for process capability indices.   Quality and Reliability Engineering International, 23, pp. 471-481, 2007. DOI:   10.1002/qre.828</font>&nbsp;&nbsp;&nbsp;&nbsp;&nbsp;&nbsp;&nbsp;&nbsp;[&#160;<a href="javascript:void(0);" onclick="javascript: window.open('/scielo.php?script=sci_nlinks&ref=1148135&pid=S0012-7353201600040001100029&lng=','','width=640,height=500,resizable=yes,scrollbars=1,menubar=yes,');">Links</a>&#160;]<!-- end-ref --><!-- ref --><p><font size="2" face="Verdana, Arial, Helvetica, sans-serif"><b>&#91;30&#93;</b> Albing, M., Process capability   indices for Weibull distributions and upper specification limits. Quality and   Reliability Engineering International, 25, pp. 317-334, 2009. DOI:   10.1002/qre.972</font>&nbsp;&nbsp;&nbsp;&nbsp;&nbsp;&nbsp;&nbsp;&nbsp;[&#160;<a href="javascript:void(0);" onclick="javascript: window.open('/scielo.php?script=sci_nlinks&ref=1148136&pid=S0012-7353201600040001100030&lng=','','width=640,height=500,resizable=yes,scrollbars=1,menubar=yes,');">Links</a>&#160;]<!-- end-ref --><!-- ref --><p><font size="2" face="Verdana, Arial, Helvetica, sans-serif"><b>&#91;31&#93;</b> Hall, P. and Wilson, S.R., Two   guidelines for bootstrap hypothesis testing. Biometrics, 47, pp. 757-762, 1991.   DOI: 10.2307/2532163</font>&nbsp;&nbsp;&nbsp;&nbsp;&nbsp;&nbsp;&nbsp;&nbsp;[&#160;<a href="javascript:void(0);" onclick="javascript: window.open('/scielo.php?script=sci_nlinks&ref=1148137&pid=S0012-7353201600040001100031&lng=','','width=640,height=500,resizable=yes,scrollbars=1,menubar=yes,');">Links</a>&#160;]<!-- end-ref --><!-- ref --><p><font size="2" face="Verdana, Arial, Helvetica, sans-serif"><b>&#91;32&#93;</b> Becher, H., Hall. P. and Wilson,   S.R., Bootstrap hypothesis testing procedures. Biometrics, 49, pp. 1268-1272,   1993. DOI: 10.2307/2532271</font>&nbsp;&nbsp;&nbsp;&nbsp;&nbsp;&nbsp;&nbsp;&nbsp;[&#160;<a href="javascript:void(0);" onclick="javascript: window.open('/scielo.php?script=sci_nlinks&ref=1148138&pid=S0012-7353201600040001100032&lng=','','width=640,height=500,resizable=yes,scrollbars=1,menubar=yes,');">Links</a>&#160;]<!-- end-ref --><!-- ref --><p><font size="2" face="Verdana, Arial, Helvetica, sans-serif"><b>&#91;33&#93;</b> Hall, P., The Bootstrap and   Edgeworth Expansion. Springer, NewYork, 1992. DOI: 10.1007/978-1-4612-4384-7</font>&nbsp;&nbsp;&nbsp;&nbsp;&nbsp;&nbsp;&nbsp;&nbsp;[&#160;<a href="javascript:void(0);" onclick="javascript: window.open('/scielo.php?script=sci_nlinks&ref=1148139&pid=S0012-7353201600040001100033&lng=','','width=640,height=500,resizable=yes,scrollbars=1,menubar=yes,');">Links</a>&#160;]<!-- end-ref --><!-- ref --><p><font size="2" face="Verdana, Arial, Helvetica, sans-serif"><b>&#91;34&#93;</b> Franklin, L.A. and Wasserman,   G., Bootstrap confidence intervals of Cpk: An introduction. Communications in   Statistics - Simulation and Computation, 20, pp. 231-242, 1991. DOI:   10.1080/03610919108812950</font>&nbsp;&nbsp;&nbsp;&nbsp;&nbsp;&nbsp;&nbsp;&nbsp;[&#160;<a href="javascript:void(0);" onclick="javascript: window.open('/scielo.php?script=sci_nlinks&ref=1148140&pid=S0012-7353201600040001100034&lng=','','width=640,height=500,resizable=yes,scrollbars=1,menubar=yes,');">Links</a>&#160;]<!-- end-ref --><!-- ref --><p><font size="2" face="Verdana, Arial, Helvetica, sans-serif"><b>&#91;35&#93;</b> Franklin, LA. And Wasserman,   G., Bootstrap lower confidence limits for process capability indices. Journal   of Quality Technology, 24, pp. 196-210, 1992. DOI: 10.1108/02656710210442875</font>&nbsp;&nbsp;&nbsp;&nbsp;&nbsp;&nbsp;&nbsp;&nbsp;[&#160;<a href="javascript:void(0);" onclick="javascript: window.open('/scielo.php?script=sci_nlinks&ref=1148141&pid=S0012-7353201600040001100035&lng=','','width=640,height=500,resizable=yes,scrollbars=1,menubar=yes,');">Links</a>&#160;]<!-- end-ref --><!-- ref --><p><font size="2" face="Verdana, Arial, Helvetica, sans-serif"><b>&#91;36&#93;</b> Choi, K.C., Nam, K.H. and Park,   D.H., Estimation of capability index based on bootstrap method. Microelectronic   Reliability, 36, pp. 1141-1153, 1996. DOI: 10.1016/0026-2714(95)00211-1</font>&nbsp;&nbsp;&nbsp;&nbsp;&nbsp;&nbsp;&nbsp;&nbsp;[&#160;<a href="javascript:void(0);" onclick="javascript: window.open('/scielo.php?script=sci_nlinks&ref=1148142&pid=S0012-7353201600040001100036&lng=','','width=640,height=500,resizable=yes,scrollbars=1,menubar=yes,');">Links</a>&#160;]<!-- end-ref --><!-- ref --><p><font size="2" face="Verdana, Arial, Helvetica, sans-serif"><b>&#91;37&#93;</b> Tong, L.I. and Chen, J.P.,   Lower confidence limits of process capability indices for nonnormal process   distributions. International Journal of Quality Reliability Management, 15, pp.   907-919, 1998. DOI: 10.1108/02656719810199006</font>&nbsp;&nbsp;&nbsp;&nbsp;&nbsp;&nbsp;&nbsp;&nbsp;[&#160;<a href="javascript:void(0);" onclick="javascript: window.open('/scielo.php?script=sci_nlinks&ref=1148143&pid=S0012-7353201600040001100037&lng=','','width=640,height=500,resizable=yes,scrollbars=1,menubar=yes,');">Links</a>&#160;]<!-- end-ref --><!-- ref --><p><font size="2" face="Verdana, Arial, Helvetica, sans-serif"><b>&#91;38&#93;</b> Balamurali, S. and   Kalyanasundaram, M., Bootstrap lower confidence limits for the process   capability indices Cp, Cpk, and Cpm. International Journal of Quality &amp;   Reliability Management, 19, pp. 1088-1097, 2002. DOI: 10.1108/02656710210442875</font>&nbsp;&nbsp;&nbsp;&nbsp;&nbsp;&nbsp;&nbsp;&nbsp;[&#160;<a href="javascript:void(0);" onclick="javascript: window.open('/scielo.php?script=sci_nlinks&ref=1148144&pid=S0012-7353201600040001100038&lng=','','width=640,height=500,resizable=yes,scrollbars=1,menubar=yes,');">Links</a>&#160;]<!-- end-ref --><!-- ref --><p><font size="2" face="Verdana, Arial, Helvetica, sans-serif"><b>&#91;39&#93;</b> Wang, D.S., Koo, T.Y. and Chou,   C.Y., On the bootstrap confidence intervals of the capability index Cpk for   multiple process streams. International Journal for Computer-Aided Engineering   and Software, 24, pp. 473-485, 2007. DOI: 10.1108/02644400710755870</font>&nbsp;&nbsp;&nbsp;&nbsp;&nbsp;&nbsp;&nbsp;&nbsp;[&#160;<a href="javascript:void(0);" onclick="javascript: window.open('/scielo.php?script=sci_nlinks&ref=1148145&pid=S0012-7353201600040001100039&lng=','','width=640,height=500,resizable=yes,scrollbars=1,menubar=yes,');">Links</a>&#160;]<!-- end-ref --><!-- ref --><p><font size="2" face="Verdana, Arial, Helvetica, sans-serif"><b>&#91;40&#93;</b> Efron, B., The Jackknife, the   Bootstrap and other Resampling Plans. Society for Industrial and Applied   Mathematics, Pennsylvania, 1982.    &nbsp;&nbsp;&nbsp;&nbsp;&nbsp;&nbsp;&nbsp;&nbsp;[&#160;<a href="javascript:void(0);" onclick="javascript: window.open('/scielo.php?script=sci_nlinks&ref=1148146&pid=S0012-7353201600040001100040&lng=','','width=640,height=500,resizable=yes,scrollbars=1,menubar=yes,');">Links</a>&#160;]<!-- end-ref --> </font></p>     <!-- ref --><p><font size="2" face="Verdana, Arial, Helvetica, sans-serif"><b>&#91;41&#93;</b> Efron, B. and Tibshirani, R.J.,   Bootstrap methods for standard errors, confidence intervals, and other measures   of statistical accuracy. Statistical Science, 1, pp. 54-77, 1986. DOI:   10.1214/ss/1177013815</font>&nbsp;&nbsp;&nbsp;&nbsp;&nbsp;&nbsp;&nbsp;&nbsp;[&#160;<a href="javascript:void(0);" onclick="javascript: window.open('/scielo.php?script=sci_nlinks&ref=1148148&pid=S0012-7353201600040001100041&lng=','','width=640,height=500,resizable=yes,scrollbars=1,menubar=yes,');">Links</a>&#160;]<!-- end-ref --><!-- ref --><p><font size="2" face="Verdana, Arial, Helvetica, sans-serif"><b>&#91;42&#93;</b> Torres, L.M., Castellanos, &Oacute;.F.   and F&uacute;quene, A.M., Evaluating Colombian SMEs technological innovation: Part 1:   Conceptual basis, evaluation methodology and characterisation of innovative   companies. Ingenier&iacute;a e Investigaci&oacute;n, 27(1), pp. 158-167, 2007.    &nbsp;&nbsp;&nbsp;&nbsp;&nbsp;&nbsp;&nbsp;&nbsp;[&#160;<a href="javascript:void(0);" onclick="javascript: window.open('/scielo.php?script=sci_nlinks&ref=1148149&pid=S0012-7353201600040001100042&lng=','','width=640,height=500,resizable=yes,scrollbars=1,menubar=yes,');">Links</a>&#160;]<!-- end-ref --></font></p>     <!-- ref --><p><font size="2" face="Verdana, Arial, Helvetica, sans-serif"><b>&#91;43&#93;</b> Jim&eacute;nez, C., Cristancho, A. and   Castellanos, O., The role of capability in technology valuation. Ingenier&iacute;a e   Investigaci&oacute;n, 31(2), pp. 112-123, 2011.    &nbsp;&nbsp;&nbsp;&nbsp;&nbsp;&nbsp;&nbsp;&nbsp;[&#160;<a href="javascript:void(0);" onclick="javascript: window.open('/scielo.php?script=sci_nlinks&ref=1148151&pid=S0012-7353201600040001100043&lng=','','width=640,height=500,resizable=yes,scrollbars=1,menubar=yes,');">Links</a>&#160;]<!-- end-ref --></font></p>     <!-- ref --><p><font size="2" face="Verdana, Arial, Helvetica, sans-serif"><b>&#91;44&#93;</b> Cort&eacute;s, H., Gallego, L. and   Rodr&iacute;guez, G., The engineering faculty today: An approach towards consolidating   academic indicators. Ingenier&iacute;a e Investigaci&oacute;n, 31, pp. 74-90, 2011.    &nbsp;&nbsp;&nbsp;&nbsp;&nbsp;&nbsp;&nbsp;&nbsp;[&#160;<a href="javascript:void(0);" onclick="javascript: window.open('/scielo.php?script=sci_nlinks&ref=1148153&pid=S0012-7353201600040001100044&lng=','','width=640,height=500,resizable=yes,scrollbars=1,menubar=yes,');">Links</a>&#160;]<!-- end-ref --></font></p>     <!-- ref --><p><font size="2" face="Verdana, Arial, Helvetica, sans-serif"><b>&#91;45&#93;</b> Zaragoza-Fern&aacute;ndez, S.,   Tarr&iacute;o-Saavedra, J., Naya, S., L&oacute;pez-Beceiro, J. and &Aacute;lvarez-Garc&iacute;a, A., Impact   estimates of the actions for the rehabilitation of energy efficiency in   residential building. DYNA, 81(186), pp. 200-207, 2014. DOI: 10.15446/dyna.v81n186.39930</font>&nbsp;&nbsp;&nbsp;&nbsp;&nbsp;&nbsp;&nbsp;&nbsp;[&#160;<a href="javascript:void(0);" onclick="javascript: window.open('/scielo.php?script=sci_nlinks&ref=1148155&pid=S0012-7353201600040001100045&lng=','','width=640,height=500,resizable=yes,scrollbars=1,menubar=yes,');">Links</a>&#160;]<!-- end-ref --><!-- ref --><p><font size="2" face="Verdana, Arial, Helvetica, sans-serif"><b>&#91;46&#93;</b> Castrill&oacute;n, R.D.P., Gonz&aacute;lez,   A.J. and Ciro-Quispe, E., Energy efficiency improvement in the cement industry   by wet process through integral energy management system implementation. DYNA,   80(177), pp. 115-123, 2013.    &nbsp;&nbsp;&nbsp;&nbsp;&nbsp;&nbsp;&nbsp;&nbsp;[&#160;<a href="javascript:void(0);" onclick="javascript: window.open('/scielo.php?script=sci_nlinks&ref=1148156&pid=S0012-7353201600040001100046&lng=','','width=640,height=500,resizable=yes,scrollbars=1,menubar=yes,');">Links</a>&#160;]<!-- end-ref --></font></p>     <p>&nbsp;</p>     <p><font size="2" face="Verdana, Arial, Helvetica, sans-serif"><b>S. Naya,</b> is   professor in statistics at the University of A Coru&ntilde;a, Spain. He received a   BSc. and MSc. in Mathematics from the University of Santiago de Compostela,   Spain and a PhD in Industrial Engineering from the University of A Coru&ntilde;a,   Spain with a with a Cum Laude mention of excellence. His main   scientific-technical fields of interest are Statistical Quality Control,   Reliability and Statistical Applications in Materials Engineering. He is an   Elected Member of the ISI (International Statistical Institute) and was given   the International Educator Award in 2013 from the Juarez Lincoln Mart&iacute; Project.   Currently he is Vice rector for Science Policy, Research and Transfer at the   University of A Coru&ntilde;a. ORCID: 0000-0003-4931-9859.</font></p>     <p><font size="2" face="Verdana, Arial, Helvetica, sans-serif"><b>A. Devia-Rivera, </b>is an Excess and   Obsolescence Planner at the Commercial Marketing Department of Avon Cosmetics   in Madrid, Spain. He is a Statistical Engineer graduate from the University of   Santiago de Chile, Chile. In 2008 he received a Diploma of Advanced Studies in   Statistics and Operations Research from the University of A Coru&ntilde;a, Spain. He   obtained his PhD in Statistics and Operations Research in January 2016 with a   Cum Laude mention of excellence. His main scientific fields of interest are   Statistical Modeling in Finance and Engineering. He has taught several courses   in statistics, probability and time series as assistant professor in Chile, and   he has published papers and short communications in the field of Statistical   Modeling of Credit Risk. ORCID: 0000-0002-6499-5233</font></p>     <p><font size="2" face="Verdana, Arial, Helvetica, sans-serif"><b>J. Tarr&iacute;o-Saavedra,</b> is an Industrial   Engineer, has a MSc. and PhD in Statistics and Operations Research from the   University of A Coru&ntilde;a (UDC). He was given a special PhD award in the area of   Mathematics and Computer Science. Currently he is a Professor in Statistics,   Statistical Quality Control, and Thermomechanical Fatigue on undergraduate and   Master's degrees in the UDC. He has participated in 14 projects and research   contracts with public and private entities. He is author of 34 scientific   articles, 4 book chapters and 60 conference papers related to statistics,   materials science, engineering and bibliometrics. He has conducted research at   the University Paris Diderot - Paris 7. ORCID ID: 0000-0002-9584-127X</font></p>     <p><font size="2" face="Verdana, Arial, Helvetica, sans-serif"><b>M.A. Flores,</b> is a professor at the   National Polytechnic School and a researcher at the Center for Modeling   Mathematics at the National Polytechnic School in Quito, Ecuador. He is a BSc.   in Statistical Computing Engineer from the Polytechnic School of the Coast. In   2006 he received a in MSc. in Operations Research from the National Polytechnic   School, and in 2013 received a MSc. in Technical Statistics from the University   of A Coru&ntilde;a. He is currently a doctoral student at the University of A Coru&ntilde;a   in the area of Statistics and Operations Research. He has over 14 years   professional experience in various areas of Statistics, Computing and   Optimization, multivariate data analysis, econometric, Market Research, Quality   Control, definition and construction of systems indicators, development of   applications and optimization modeling. ORCID ID: 0000-0002-7742-1247</font></p>      ]]></body><back>
<ref-list>
<ref id="B1">
<label>1</label><nlm-citation citation-type="journal">
<person-group person-group-type="author">
<name>
<surname><![CDATA[Chou]]></surname>
<given-names><![CDATA[Y.M.]]></given-names>
</name>
<name>
<surname><![CDATA[Owen]]></surname>
<given-names><![CDATA[D.B.]]></given-names>
</name>
</person-group>
<article-title xml:lang="en"><![CDATA[On the distribution of the estimated process capability indices]]></article-title>
<source><![CDATA[Communications in Statistics - Theory and Methods]]></source>
<year>1989</year>
<numero>18</numero>
<issue>18</issue>
<page-range>4549-4560</page-range></nlm-citation>
</ref>
<ref id="B2">
<label>2</label><nlm-citation citation-type="journal">
<person-group person-group-type="author">
<name>
<surname><![CDATA[Clements]]></surname>
<given-names><![CDATA[J.A.]]></given-names>
</name>
</person-group>
<article-title xml:lang="en"><![CDATA[Process capability indices for non normal calculations.]]></article-title>
<source><![CDATA[Quality Progress]]></source>
<year>1989</year>
<numero>22</numero>
<issue>22</issue>
<page-range>49-55</page-range></nlm-citation>
</ref>
<ref id="B3">
<label>3</label><nlm-citation citation-type="journal">
<person-group person-group-type="author">
<name>
<surname><![CDATA[Pearn]]></surname>
<given-names><![CDATA[W.]]></given-names>
</name>
<name>
<surname><![CDATA[Kotz]]></surname>
<given-names><![CDATA[S.]]></given-names>
</name>
<name>
<surname><![CDATA[Johnson]]></surname>
<given-names><![CDATA[N.L.]]></given-names>
</name>
</person-group>
<article-title xml:lang="en"><![CDATA[Distributional and inferential properties of process capability indices]]></article-title>
<source><![CDATA[Journal of Quality Technology]]></source>
<year>1992</year>
<volume>24</volume>
<page-range>216-231</page-range></nlm-citation>
</ref>
<ref id="B4">
<label>4</label><nlm-citation citation-type="journal">
<person-group person-group-type="author">
<name>
<surname><![CDATA[Ebadi]]></surname>
<given-names><![CDATA[M.]]></given-names>
</name>
<name>
<surname><![CDATA[Shahriari]]></surname>
<given-names><![CDATA[H.]]></given-names>
</name>
</person-group>
<article-title xml:lang="en"><![CDATA[A process capability index for simple linear profile.]]></article-title>
<source><![CDATA[The International Journal of Advanced Manufacturing Technology]]></source>
<year>2013</year>
<volume>64</volume>
<page-range>857-865</page-range></nlm-citation>
</ref>
<ref id="B5">
<label>5</label><nlm-citation citation-type="book">
<person-group person-group-type="author">
<name>
<surname><![CDATA[Kotz]]></surname>
<given-names><![CDATA[S.]]></given-names>
</name>
<name>
<surname><![CDATA[Johnson]]></surname>
<given-names><![CDATA[N.L.]]></given-names>
</name>
</person-group>
<source><![CDATA[Process Capability Indices.]]></source>
<year>1993</year>
<publisher-loc><![CDATA[London ]]></publisher-loc>
<publisher-name><![CDATA[Chapman & Hall]]></publisher-name>
</nlm-citation>
</ref>
<ref id="B6">
<label>6</label><nlm-citation citation-type="journal">
<person-group person-group-type="author">
<name>
<surname><![CDATA[Chien-Wei]]></surname>
<given-names><![CDATA[W.]]></given-names>
</name>
<name>
<surname><![CDATA[Pearn]]></surname>
<given-names><![CDATA[W. L.]]></given-names>
</name>
<name>
<surname><![CDATA[Kotz]]></surname>
<given-names><![CDATA[S.]]></given-names>
</name>
</person-group>
<article-title xml:lang="en"><![CDATA[An overview of theory and practice on process capability indices for quality assurance]]></article-title>
<source><![CDATA[International Journal of Production Economics]]></source>
<year>2009</year>
<numero>117</numero>
<issue>117</issue>
<page-range>338-359</page-range></nlm-citation>
</ref>
<ref id="B7">
<label>7</label><nlm-citation citation-type="journal">
<person-group person-group-type="author">
<name>
<surname><![CDATA[Pan]]></surname>
<given-names><![CDATA[J.N.]]></given-names>
</name>
<name>
<surname><![CDATA[Li]]></surname>
<given-names><![CDATA[C.I.]]></given-names>
</name>
<name>
<surname><![CDATA[Chen]]></surname>
<given-names><![CDATA[F.Y.]]></given-names>
</name>
</person-group>
<article-title xml:lang="en"><![CDATA[Evaluating environmental performance using new process capability indices for autocorrelated data.]]></article-title>
<source><![CDATA[Environmental Monitoring and Assessment]]></source>
<year>2014</year>
<numero>186</numero>
<issue>186</issue>
<page-range>6369-6384</page-range></nlm-citation>
</ref>
<ref id="B8">
<label>8</label><nlm-citation citation-type="journal">
<person-group person-group-type="author">
<name>
<surname><![CDATA[Somerville]]></surname>
<given-names><![CDATA[S.E.]]></given-names>
</name>
<name>
<surname><![CDATA[Montgomery]]></surname>
<given-names><![CDATA[D.C.]]></given-names>
</name>
</person-group>
<article-title xml:lang="en"><![CDATA[Process capability indices and non-normal distributions.]]></article-title>
<source><![CDATA[Quality Engineering]]></source>
<year>1996</year>
<numero>9</numero>
<issue>9</issue>
<page-range>305-316</page-range></nlm-citation>
</ref>
<ref id="B9">
<label>9</label><nlm-citation citation-type="book">
<person-group person-group-type="author">
<name>
<surname><![CDATA[Kotz]]></surname>
<given-names><![CDATA[S.]]></given-names>
</name>
<name>
<surname><![CDATA[Lovelace]]></surname>
<given-names><![CDATA[C.R.]]></given-names>
</name>
</person-group>
<source><![CDATA[Introduction to Process Capability Indices: Theory and Practice]]></source>
<year>1998</year>
<publisher-loc><![CDATA[London ]]></publisher-loc>
<publisher-name><![CDATA[Arnold]]></publisher-name>
</nlm-citation>
</ref>
<ref id="B10">
<label>10</label><nlm-citation citation-type="journal">
<person-group person-group-type="author">
<name>
<surname><![CDATA[Shore]]></surname>
<given-names><![CDATA[H.]]></given-names>
</name>
</person-group>
<article-title xml:lang="en"><![CDATA[A new approach to analysing non-normal quality data with applications to process capability analysis.]]></article-title>
<source><![CDATA[International Journal of Production Research]]></source>
<year>1998</year>
<numero>36</numero>
<issue>36</issue>
<page-range>1917-1933</page-range></nlm-citation>
</ref>
<ref id="B11">
<label>11</label><nlm-citation citation-type="journal">
<person-group person-group-type="author">
<name>
<surname><![CDATA[Tang]]></surname>
<given-names><![CDATA[L.C.]]></given-names>
</name>
<name>
<surname><![CDATA[Than]]></surname>
<given-names><![CDATA[S.E.]]></given-names>
</name>
</person-group>
<article-title xml:lang="en"><![CDATA[Computing process capability indices for non normal data: A review and comparative study]]></article-title>
<source><![CDATA[Quality and Reliability Engineering International]]></source>
<year>1999</year>
<numero>15</numero>
<issue>15</issue>
<page-range>339-353</page-range></nlm-citation>
</ref>
<ref id="B12">
<label>12</label><nlm-citation citation-type="journal">
<person-group person-group-type="author">
<name>
<surname><![CDATA[Chang]]></surname>
<given-names><![CDATA[Y.S.]]></given-names>
</name>
<name>
<surname><![CDATA[Choi]]></surname>
<given-names><![CDATA[I.S.]]></given-names>
</name>
<name>
<surname><![CDATA[Bai]]></surname>
<given-names><![CDATA[D.S.]]></given-names>
</name>
</person-group>
<source><![CDATA[Quality and Reliability Engineering International]]></source>
<year>2002</year>
<numero>18</numero>
<issue>18</issue>
<page-range>383-393</page-range></nlm-citation>
</ref>
<ref id="B13">
<label>13</label><nlm-citation citation-type="journal">
<person-group person-group-type="author">
<name>
<surname><![CDATA[Pearn]]></surname>
<given-names><![CDATA[W. L.]]></given-names>
</name>
<name>
<surname><![CDATA[Chen]]></surname>
<given-names><![CDATA[K.S.]]></given-names>
</name>
</person-group>
<article-title xml:lang="en"><![CDATA[One-sided capability indices Cpu and Cpl: decision making with sample information.]]></article-title>
<source><![CDATA[International Journal of Quality and Reliability Management]]></source>
<year>2002</year>
<numero>19</numero>
<issue>19</issue>
<page-range>221-245</page-range></nlm-citation>
</ref>
<ref id="B14">
<label>14</label><nlm-citation citation-type="journal">
<person-group person-group-type="author">
<name>
<surname><![CDATA[Kotz]]></surname>
<given-names><![CDATA[S.]]></given-names>
</name>
<name>
<surname><![CDATA[Johnson]]></surname>
<given-names><![CDATA[N.L.]]></given-names>
</name>
</person-group>
<article-title xml:lang="en"><![CDATA[Process capability indices: A review, 1992-2000 with discussion]]></article-title>
<source><![CDATA[Journal of Quality Technology]]></source>
<year>2002</year>
<numero>34</numero>
<issue>34</issue>
<page-range>2-53</page-range></nlm-citation>
</ref>
<ref id="B15">
<label>15</label><nlm-citation citation-type="journal">
<person-group person-group-type="author">
<name>
<surname><![CDATA[Grau]]></surname>
<given-names><![CDATA[D.]]></given-names>
</name>
</person-group>
<article-title xml:lang="en"><![CDATA[New process capability indices for one-sided tolerances.]]></article-title>
<source><![CDATA[Quality Technology & Quantitative Management]]></source>
<year>2009</year>
<numero>6</numero>
<issue>6</issue>
<page-range>107-124</page-range></nlm-citation>
</ref>
<ref id="B16">
<label>16</label><nlm-citation citation-type="journal">
<person-group person-group-type="author">
<name>
<surname><![CDATA[Grau]]></surname>
<given-names><![CDATA[D.]]></given-names>
</name>
</person-group>
<article-title xml:lang="en"><![CDATA[Process yield, process centering and capability indices for one-sided tolerance processes]]></article-title>
<source><![CDATA[Quality Technology & Quantitative Management]]></source>
<year>2012</year>
<numero>9</numero>
<issue>9</issue>
<page-range>153-170</page-range></nlm-citation>
</ref>
<ref id="B17">
<label>17</label><nlm-citation citation-type="book">
<person-group person-group-type="author">
<name>
<surname><![CDATA[Heavlin]]></surname>
<given-names><![CDATA[W.D.]]></given-names>
</name>
</person-group>
<source><![CDATA[Statistical properties of capability indices.: Technical Report 320.]]></source>
<year>1988</year>
<publisher-loc><![CDATA[Sunnyvale^eCA CA]]></publisher-loc>
<publisher-name><![CDATA[Technical Library, Advanced Micro Devices, Inc.]]></publisher-name>
</nlm-citation>
</ref>
<ref id="B18">
<label>18</label><nlm-citation citation-type="journal">
<person-group person-group-type="author">
<name>
<surname><![CDATA[Borges]]></surname>
<given-names><![CDATA[W.]]></given-names>
</name>
<name>
<surname><![CDATA[Ho]]></surname>
<given-names><![CDATA[L.L.]]></given-names>
</name>
</person-group>
<article-title xml:lang="en"><![CDATA[A fraction defective based capability index.]]></article-title>
<source><![CDATA[Quality and Reliability Engineering International]]></source>
<year>2001</year>
<numero>17</numero>
<issue>17</issue>
<page-range>447-458</page-range></nlm-citation>
</ref>
<ref id="B19">
<label>19</label><nlm-citation citation-type="book">
<person-group person-group-type="author">
<name>
<surname><![CDATA[Huber]]></surname>
<given-names><![CDATA[P.]]></given-names>
</name>
</person-group>
<source><![CDATA[Robust Statistics]]></source>
<year>1981</year>
<publisher-loc><![CDATA[New York ]]></publisher-loc>
<publisher-name><![CDATA[John Wiley & Sons]]></publisher-name>
</nlm-citation>
</ref>
<ref id="B20">
<label>20</label><nlm-citation citation-type="journal">
<person-group person-group-type="author">
<name>
<surname><![CDATA[Abu-Shawiesh]]></surname>
<given-names><![CDATA[M.O.]]></given-names>
</name>
<name>
<surname><![CDATA[Abdullah]]></surname>
<given-names><![CDATA[M.B.]]></given-names>
</name>
</person-group>
<article-title xml:lang="en"><![CDATA[New robust statistical process control chart for location]]></article-title>
<source><![CDATA[Quality Engineering]]></source>
<year>1999</year>
<numero>12</numero>
<issue>12</issue>
<page-range>149-159</page-range></nlm-citation>
</ref>
<ref id="B21">
<label>21</label><nlm-citation citation-type="journal">
<person-group person-group-type="author">
<name>
<surname><![CDATA[Grznar]]></surname>
<given-names><![CDATA[J.]]></given-names>
</name>
<name>
<surname><![CDATA[Booth]]></surname>
<given-names><![CDATA[D.E.]]></given-names>
</name>
</person-group>
<article-title xml:lang="en"><![CDATA[A robust smoothing approach to statistical process control.]]></article-title>
<source><![CDATA[Journal of Chemical Information and Computer Sciences]]></source>
<year>1997</year>
<numero>37</numero>
<issue>37</issue>
<page-range>241-248</page-range></nlm-citation>
</ref>
<ref id="B22">
<label>22</label><nlm-citation citation-type="journal">
<person-group person-group-type="author">
<name>
<surname><![CDATA[Kocherlakota]]></surname>
<given-names><![CDATA[S.]]></given-names>
</name>
<name>
<surname><![CDATA[Kocherlakota]]></surname>
<given-names><![CDATA[K.]]></given-names>
</name>
</person-group>
<article-title xml:lang="en"><![CDATA[Confidence intervals for the process capability ratio based on robust estimators.]]></article-title>
<source><![CDATA[Communications in Statistics - Theory and Methods]]></source>
<year>1994</year>
<numero>23</numero>
<issue>23</issue>
<page-range>257-276</page-range></nlm-citation>
</ref>
<ref id="B23">
<label>23</label><nlm-citation citation-type="journal">
<person-group person-group-type="author">
<name>
<surname><![CDATA[Prasad]]></surname>
<given-names><![CDATA[S.]]></given-names>
</name>
<name>
<surname><![CDATA[Bramorski]]></surname>
<given-names><![CDATA[T.]]></given-names>
</name>
</person-group>
<article-title xml:lang="en"><![CDATA[Robust process capability indices.]]></article-title>
<source><![CDATA[International Journal of Management Science]]></source>
<year>1998</year>
<numero>26</numero>
<issue>26</issue>
<page-range>425-435</page-range></nlm-citation>
</ref>
<ref id="B24">
<label>24</label><nlm-citation citation-type="journal">
<person-group person-group-type="author">
<name>
<surname><![CDATA[Yeh]]></surname>
<given-names><![CDATA[A.B.]]></given-names>
</name>
<name>
<surname><![CDATA[Bhattacharya]]></surname>
<given-names><![CDATA[S.]]></given-names>
</name>
</person-group>
<article-title xml:lang="en"><![CDATA[A robust process capability index.]]></article-title>
<source><![CDATA[Communications in Statistics - Simulation and Computation]]></source>
<year>1998</year>
<numero>27</numero>
<issue>27</issue>
<page-range>565-589</page-range></nlm-citation>
</ref>
<ref id="B25">
<label>25</label><nlm-citation citation-type="journal">
<person-group person-group-type="author">
<name>
<surname><![CDATA[Kane]]></surname>
<given-names><![CDATA[V.E.]]></given-names>
</name>
</person-group>
<article-title xml:lang="en"><![CDATA[Process capability indices.]]></article-title>
<source><![CDATA[Journal of Quality Technology]]></source>
<year>1986</year>
<numero>18</numero>
<issue>18</issue>
<page-range>41-52</page-range></nlm-citation>
</ref>
<ref id="B26">
<label>26</label><nlm-citation citation-type="book">
<person-group person-group-type="author">
<name>
<surname><![CDATA[Montgomery]]></surname>
<given-names><![CDATA[D.C.]]></given-names>
</name>
</person-group>
<source><![CDATA[Introduction to Statistical Quality Control]]></source>
<year>2009</year>
<edition>6th</edition>
<publisher-loc><![CDATA[New York ]]></publisher-loc>
<publisher-name><![CDATA[John Wiley & Sons]]></publisher-name>
</nlm-citation>
</ref>
<ref id="B27">
<label>27</label><nlm-citation citation-type="journal">
<person-group person-group-type="author">
<name>
<surname><![CDATA[Lin]]></surname>
<given-names><![CDATA[P.C.]]></given-names>
</name>
<name>
<surname><![CDATA[Pearn]]></surname>
<given-names><![CDATA[W. L.]]></given-names>
</name>
</person-group>
<article-title xml:lang="en"><![CDATA[Testing process capability for one-sided specification limit with application to the voltage level translator]]></article-title>
<source><![CDATA[Microelectronics Reliability]]></source>
<year>2002</year>
<numero>42</numero>
<issue>42</issue>
<page-range>1975-1983</page-range></nlm-citation>
</ref>
<ref id="B28">
<label>28</label><nlm-citation citation-type="journal">
<person-group person-group-type="author">
<name>
<surname><![CDATA[Shu]]></surname>
<given-names><![CDATA[M.H.]]></given-names>
</name>
<name>
<surname><![CDATA[Lu]]></surname>
<given-names><![CDATA[K.H.]]></given-names>
</name>
<name>
<surname><![CDATA[Hsu]]></surname>
<given-names><![CDATA[B.M.]]></given-names>
</name>
<name>
<surname><![CDATA[Lou]]></surname>
<given-names><![CDATA[K.R.]]></given-names>
</name>
</person-group>
<article-title xml:lang="en"><![CDATA[Testing quality assurance using process capability indices CPU and CPL based on several groups of samples with unequal sizes.]]></article-title>
<source><![CDATA[Information and Management Sciences]]></source>
<year>2006</year>
<numero>17</numero>
<issue>17</issue>
<page-range>47-65</page-range></nlm-citation>
</ref>
<ref id="B29">
<label>29</label><nlm-citation citation-type="journal">
<person-group person-group-type="author">
<name>
<surname><![CDATA[Mathew]]></surname>
<given-names><![CDATA[T.]]></given-names>
</name>
<name>
<surname><![CDATA[Sebastian]]></surname>
<given-names><![CDATA[G.]]></given-names>
</name>
<name>
<surname><![CDATA[Kurian]]></surname>
<given-names><![CDATA[K.M.]]></given-names>
</name>
</person-group>
<article-title xml:lang="en"><![CDATA[Generalized confidence intervals for process capability indices.]]></article-title>
<source><![CDATA[Quality and Reliability Engineering International]]></source>
<year>2007</year>
<numero>23</numero>
<issue>23</issue>
<page-range>471-481</page-range></nlm-citation>
</ref>
<ref id="B30">
<label>30</label><nlm-citation citation-type="journal">
<person-group person-group-type="author">
<name>
<surname><![CDATA[Albing]]></surname>
<given-names><![CDATA[M.]]></given-names>
</name>
</person-group>
<article-title xml:lang="en"><![CDATA[Process capability indices for Weibull distributions and upper specification limits.]]></article-title>
<source><![CDATA[Quality and Reliability Engineering International]]></source>
<year>2009</year>
<numero>25</numero>
<issue>25</issue>
<page-range>317-334</page-range></nlm-citation>
</ref>
<ref id="B31">
<label>31</label><nlm-citation citation-type="journal">
<person-group person-group-type="author">
<name>
<surname><![CDATA[Hall]]></surname>
<given-names><![CDATA[P.]]></given-names>
</name>
<name>
<surname><![CDATA[Wilson]]></surname>
<given-names><![CDATA[S.R.]]></given-names>
</name>
</person-group>
<article-title xml:lang="en"><![CDATA[Two guidelines for bootstrap hypothesis testing.]]></article-title>
<source><![CDATA[Biometrics]]></source>
<year>1991</year>
<numero>47</numero>
<issue>47</issue>
<page-range>757-762</page-range></nlm-citation>
</ref>
<ref id="B32">
<label>32</label><nlm-citation citation-type="journal">
<person-group person-group-type="author">
<name>
<surname><![CDATA[Becher]]></surname>
<given-names><![CDATA[H.]]></given-names>
</name>
<name>
<surname><![CDATA[Hall.]]></surname>
<given-names><![CDATA[P.]]></given-names>
</name>
<name>
<surname><![CDATA[Wilson]]></surname>
<given-names><![CDATA[S.R.]]></given-names>
</name>
</person-group>
<article-title xml:lang="en"><![CDATA[Bootstrap hypothesis testing procedures]]></article-title>
<source><![CDATA[Biometrics]]></source>
<year>1993</year>
<numero>49</numero>
<issue>49</issue>
<page-range>1268-1272</page-range></nlm-citation>
</ref>
<ref id="B33">
<label>33</label><nlm-citation citation-type="book">
<person-group person-group-type="author">
<name>
<surname><![CDATA[Hall]]></surname>
<given-names><![CDATA[P.]]></given-names>
</name>
</person-group>
<source><![CDATA[The Bootstrap and Edgeworth Expansion]]></source>
<year>1992</year>
<publisher-loc><![CDATA[NewYork ]]></publisher-loc>
<publisher-name><![CDATA[Springer]]></publisher-name>
</nlm-citation>
</ref>
<ref id="B34">
<label>34</label><nlm-citation citation-type="journal">
<person-group person-group-type="author">
<name>
<surname><![CDATA[Franklin]]></surname>
<given-names><![CDATA[L.A.]]></given-names>
</name>
<name>
<surname><![CDATA[Wasserman]]></surname>
<given-names><![CDATA[G.]]></given-names>
</name>
</person-group>
<article-title xml:lang="en"><![CDATA[Bootstrap confidence intervals of Cpk: An introduction]]></article-title>
<source><![CDATA[Communications in Statistics - Simulation and Computation]]></source>
<year>1991</year>
<numero>20</numero>
<issue>20</issue>
<page-range>231-242</page-range></nlm-citation>
</ref>
<ref id="B35">
<label>35</label><nlm-citation citation-type="journal">
<person-group person-group-type="author">
<name>
<surname><![CDATA[Franklin]]></surname>
<given-names><![CDATA[LA.]]></given-names>
</name>
<name>
<surname><![CDATA[Wasserman]]></surname>
<given-names><![CDATA[G.]]></given-names>
</name>
</person-group>
<article-title xml:lang="en"><![CDATA[Bootstrap lower confidence limits for process capability indices]]></article-title>
<source><![CDATA[Journal of Quality Technology]]></source>
<year>1992</year>
<numero>24</numero>
<issue>24</issue>
<page-range>196-210</page-range></nlm-citation>
</ref>
<ref id="B36">
<label>36</label><nlm-citation citation-type="journal">
<person-group person-group-type="author">
<name>
<surname><![CDATA[Choi]]></surname>
<given-names><![CDATA[K.C.]]></given-names>
</name>
<name>
<surname><![CDATA[Nam]]></surname>
<given-names><![CDATA[K.H.]]></given-names>
</name>
<name>
<surname><![CDATA[Park]]></surname>
<given-names><![CDATA[D.H.]]></given-names>
</name>
</person-group>
<article-title xml:lang="en"><![CDATA[Estimation of capability index based on bootstrap method.]]></article-title>
<source><![CDATA[Microelectronic Reliability]]></source>
<year>1996</year>
<numero>36</numero>
<issue>36</issue>
<page-range>1141-1153</page-range></nlm-citation>
</ref>
<ref id="B37">
<label>37</label><nlm-citation citation-type="journal">
<person-group person-group-type="author">
<name>
<surname><![CDATA[Tong]]></surname>
<given-names><![CDATA[L.I.]]></given-names>
</name>
<name>
<surname><![CDATA[Chen]]></surname>
<given-names><![CDATA[J.P.]]></given-names>
</name>
</person-group>
<article-title xml:lang="en"><![CDATA[Lower confidence limits of process capability indices for nonnormal process distributions.]]></article-title>
<source><![CDATA[International Journal of Quality Reliability Management]]></source>
<year>1998</year>
<numero>15</numero>
<issue>15</issue>
<page-range>907-919</page-range></nlm-citation>
</ref>
<ref id="B38">
<label>38</label><nlm-citation citation-type="journal">
<person-group person-group-type="author">
<name>
<surname><![CDATA[Balamurali]]></surname>
<given-names><![CDATA[S.]]></given-names>
</name>
<name>
<surname><![CDATA[Kalyanasundaram]]></surname>
<given-names><![CDATA[M.]]></given-names>
</name>
</person-group>
<article-title xml:lang="en"><![CDATA[Bootstrap lower confidence limits for the process capability indices Cp, Cpk, and Cpm.]]></article-title>
<source><![CDATA[International Journal of Quality & Reliability Management]]></source>
<year>2002</year>
<numero>19</numero>
<issue>19</issue>
<page-range>1088-1097</page-range></nlm-citation>
</ref>
<ref id="B39">
<label>39</label><nlm-citation citation-type="journal">
<person-group person-group-type="author">
<name>
<surname><![CDATA[Wang]]></surname>
<given-names><![CDATA[D.S.]]></given-names>
</name>
<name>
<surname><![CDATA[Koo]]></surname>
<given-names><![CDATA[T.Y.]]></given-names>
</name>
<name>
<surname><![CDATA[Chou]]></surname>
<given-names><![CDATA[C.Y.]]></given-names>
</name>
</person-group>
<article-title xml:lang="en"><![CDATA[On the bootstrap confidence intervals of the capability index Cpk for multiple process streams.]]></article-title>
<source><![CDATA[International Journal for Computer-Aided Engineering and Software]]></source>
<year>2007</year>
<numero>24</numero>
<issue>24</issue>
<page-range>473-485</page-range></nlm-citation>
</ref>
<ref id="B40">
<label>40</label><nlm-citation citation-type="book">
<person-group person-group-type="author">
<name>
<surname><![CDATA[Efron]]></surname>
<given-names><![CDATA[B.]]></given-names>
</name>
</person-group>
<source><![CDATA[The Jackknife, the Bootstrap and other Resampling Plans.]]></source>
<year>1982</year>
<publisher-loc><![CDATA[Pennsylvania ]]></publisher-loc>
<publisher-name><![CDATA[Society for Industrial and Applied Mathematics]]></publisher-name>
</nlm-citation>
</ref>
<ref id="B41">
<label>41</label><nlm-citation citation-type="journal">
<person-group person-group-type="author">
<name>
<surname><![CDATA[Efron]]></surname>
<given-names><![CDATA[B.]]></given-names>
</name>
<name>
<surname><![CDATA[Tibshirani]]></surname>
<given-names><![CDATA[R.J.]]></given-names>
</name>
</person-group>
<article-title xml:lang="en"><![CDATA[Bootstrap methods for standard errors, confidence intervals, and other measures of statistical accuracy]]></article-title>
<source><![CDATA[Statistical Science]]></source>
<year>1986</year>
<numero>1</numero>
<issue>1</issue>
<page-range>54-77</page-range></nlm-citation>
</ref>
<ref id="B42">
<label>42</label><nlm-citation citation-type="journal">
<person-group person-group-type="author">
<name>
<surname><![CDATA[Torres]]></surname>
<given-names><![CDATA[L.M.]]></given-names>
</name>
<name>
<surname><![CDATA[Castellanos]]></surname>
<given-names><![CDATA[Ó.F.]]></given-names>
</name>
<name>
<surname><![CDATA[Fúquene]]></surname>
<given-names><![CDATA[A.M.]]></given-names>
</name>
</person-group>
<article-title xml:lang="en"><![CDATA[Evaluating Colombian SMEs technological innovation: Part 1: Conceptual basis, evaluation methodology and characterisation of innovative companies]]></article-title>
<source><![CDATA[Ingeniería e Investigación]]></source>
<year>2007</year>
<volume>27</volume>
<numero>1</numero>
<issue>1</issue>
<page-range>158-167</page-range></nlm-citation>
</ref>
<ref id="B43">
<label>43</label><nlm-citation citation-type="journal">
<person-group person-group-type="author">
<name>
<surname><![CDATA[Jiménez]]></surname>
<given-names><![CDATA[C.]]></given-names>
</name>
<name>
<surname><![CDATA[Cristancho]]></surname>
<given-names><![CDATA[A.]]></given-names>
</name>
<name>
<surname><![CDATA[Castellanos]]></surname>
<given-names><![CDATA[O.]]></given-names>
</name>
</person-group>
<article-title xml:lang="en"><![CDATA[The role of capability in technology valuation.]]></article-title>
<source><![CDATA[Ingeniería e Investigación]]></source>
<year>2011</year>
<volume>31</volume>
<numero>2</numero>
<issue>2</issue>
<page-range>112-123</page-range></nlm-citation>
</ref>
<ref id="B44">
<label>44</label><nlm-citation citation-type="journal">
<person-group person-group-type="author">
<name>
<surname><![CDATA[Cortés]]></surname>
<given-names><![CDATA[H.]]></given-names>
</name>
<name>
<surname><![CDATA[Gallego]]></surname>
<given-names><![CDATA[L.]]></given-names>
</name>
<name>
<surname><![CDATA[Rodríguez]]></surname>
<given-names><![CDATA[G.]]></given-names>
</name>
</person-group>
<article-title xml:lang="en"><![CDATA[The engineering faculty today: An approach towards consolidating academic indicators.]]></article-title>
<source><![CDATA[Ingeniería e Investigación]]></source>
<year>2011</year>
<numero>31</numero>
<issue>31</issue>
<page-range>74-90</page-range></nlm-citation>
</ref>
<ref id="B45">
<label>45</label><nlm-citation citation-type="journal">
<person-group person-group-type="author">
<name>
<surname><![CDATA[Zaragoza-Fernández]]></surname>
<given-names><![CDATA[S.]]></given-names>
</name>
<name>
<surname><![CDATA[Tarrío-Saavedra]]></surname>
<given-names><![CDATA[J.]]></given-names>
</name>
<name>
<surname><![CDATA[Naya]]></surname>
<given-names><![CDATA[S.]]></given-names>
</name>
<name>
<surname><![CDATA[López-Beceiro]]></surname>
<given-names><![CDATA[J.]]></given-names>
</name>
<name>
<surname><![CDATA[Álvarez-García]]></surname>
<given-names><![CDATA[A.]]></given-names>
</name>
</person-group>
<article-title xml:lang="en"><![CDATA[Impact estimates of the actions for the rehabilitation of energy efficiency in residential building]]></article-title>
<source><![CDATA[DYNA]]></source>
<year>2014</year>
<volume>81</volume>
<numero>186</numero>
<issue>186</issue>
<page-range>200-207</page-range></nlm-citation>
</ref>
<ref id="B46">
<label>46</label><nlm-citation citation-type="journal">
<person-group person-group-type="author">
<name>
<surname><![CDATA[Castrillón]]></surname>
<given-names><![CDATA[R.D.P.]]></given-names>
</name>
<name>
<surname><![CDATA[González]]></surname>
<given-names><![CDATA[A.J.]]></given-names>
</name>
<name>
<surname><![CDATA[Ciro-Quispe]]></surname>
<given-names><![CDATA[E.]]></given-names>
</name>
</person-group>
<article-title xml:lang="en"><![CDATA[Energy efficiency improvement in the cement industry by wet process through integral energy management system implementation.]]></article-title>
<source><![CDATA[DYNA]]></source>
<year>2013</year>
<volume>80</volume>
<numero>177</numero>
<issue>177</issue>
<page-range>115-123</page-range></nlm-citation>
</ref>
</ref-list>
</back>
</article>