ORIGINAL ARTICLES
Genetic parameters and breeding values for live weight using random regression models in a Bos taurus-Bos indicus multibreed cattle population in Colombia¤
Parámetros y valores genéticos para peso vivo empleando modelos de regresión aleatoria en una población bovina multirracial Bos taurus-Bos indicus en Colombia
Parâmetros genéticos e valores genéticos para peso vivo utilizando modelos de regressão aleatória em uma população multirracial Bos taurus – Bos índicos da Colômbia
]]> Carlos A Martínez Niño1,2*, Zoot, MSc; Mauricio A Elzo2, MV, PhD; Carlos Manrique Perdomo1, Zoot, MSc, PhD; Ariel Jiménez Rodriguez1,3, MV, MSc.
1Group of study in animal breeding and bio-modeling GEMA, Department of Animal Sciences, National University of Colombia, Bogotá, Colombia.
2Department of Animal Sciences, University of Florida, FL 32611-0910, USA.
3Colombian Association of Zebu Cattle Breeders ASOCEBU, Bogotá, Colombia.
* Corresponding author: Carlos A Martínez Niño. Department of Animal Sciences University of Florida, Bldg 459 Gainesville, FL 32611-0910. Phone number (352)392-7564. E-mail: carlosmn@ufl.edu
(Received: 26 august, 2011; accepted: 25 november, 2011)
Summary
]]> Objective: the objective of this research was to estimate genetic parameters and to predict breeding values for live weight in a Colombian Bos taurus-Bos indicus multibreed beef cattle population using random regression models (RRM). Methods: the population included 352 offspring from 37 sires of nine breeds mated to Gray Brahman females. The sire breeds were Gray Brahman, Red Brahman, Guzerat, Blanco Orejinegro, Romosinuano, Simmental, Braunvieh, Normand and Limousin. A longitudinal structured data set comprising 1,090 records was used. First (LP1) and second (LP2) order Legendre polynomials were used to estimate the coefficients of covariance functions. The animal model used included animal age, parity, contemporary group (herd * year * season * sex), breed group, additive genetic and heterosis as fixed effects. Random effects were the direct and maternal additive genetic, and the maternal permanent environment. Residual variances were assumed to be constant along the trajectory (HOM) or to change trough different stages of the growth trajectory (HET). Thus, four RRM (i.e: LP1HOM, LP1HET, LP2HOM, and LP2HET) were compared via Schwartz's Bayesian information and Corrected Akaike's Information criteria. Results: the best RRM model was LP2HET. This model was used to obtain direct and maternal heritabilities (Dh and Mh), correlations, and breeding values. The estimated direct additive covariance function showed that additive genetic covariances increased with age. The Dh was 0.24 at birth, decreased to 0.02 at 132 days, then increased to 0.18 at 492 d. The Mh was negligible throughout the growth period. Direct additive correlation values were moderate (0.43) to high (0.99) and tended to decrease as difference between ages increased. Maternal permanent environmental correlations (MPEC) followed a similar trend. Conclusions: these results suggest that selection for additive direct genetic effects based on weight at an early age would be effective in obtaining heavier animals at advanced growth stages under Colombia's tropical pasture conditions.Key words: beef cattle, covariance functions, heritability, heterozygosity.
Resumen
Objetivo: el objetivo de esta investigación fue estimar parámetros genéticos y predecir valores genéticos para peso vivo en una población bovina multirracial Bos taurus-Bos indicus empleando modelos de regresión aleatoria (RRM). Métodos: la población estuvo compuesta por 352 descendencias de 37 toros de nueve razas apareados con hembras Brahman gris. Las razas de los toros fueron: Brahman gris, Brahman rojo, Guzerat, Blanco Orejinegro, Romosinuano, Simmental, Braunvieh, Normando y Limousin. Se empleó una base de datos con estructura longitudinal de 1,090 registros. Para estimar los coeficientes de las funciones de covarianza se usaron Polinomios de Legendre de primero (LP1) y segundo orden (LP2). El modelo animal empleado consideró como efectos fijos la edad del animal, número de partos de la madre, grupo contemporáneo (hacienda * año * época * sexo), grupo racial genético aditivo, y heterosis. Los efectos aleatorios fueron genético aditivo directo y materno y ambiente permanente materno. Las varianzas residuales se asumieron constantes (HOM) o cambiantes a través de diferentes etapas de la trayectoria de crecimiento (HET). Así, se compararon cuatro modelos: LP1HOM, LP1HET, LP2HOM, LP2HET mediante los criterios de información Bayesiano de Schwartz y de Akaike corregido. Resultados: el mejor RRM fue LP2HET. Este modelo fue empleado para obtener heredabilidades directa (Dh) y materna (Mh), correlaciones, y valores genéticos. La función de covarianza aditiva directa estimada mostró que la covarianza aditiva directa aumentó conforme los animales crecieron. La Dh fue 0.24 al nacimiento, disminuyó a 0.02 a los 132 días y luego aumentó hasta 0.18 a los 492 días. La Mh fue despreciable a través del periodo de crecimiento. Los valores de correlación genética directa fueron moderados (0.43) a altos (0.99). Las correlaciones de ambiente permanente materno siguieron una tendencia similar. Conclusiones: estos resultados sugieren que la selección para efectos genéticos aditivos directos basada en el peso a edades tempranas sería efectiva para obtener animales más pesados en estadios de crecimiento posteriores bajo las condiciones tropicales de pastoreo en Colombia.
Palabras clave: funciones de covarianza, ganado de carne, heredabilidad, heterocigosis.
Resumo
Objetivo: o objetivo deste trabalho foi à estimação de parâmetros genéticos e a predição dos valores genéticos para peso vivo em bovinos mestiços (Bos taurus-Bos indicus) utilizando modelos de regressão aleatória (RRM). Métodos: foram analisadas 1090 informações de 352 animais, filhos de 37 touros de nove raças diferentes, acasalados com fêmeas Brahman. As raças dos touros foram Brahman, Brahman Vermelho, Guzerá, Blanco Orejinegro, Romosinuano, Simental, Braunvieh, Normanda e Limousin. Para a estimação dos coeficientes das funções de covariância foram utilizados Polinômios de Legendre de primeiro (LP1) e segundo orden (LP2). O modelo animal empregado considerou como efeitos fixos a idade do animal, o numero de partos da vaca, o grupo contemporâneo (fazenda * ano * época * sexo da cria), a genética aditiva do grupo racial e a heterose. E como efeitos aleatórios: o efeito genético aditivo e materno e o ambiente permanente materno. As variâncias residuais assumiram se constantes ao longo da trajetória (HOM) ou com mudanças através das diferentes etapas do crescimento (HET). Assim, compararam se quatro modelos: LP1HOM, LP1HET, LP2HOM, LP2HET por médio de critérios de informação Bayesiano de Schwartz e pelo critério de informação Akaike corrigido. Resultados: o melhor modelo de RRM foi LP2HET. Este modelo foi usado para obter as herdabilidade direta e materna (Dh e Mh), e as correlações genéticas e os valores genéticos. A função de covariância aditiva direta mostrou que as covariâncias genéticas aditivas aumentaram com o crescimento do animal. A Dh foi de 0,24 ao nascimento, diminuiu até 0,02 aos 132 dias e após aumento até 0,18 aos 492 dias. A Mh foi insignificante durante todo o período de crescimento. Os valores de correlação direta aditiva foram de moderados (0,43) a altos (0,99) e tenderam a diminuir quando a idade aumentou. As correlações de ambiente permanente materno seguiram uma tendência similar. Conclusões: estes resultados sugerem que a seleção para os efeitos genéticos aditivos diretos nas idades iniciais seria eficiente na obtenção de animais com maiores pesos na idade adulta sob condições tropicais na Colômbia.
Palavras chave: gado de corte, funções de covariância, herdabilidade, heterocigose.
]]> Introduction
Crossbreeding is a useful tool to improve growth traits (Williams et al., 2010), and is frequently used to obtain productive animals with some degree of adaptation to Colombia's harsh tropical environmental conditions (FEDEGAN, 2006). This country's available genetic resources involve three groups of breeds: Zebu, European, and Creole breeds. Zebu breeds represent 72% of the current Colombian cattle population, while the most numerous Zebu breed is Brahman (FEDEGAN, 2006). Using random regression models, weight measured at different ages can be modeled as a continuous variable by considering weight to be a continuous function of time (RRM; Kirkpatrick et al., 1990; Meyer and Hill, 1997). Legendre Polynomials are a family of functions that have been proposed to describe the parameters in these models (LP; Kirkpatrick, 1990). These polynomials are solutions to Legendre's differential equation and they are orthogonal. This property makes the columns of the design matrices orthogonal, which avoids the problem of having ill-conditioned matrices (Arango et al., 2004). The resulting coefficients allow studying genetic variation patterns along a growth trajectory (Kirkpatrick et al., 1990). As commonly done with the elements of a vectorial space with an internal product, the LP can be normalized (forced to have norm 1). This is the usual form in which they are implemented in RRM.
There are only a few research publications involving genetic analysis of multibreed cattle in Colombia and all these studies mainly involved adapted Creole (Bos taurus) and Zebu cattle (Elzo, 1998, 2001; Vergara, 2009). Furthermore, research involving RRM has mainly emphasized purebred cattle and synthetic breeds (Albuquerque and Meyer, 2001, 2005; Meyer, 2001; Dias et al., 2006; Riley et al., 2007) and most of these studies were developed in temperate regions (Arango et al., 2004; Bertrand et al., 2006; Sanchez et al., 2008). The objective of this research was to obtain estimates of covariance components and best linear unbiased predictions of breeding values for live weight from birth to 492 days of age in a Bos Taurus-Bos indicus multibreed beef cattle population under Colombia's tropical pasture conditions using random regression models.
Material and methods
This study was approved by the Animal Welfare and Bioethics Committee of the National University of Colombia (Approval letter number: CBEFMVZ- 012, July, 2010).
Breeds and mating system
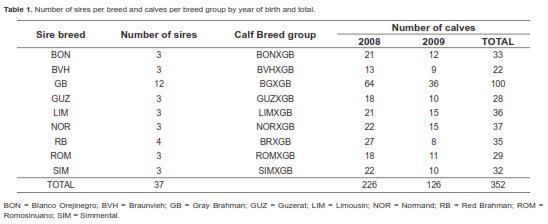
Table 1 shows the number of sires per breed and the number of calves per breed group by year and total. There were a total of 37 sires from the following breeds: Gray Brahman (GB; n = 12), Red Brahman (RB; n = 4), Guzerat (GUZ; n = 3), Romosinuano (ROM; n = 3), Blanco Orejinegro (BON; n = 3), Simmental (SIM; n = 3), Braunvieh (BVH; n = 3), Normand (NOR; n = 3) and Limousin (LIM; n = 3). This is the first multibreed study in Colombia evaluating sires from four temperate continental Bos taurus breeds (SIM, BVH, NOR, LIM), two adapted Colombian Bos taurus Creole breeds (ROM, BON), three Bos indicus breeds (GB, RB, GZ) for growth performance when mated to Bos indicus dams (GB) under tropical pasture conditions. The four continental breeds were chosen for their productivity in temperate regions (FEDEGAN, 2006) and their relatively high representation in crossbreeding with Bos indicus cattle for beef production in Colombia. The BON Creole breed is frequently used in Colombian beef crossbreeding systems. Lastly, the Guzerat breed has gained importance in Colombia during recent years, but has not been evaluated in either purebred or crossbreeding systems.
First-parity Gray Brahman cows and heifers were selected based on sound reproductive system and normal reproductive cycle. Once selected, cows and heifers were randomly mated with bulls using fixed-time artificial insemination. A total of 352 calves were born between 2008 and 2009.
]]> Animal managementAnimals were raised in two herds located in the Southern Cesar province (Colombia), an area classified as very dry tropical forest. Its mean annual temperature is 28 ºC, 80% relative humidity, 50 m height above sea level, and has sandy-loam soils. Because of these environmental conditions, Southern Cesar is considered to be better suited for beef cattle production than other regions in Colombia. Animals were kept on pasture and grazed ad libitum with a mineral supplement containing 8% phosphorus (GANASAL, Colombia). Animals grazed on Brachipará (Brachiaria plantaginea), Guinea (Panicum máximum), and Angleton (Dichantium aristatum) grasses. Fertilizer was not applied to pastures. Grazing rotated on a 60 d basis. Calves were weaned between seven and eight months of age; males were castrated at twelve months of age.
Records
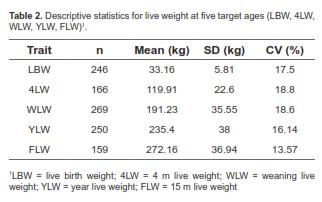
A total of 1,090 weight records were collected. Live weight (LW) measurements were taken at five age points between 1 and 492 days of age. Calves had the following mean ages at the five age points measured: 1, 120.2, 221.6, 346.7, and 447 d. Descriptive statistics for the five measured points are presented in table 2. As shown by the mean age values, measurements were taken approximately at birth (LBW), 4 (4LW), 7 (WLW), 12 (YLW), and 15 (FLW) months of age.
Data were collected at these ages because of their importance for the country's beef cattle market and/or their biological meaning. Weight at four months was taken into account because at this age calves are more dependent on their mother's milk than at weaning. This is because at this stage the calf has not finished its transition from pre-ruminant to ruminant (Van Soest, 1994). Consequently, weight measurements taken from calves at four months of age are expected to be a better indicator of maternal ability and are useful to evaluated maternal non-genetic effects. Birth weights were taken by each herd's personnel while a trained employee of the Colombian Association of Zebu Cattle Breeders (ASOCEBU) took the remaining weights.
Genetic analysis
Random regression models with normalized LP were used to obtain restricted maximum likelihood (REML) estimates of covariance components and best linear unbiased predictors (BLUP) of breeding values (BV). The following effects were considered as fixed: contemporary group (herd * year * season * sex), breed group additive effects, non-additive effects (individual heterosis), dam parity (heifer or first parity cow), and age of the animal (linear and quadratic effects). The random effects in the model were: direct additive genetic, maternal additive genetic, and maternal permanent environment. Seasons were defined as rainy or dry within the year calves were born. Thus, the first season from mid- April to mid-August 2009 was rainy, the second from mid-August to mid-December 2009 was dry, the third from mid-December 2009 to mid-April 2010 was dry, and the fourth from mid-April to mid-August 2010 was rainy. There were eight breed groups: one composed of GB x GB and RB x GB animals (BR). The other seven groups corresponded to each of the individual crosses (BON X GB, BVH X GB, GUZ X GB, LIM X GB, NOR X GB, ROM X GB, SIM X GB). Breed group effects were modeled as a continuous function of time using a linear LP. A reason to use LP to describe breed group effects in a continuous manner over time is the necessity to obtain solutions at any age (within the age range of calves) in order to compute animal BV, which in a multibreed population are calculated as the sum of individual random deviations and breed group solutions (Elzo and Wakeman, 1998). The second reason to model breed group effects using LP is orthogonality; in multibreed analyses, there are frequent multicollinearity and confounding problems (Elzo and Famula, 1985) that prevent the estimation of some additive and non-additive genetic fixed effects. Thus, by using regression on LP these problems could be partially alleviated because the block of the mixed-model equations corresponding to breed group effects will be an identity matrix.
The LP used to estimate covariance functions (CF) for direct additive genetic, maternal genetic, and maternal permanent environment effects, had order 1 (LP1) or 2 (LP2). The LP orders were defined taking into account the data set size and previous LP analyses for growth traits (Arango et al., 2004; Dias et al., 2006; Riley et al., 2007). The residual variance was modeled in two ways. The first assumed that the residual variance was constant along the growth trajectory (LP1HOM, LP2HOM), and the second one assumed that it followed a step function (LP1HET, LP2HET) (i.e. it changed across four phases of the growth trajectory). These four phases were defined when calf ages were intended to be taken. Thus, function steps were defined for the following age intervals: 1 ≤ t ≤ 120 days, 120 < t ≤ 240 days, 240 < t ≤ 360 days, and 360 < t ≤ 492 days, where t = animal's age. Residuals were assumed to be independent and normally distributed. Thus, there were a total of four models to compare: LP1HOM, LP1HET, LP2HOM, and LP2HET.
In matrix notation, the RRM was as follows:
]]>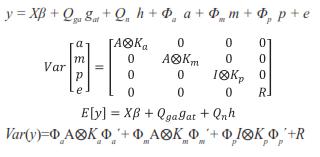
Where y = vector containing the records, β = vector with unknown fixed effects of contemporary group, dam parity and animal's age, gat= vector of fixed additive genetic group effects (assumed to be a continuous function of the time), h = vector of fixed non additive effects (individual heterosis), a = vector of random regression coefficients for additive genetic effects, m = vector with random regression coefficients for maternal genetic effects, p = vector containing random regression coefficients for maternal permanent environmental effects, and e = random vector of residuals, X, Qga, Qn, Φa, Φm, and Φp are known incidence matrices that respectively relate vectors β, gat, h, a, m, and p to the weight records. Columns in X relating records to fixed effects of age contain second order LP evaluated at each age; the columns for the other fixed effects contain zeroes and ones. Matrix Qga contained linear LP evaluated at the expected fraction of each breed in the animal times animal age (standardized to the real interval [-1, 1]). Matrix Qn contained probabilities of alleles of different breeds occurring at one locus in an animal. This probability was calculated by using the expression HI=1- (Rp*Rm)i, where n is the number of breeds, Rp and Rm are the expected fractions of each breed in sire and dam of the animal, Φa, Φm and Φp are matrices containing LP evaluated at the ages when records were taken. Ka, Km, and Kp are matrices containing the coefficients for additive genetic, maternal genetic and maternal permanent environment covariance functions. A is the additive relationship matrix,
  represents the Kronecker product, and R is the residual covariance matrix which had the form R=
 for models LP1HOM and LP2HOM and R=diag(
 ), l = 1, 2, …, 4, with sub index l denoting the lth age interval for models LP1HET and LP2HET.
The mixed model equations were:
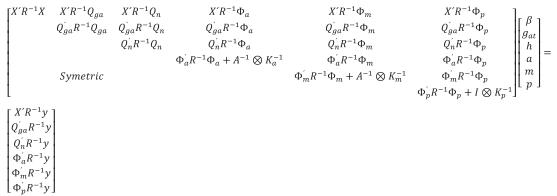
The mixed models analyses were performed with WOMBAT software (Meyer, 2007) using an average information (AI) algorithm.
Residual assessment was performed for each model to check the models' adequacy. This was done by plotting fitted values against the correspondent residuals and checking the resulting points cloud (Draper and Smith, 1981).
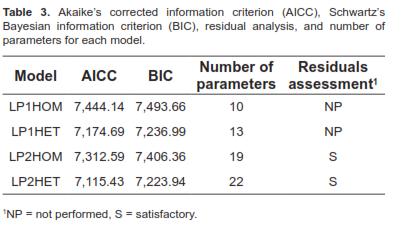
Models were compared with the Schwartz's Bayesian Information Criterion (BIC) and the Corrected Akaike's Information Criterion (AICC).
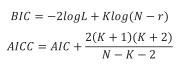
Where AIC is the Akaike's Information Criterion, K is the number of parameters, N is the number of records, logL is the value of the natural logarithm of the likelihood function, and r is the rank of the fixed part of the model. The AICC was preferred over the AIC because of the small data set size (Littel et al., 2006).
The eigenfunctions (EF) of a particular CF are continuous functions of real value, which represent a possible deformation in the mean growth trajectory (Kirkpatrick et al., 1990). Eigenfunctions were calculated in order to study variation patterns throughout the growth curve. Eigenfunctions have to be evaluated with the correspondent eigenvalues. The eigenvalues taken into account were those that together explained at least 80% of the respective variance component. Thus, only the eigenfunctions corresponding to the selected eigenvalues were calculated from the eigenvectors of the coefficient matrices by using the following expression: ψi (a)=  {cψi}j
  j (a*), where {cψi}j is the jth position of the ith eigenvector of the coefficient matrix and j (a*) is the jth LP evaluated at a*, the age a standardized to the real interval [-1,1] and k is the fit order.
(a*)): ψi (a)=<cψi,(a*)>. The eigenvectors of the coefficient matrices needed to compute the corresponding EF were calculated with the procedure IML of SAS (SAS, 2008).
Once the best RRM was selected, matrices of covariance components for additive direct genetic effects, additive maternal genetic effects, and maternal permanent environmental effects, as well as BV for weights at five ages of interest were obtained using the REML estimates of covariance matrices for random regression coefficients obtained at convergence (change of value of the natural logarithm of the restricted likelihood function in two consecutive iterations < 5*10-4). Matrices of covariance components for additive genetic, additive maternal, and permanent environmental maternal effects for any set of ages (in the range of 70 to 492 d) were computed using the correspondent covariance functions which were obtained as the product of a matrix containing LP evaluated at those ages (Φ), the correspondent coefficients matrix (Ka for direct additive covariance, Km for maternal additive covariance and Kp for maternal permanent environmental covariance) and the transpose of matrix Φ (Kirkpatrick et al., 1990; Meyer and Hill, 1997; Meyer, 1998)
covh=ΦKh Φ'
where covh is the covariance function for the hth covariance component (additive genetic, maternal additive genetic, or maternal permanent environment). Matrix Φ is obtained as the product of two matrices. The first is a matrix M=(mij)txk =ai *j-1, where ai * is the ith age standardized to the real interval [-1, 1], t is the number of ages considered (5 in this case), and k-1 is the order of the LP. The second matrix is Λkxk which contains the coefficients of the LP. Thus, Φ = MΛ (Kirkpatrick et al., 1990).
The age a was converted to its equivalent in the real interval [-1, 1] as follows
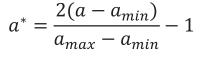
where amin is the minimum age at which records were taken and amax is the maximum.
The BV were computed for weights at 1 (LBW), 120 (4LW), 210 (WLW), 365 (YLW), and 450 (FLW) days of age. These ages were chosen because of their economic importance or their biological meaning. The additive breeding value for animal i at age t (BVit) was computed by adding two terms. The first term was a weighted sum of probabilities of alleles of breed b in animal i and the generalized least squares estimate of breed b (deviated from BR) at time t, b = 1, 2, …, 7. The second term was the BLUP of the random solution for each individual. This value was computed as the internal, or dot product, between a vector containing LP evaluated at age t and a vector whose entries were the BLUP for random regression coefficients of animal i. Thus, BVit was computed as
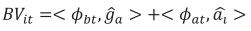
bt is a vector containing LP evaluated at the product of the fraction of breed b (b = 1, 2,…, 7) in animal i times calf age t standardized to real interval [-1, 1];  is the generalized least squares solution of the fixed coefficients for breed additive genetic effects, at is vector of LP evaluated at calf age t standardized at real interval [-1, 1], and is ai the BLUP vector of the random coefficients for animal i. Computation of BV at different ages was carried out with the IML procedure of SAS (SAS, 2008).
Results
Data showed a low coefficient of variation (CV) at each of the five points where records were collected (Table 2). The CV values ranged from 13.57% (FLW) to 18.8% (4LW). Mean values for LBW, 4LW, WLW, YLW, and FLW were 33.16, 119.91, 191.23, 235.4, and 272.16 kg, respectively.
Model selection
Models were evaluated using AICC and BIC (Table 3). Residuals assessment was conducted only if convergence was achieved and classified as satisfactory (S) or non-satisfactory (NS). Models LP1HOM and LP1HET failed to converge after several restarts. Thus, for models LP1HOM and LP1HET, the AICC and BIC values presented in table 3 are those obtained at last iteration. Residual evaluation was not performed (NP) for these models due to lack of convergence. Models LP2HET and LP2HOM showed a satisfactory residual assessment (Table 3) because plots of predicted values against residuals did not show abnormal behavior, that is, the points cloud formed a horizontal band (Draper and Smith, 1981). Model LP2HET had smaller AICC and BIC values than model LP2HOM, thus, it was considered to be the best one (Littell et al., 2006). Consequently, model LP2HET was used to estimate covariance components, genetic parameters, and to predict BV.
REML estimates of covariance functions and covariance components
Direct additive genetic (DAGC), maternal additive genetic (MAGC), and maternal permanent environment (MPEC) covariances between any pair of ages a1 and a2 satisfying 1≤a1, a2 ≤ 492 were described by the following CF (DAGCF, MAGCF, and MPECF, respectively) obtained with model LP2HET
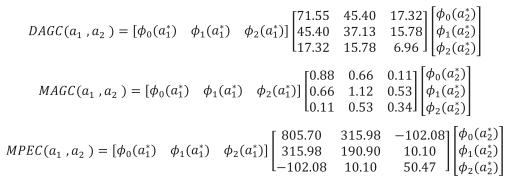
 is the ith age standardized in the real interval [-1, 1] and j () is the jth LP evaluated at ith age. Thus, the domain of these functions was D
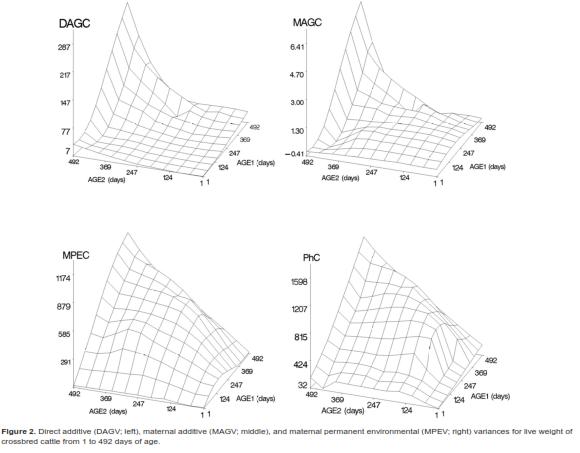
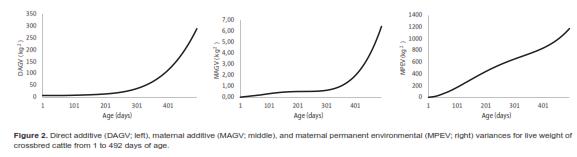
  =[1,492] x [1,492], i.e., the Cartesian product of the age range by itself. Plots of the covariance functions are shown in figure 1. The DAGC increased with age, having a marked increase towards the end of the age range studied. The MAGC followed the same pattern. The MPEC also tended to increase with age but it had a different rate of change. The MPECF changed faster at the beginning of the growth trajectory and more slowly at older ages than the DAGCF and the MAGCF (Figure 1). Because the variance function is a special case of the covariance function (i.e. when age 1 and age 2 are equal), the form of the CF around the diagonal will define the concavity of the variance function [VF]. The plots of the direct additive genetic variances (DAGV) showed that this function was concave-up (Figure 2).
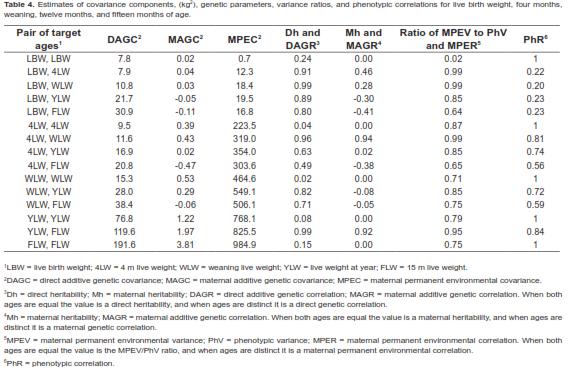
 As shown in table 4, for the five target age points considered, the DAGV ranged from 7.8 kg2 for LBW to 191.6 kg2 for FLW and no DAGC was negative. Although the MAGC also increased with the age of the calf, their values were very small compared with the other variance components (Figure 1). Further, the magnitude of the MAGC was considerably smaller than that of DAGC at all ages, and was negative for four age pairs: LBW-YLW, LBW-FLW, 4LW-FLW, and WLWFLW. Considering the complete range of ages, the maximum value of DAGV was 287.9 kg2 at 492 d. Estimates of MPEC were larger than all values for MAGC and DAGC from 4LW to FLW. Across the entire trajectory, this covariance component had its lowest value at day 1 (0.7 kg2) and the largest at 492 d (1,173.5 kg2). Graphics of these three variance components are presented in figure 2. Estimates of residual variances (RV, kg2) were as follows
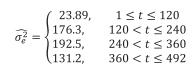
where t is the animal's age.
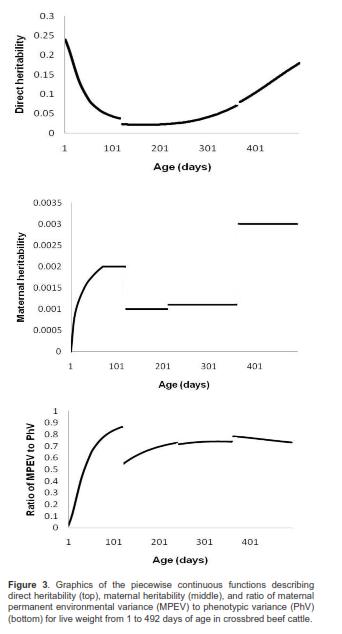
Estimates of RV increased with age until 365 d (in a stepwise manner) and then decreased. Notice that because  is a continuous piecewise function of time, so is the phenotypic covariance function, as are the ratios of additive direct genetic, additive maternal genetic, and permanent environment maternal variances to phenotypic variances. Direct and maternal heritabilities as well as ratios of permanent environment maternal to phenotypic variances are shown in figure 3.
Heritabilities
Direct heritability (Dh) estimates were moderate at the beginning of the trajectory (0.24), reached its minimum value (0.02) at 132 d and then increased to 0.18 at 492 days of age (Figure 3). Thus, Dh values were low to moderate throughout the sector of the growth curve considered here (i.e. 1 to 492 days of age). For the five target ages (Table 4), direct heritability values ranged from 0.02 (WLW) to 0.24 (LBW). In particular, additive genetic effects had a very small effect on LW at weaning. It should also be mentioned that maternal heritabilities were very low, ranging from 0.0002 for LBW to 0.003 at 492 d. Except for the first sub-domain, these were quasi-constant in each of the remaining subdomains of the function (Figure 3).
]]>
Ratio of MPEV to phenotypic variance
The ratio of maternal permanent environmental variance (MPEV) to phenotypic variance (PhV) varied from 0.02 at birth to 0.87 at 120 d, where the piecewise function had a global maximum. The MPEV to PhV ratios sharply increased from birth to 120 d (highest first derivatives values), then they fell because of higher PhV values due to higher values of RV (first skip of this function) and DAGV. Then, they increased again until 240 days of age, remained without great changes between 241 and 365 d of age, and tended to decrease smoothly until 492 days of age (last skip in the RV continuous piecewise function (Figure 3)). This indicates that maternal environmental effects were not important for birth weight, but afterwards their impact on calf weight increased quickly and had a substantial effect on LW throughout the remaining growth phases until 492 days of age.
Correlations
The direct additive genetic correlations (DAGR) for the five selected target ages are shown in table 4. Estimates of DAGR were close to unity only for very close ages. DAGR between LBW and the other ages were all high and positive. They tended to increase until weaning and then they decreased as age increased. The lowest value was 0.76 at 492 days of age. Considering the entire domain of the function, correlations tended to decrease as distance between ages increased. All DAGR correlations ranged from medium to high. The minimum value was 0.43 for the DAGR between 106 and 492 d.
Maternal additive genetic correlations (MAGR) between LBW and the other target ages tended to decrease with distance between ages in such manner that it was negative towards the superior extreme of age range (Table 4). Estimates of MAGR were negative for the following age pairs: LBW-YLW, LBW-FLW, 4LW-FLW, WLW-YLW, and WLWFLW. In general, MAGR absolute value ranged from low to high. But given the extremely low values of additive maternal variances and covariances, especially at birth, these correlations are insignificant.
Maternal permanent environmental correlations (MPER) were positive with moderate to high values throughout the entire function domain. They reached their lowest value (0.45) approximately at 492 and 70 d. For the target ages the MPER estimates ranged from 0.64 (LBW-FLW) to 0.99 (LBW-4LW; LBW-WLW).
Phenotypic correlations (PhR) varied from 0.20 for LBW and WLW to 0.84 for YLW and FLW (Table 4). There were no negative PhR throughout the entire domain. In general, PhR tended to decrease with distance between age points.
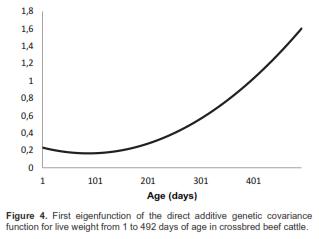
Eigenfunctions
For the DAGCF, the first eigenvalue (108.23) accounted for 93.59% of total DAGV. Thus, for DAGCF only the first EF (DAEF1) was computed. The first eigenvector was: (0.7982 0.5594 0.2237)', and the DAEF1 was
]]> DAEF1 = 0.3876 + 0.6851a* + 0.53058a*2The graphic of this function is presented in figure 4. The DAEF1 was an increasing, positive function. It was expected to be so because there was no negative DAGR in the studied age ranges.
Breeding values
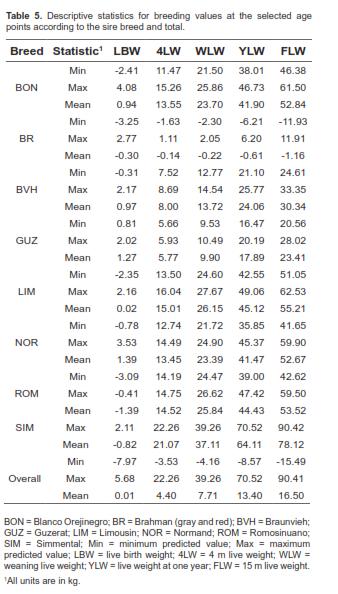
Descriptive statistics for BLUP of BV discriminated for sire breed are presented in table 5. Thus, values showed in table 5 for each sire breed were constructed only with BV of sires, while the overall values were constructed with information from all animals. Overall mean BV were 0.01 kg for WLW, 4.40 kg for 4LW, 7.71 kg for WLW, 13.40 kg for YLW, and 16.50 kg for FLW. According to these results, except for BV at birth, the largest mean BV was for the SIM sires.
Discussion
Model selection
The need for various restarts in order to achieve convergence had been reported for RRM using LP (Arango et al., 2004). Convergence problems when some eigenvalues of the estimated covariance matrix are near to zero were also found by Boligon et al. (2010). This problem was also reported by Meyer (1999). As an alternative to LP, RRM using linear splines have been proposed and its usefulness has been proven with filed data (Bertrand et al., 2006) and simulated data sets (Bohmanova et al., 2005), thus, they are an alternative for future analysis in Colombia. A best fit of RRM with a heterogeneous residual variance structure has been reported in a buffalo population in Colombia (Bolivar et al., 2011) as well as a multibreed beef cattle population (Arango et al., 2004), and a Nellore cow population in Brazil (Boligon et al., 2010). Many other works reported a better approach to model growth by using non-constant temporary environmental variances (Albuquerque and Meyer, 2001; Meyer, 2004; Albuquerque and Meyer, 2005; Sanchez et al., 2008). Meyer (2000) suggested that seasonal variations could be responsible for the heterogeneity in the measurement error.
]]> In the present study, the subdomains of the measurement error variance were defined in order to account for possible effects caused by environmental events. For example, stress caused by weaning at 210 d or castration of yearling males could lead to a change in the level of animal response to these additional environmental factors. Thus, different levels of animal responses to environmental factors over time may help explain the better fit of the HET residual variance structure in this multibreed population. Here, all covariance components between ages were described by a second degree LP. Similar results were reported by Dias et al. (2006). They used a second order LP for MAGC. For MPEC they found that the best model had order 1 and for DAGC order 3. Various papers reported cubic polynomials to be sufficient in describing the growth trajectory (Meyer, 1999; Dias et al., 2006; Nobre et al., 2003). Albuquerque and Meyer (2001) used LP of orders 3 to 6 to describe growth trajectories of Nellore cattle in tropical pasture conditions from birth to 630 days of age. In their study, according to the BIC, they chose cubic LP to estimate DAGC and MAGC. Arango et al. (2004) found that a linear LP described the DAGC well, while a 4 order LP described direct permanent environmental covariances. They worked with growth data of cows aged 19 to 103 months. In these studies, either the age range was greater than the one used here or the upper limit of the age range was larger. If the age range is long, the growth curve could show a seasonal pattern as described by Meyer (2000). In such situations, polynomials of higher order should be used, because high order polynomials permit curves to be more flexible. This was likely the reason for the use of third order or higher polynomials in these studies. Some works reported fit orders as high as 22 to model growth curves in a wide age rank, which showed seasonal variation (Meyer, 2000). Results from Arango et al. (2004) more closely resembled that of the current research. The greater the LP order, the greater the number of parameters, thus, given the reduced number of records available for this study, the use of a second degree polynomial was a good option.A major advantage of RRM over multiple trait models is the substantially lower number of parameters that need to be estimated if the order of polynomials employed is low. For example, if a five-trait multiple trait model had been used here and zero covariance between direct and maternal additive effects had been assumed, the number of parameters needed would have been 4*(5*(5+1)/2) = 60, which is much larger than the 22 parameters needed for the RRM used here. Because of the small size of the data set here, a more realistic multiple trait approach would be to consider two-trait models. A total of 10 two-trait models would have had to be performed to estimate the full covariance matrix for LW at the five target age points considered here, and there would be no guarantee that the resulting covariance matrix would be definite positive.
REML estimates of covariance functions and covariance components
Although differences in the LP order cause differences in the form of DAGCF, the coefficients and domain of the CF will define the surface type. For example, maximum, minimum, or saddle points from two CF could be compared only if they cover the same range of ages. The concavity of CF in its domain is important because if the function is increasing and concave-up, the variance magnitude increments will also tend to increase, i.e. the variance will have a positive acceleration (positive second derivative). On the other hand, if the CF is concave-down but still increasing the rate at which variance increases will decrease over time. Similar patterns to those observed here for direct additive genetic variances (DAGV) were reported by Albuquerque and Meyer (2001), when fitting a 4 degree LP in a Nellore cattle population under similar environmental conditions (i.e. animals under tropical pasture conditions). Different patterns under similar environmental conditions were described by Boligon et al. (2010). They found a concave-down function describing DAGV. Although the DAGV tended to increase with age as in the present study, the rate of change tended to diminish with age. In their work, maternal additive genetic variance (MAGV) and maternal permanent environmental variance (MPEV) reached a maximum at approximately 260 days of age, which subsequently decreased.
Nobre et al. (2003) found a similar function describing DAGV in Nellore cattle for the age range from birth to 683 d, but the function showed a positive linear trend for the age range used in our study. A different trend for MPEC was reported by Nobre et al. (2003). They found that MPEV was not represented by a strictly increasing function and also reported that MAGV, as well as MPEV, increased almost until weaning and then decreased. Similar trends for these variance components were reported for Zebu breeds under pasture conditions (Meyer, 2001; Albuquerque and Meyer, 2005; Dias et al., 2006), crossbred cattle (Arango et al., 2004) and Brahman cattle in feedlot conditions (Riley et al., 2007). In general, all studies showed an increase in the value of variance components for weight with an increase in the animals' age. The values of MPEV were greater than those found by Nobre et al. (2003) for LBW and LW at 152, 233, 333, and 426 d, while MAGV and DAGV values were smaller. Another difference with that report is the fact that their MPEV decreased after weaning, whereas in this study MPEV continued to increase with age. Similar results were obtained by Dias et al. (2006). This indicates that maternal population environmental effects continued to generate MPEV after weaning and, therefore, need to be considered in models for genetic analysis of post-weaning weight traits.
Dias et al. (2006) described RV results similar to those presently found; they determined that RV decreases after 230 days of age. Different results were reported by Boligon et al. (2010) using a step function to define RV in Nellore cows, and by Meyer (2001) using a smooth function to model RV for beef calves from birth to weaning. Both studies found that RV increases throughout the age range.
Heritabilities
Meyer (2001), reported that the minimum Dh value was reached at 100 days of age, similar to Dh trends found here. However, their Dh values were higher than those reported here. For Nellore cattle and under tropical pasture environmental conditions, Nobre et al. (2003) reported lower Dh estimates for LBW, and higher Dh values starting at approximately 60 days of age. Using multiple or single trait analysis, reported Dh values for Colombian multibreed cattle populations involving one or more of the breeds presented in this paper and handled with alike criteria were similar for LBW, but greater for WLW (Elzo et al., 1998; Elzo et al., 2001, Vergara et al., 2009). The low Dh values at four months and weaning could be due to artifacts. This kind of numerical problems have been reported for RRM using LP (Nobre et al., 2003; Bohmanova et al., 2005; Bertand et al., 2006).
Results for Mh suggested that maternal effects were negligible over the growth trajectory, especially at birth. Estimation errors for Mh ranged from 0.001 to 0.6, and in general were larger than those for Dh (0.09 to 0.2). At birth, values for Mh errors were unrealistic. Estimation and numerical problems (numerical instability, and susceptibility to artifacts) at extreme ages had been reported when using LP (Nobre et al., 2003; Meyer, 2004; Arango et al., 2004). Therefore, these results need to be taken with caution because of the use of LP, the structure (one generation), and the small size of the multibreed population used in this study. Thus, subsequent studies with several generations and larger animal samples may yield substantially different Mh estimates. Furthermore, according to Nobre et al. (2003), in order to accurately estimate maternal effects, it becomes necessary to establish connections between direct and maternal effects. Such connections are given mainly by bulls that are sires as well as maternal grandsires. Maternal grandsires were unknown in this population. This may have been another factor that negatively affected MAGC estimates.
Several studies have reported smaller values for Mh than for Dh (Meyer, 2001; Dias et al., 2006; Boligon et al., 2010), but those Mh values were not as small as those estimated in the present study. Boligon et al. (2010) reported Mh varying from 0.03 at birth to 0.09 at 240 days of age. Similar results were also reported by Albuquerque and Meyer (2001), and Dias et al. (2004) for Zebu cattle in tropical areas. In addition, higher Mh values than Dh values were reported for LBW and WLW. However, Dh estimates were higher than Mh after weaning (Nobre et al., 2003). For feedlot Brahman cattle in a subtropical region, Riley et al. (2007) suggested that direct additive effect estimates for post-weaning weights from 7 to 12 months of age could be inflated because they did not include maternal effects.
]]> Ratio of MPEV to phenotypic varianceConsidering that maternal environmental effects are determined mainly by milk production and according to the behavior of maternal permanent environmental effects that showed that they are very important at four months, these results strengthen the proposal to take records at that age. Further, the maximum value for the ratio of MPEV to PhV approximately matches the minimum Dh value. Different patterns of MPEV to PhV ratios were outlined by Albuquerque and Meyer (2001), who found that this ratio showed little change over time. Meyer (2001) found that maternal effects were more important for Polled Hereford than for the Wokalup composite breed. This breed is composed of Charolais, Brahman, Friesian, and Angus or Hereford Breeds (Meyer et al., 1993). Present results were closer to those obtained by Meyer (2001) for Wokalup. Given that Wokalup animals were generated by crossing animals from Bos taurus and Bos indicus breeds, they are expected to be more similar to animals used here than to purebred Polled Herefords. In that research, animals were also handled under pasture conditions. Thus, discrepancies with the study of Albuquerque and Meyer (2001) could be due to breed differences (they used pure Nellore animals).
Correlations
Lower DAGR between LBW and ages similar to the target ages discussed here were reported by Dias et al. (2006) in a Brazilian Nellore cattle population. Their reported values of DAGR were 0.58 for LBW and LW at 240 d, 0.50 for LBW and YLW, and 0.32 for LBW and LW at 550 d. Therefore, the multibreed population here showed stronger additive genetic relationship between LBW and LW at other ages than the Brazilian Nellore population under similar pasture conditions. There was not a plateau, thus, all DAGR did not remain near unity. This indicated that a repeatability model would not be appropriate to obtain breeding values, as discussed by Arango et al. (2004). Thus, this model could not be used for a trajectory considering LW at birth and weaning. Similar results were described for Nellore cattle under tropical pasture conditions (Albuquerque and Meyer, 2001). For Wokalup cows under pasture conditions in a Mediterranean region, a similar pattern to the one found here for MPER was described by Meyer (2001), where the lowest MPER was 0.6 (between LBW and LW at 211 days of age). However, in that study, MPER values were close to unity in almost the entire domain. Relating these high correlations with the values of the MPEV to PhV ratios, it can be inferred that maternal permanent environmental effects were very important in this population. Thus, the amount of milk provided to the calf by the cow had a large influence in pre and post-weaning weights. Meyer (2004) asserted that maternal permanent environmental effects were different for two breeds (Wokalup and Polled Hereford), indicating that they differed in the variation of calf weights due to cow milk production.
Dias et al. (2006) described similar results to those found here for PhR in Brazilian Nellore cattle. They found low to moderate PhR values between LBW and LW at 240, 365, and 550 d. They also found that PhR tended to decrease as distance between ages increased. On the other hand, Arango et al. (2004) reported that PhR values were greater than 0.60 in a beef cattle multibreed population (Hereford and Angus cows mated to bulls from 22 breeds, including four of the breeds used here: SIM, LIM, BVH, and GB) under temperate conditions. These PhR values were larger than those found in the current study, perhaps because temperate environmental conditions permitted a fuller expression of weight genotypes of crossbred calves in comparison to tropical Colombian conditions.
Eigenfunctions
The percentage of DAGV explained by the first eigenvalue was lower than the reported by Arango et al. (2004) (96%) and Boligon et al. (2010) (90.56%). In general, previous studies have shown that the largest eigenvalue explained more than 90% of DAGV. Because DAEF1 was a positive function, it indicates that selection of heavier animals at any age would lead to heavier animals at other stages of the growth trajectory. In practice, the interest is that LW at early age will lead to heavier animals at later growth phases. Given the great portion of the DAGV explained by the eigenvalue associated with the DAEF1 and the behavior of the heritability across calf ages, selection of heavier animals at a young age will have a large effect in the mean growth trajectory of the population. Similar results were obtained in Brazilian Nellore cattle (Boligon et al., 2010), and Australian beef cattle populations (Meyer and Hill, 1997; Meyer, 1998).
Breeding values
Considering the small number of sires used in this study, especially for Bos taurus breeds, results should be considered with caution. The range of values of BV for ROM sires was smaller for LBW and greater for WLW than those reported by Elzo et al. (1998) in a ROM-zebu multibreed Colombian population. Given the high percentage of BR breed in commercial Zebu cattle in Colombia, results for Zebu sires in that study are comparable to results from BR bulls found here. For those bulls the ranges were greater for LBW, but smaller for WLW, whereas for RS X GB animals ranges were greater for LBW and smaller for WLW.
The BV suggests that SIM sires would be advantageous for crossbreeding programs with Brahman cows under pasture in this region. However, Creole sires had large BV at all ages. Considering the adaptability and rusticity of these breeds (FEDEGAN, 2006) they could be desirable for commercial producers.
]]> No research that considered breed effects as a continuous function of calf age was found in the literature. However, a study involving prediction of BV using RRM was conducted by Sanchez et al. (2008) using linear splines instead of LP. This study did not discuss ranges of BV within and across breed groups.An advantage of RRM over multivariate mixed models is that BV can be obtained for any weight over the entire range of ages considered in the analysis, and for growth curve functions (Albuquerque and Meyer, 2005). Important parameters associated to growth curves are growth rate, growth acceleration, maximum growth rate, relative growth rate, and inflection points (Gompertz, 1852; Agudelo-Gomez et al., 2007; Martínez et al., 2010). Thus, BV for these parameters, if necessary, could be computed without performing a new genetic evaluation.
Final remarks
Although genetic parameters and breeding values were estimated with limited accuracy due to the structure and small size of the multibreed population, selection for growth traits may be feasible in this multibreed population. However, weight at four months and at weaning had a very low heritability and highly influenced by maternal environmental factors (milk production, primarily). Results show that under pasture conditions, permanent environment maternal effects were important, particularly at four months of age. Validation of genetic parameters estimates with larger multigenerational data sets would be needed to obtain estimates of additive genetic parameters useful for regional and national multibreed genetic evaluations and selection for weight traits under Colombian pasture conditions. Thus, efforts need to continue in order to obtain weight information at various calf ages from a representative sample of beef cattle herds where the cattle breeds used in this study are represented.
Acknowledgments
The authors acknowledge the logistic and economic support provided by the Colombian Association of Zebu Cattle Breeders ASOCEBU.
References
1. Agudelo-Gomez DA, Cerón-Muñoz MF, Restrepo LF. Modelación de funciones de crecimiento aplicadas a la producción animal. Rev Colomb Cienc Pecu 2007; 20:157-173. [ Links ]
2. Albuquerque LG, Meyer K. Estimates of covariance functions for growth from birth to 630 days of age in Nelore cattle. J Anim Sci 2001; 79: 2776-2789. [ Links ]
3. Albuquerque LG, Meyer K. Estimates of covariance functions for growth of Nelore cattle applying a parametric correlation structure to model within-animal correlations. Livest Prod Sci 2005; 93:213-222. [ Links ]
4. Arango JA, Cundiff LV,Van Vleck L. Covariance functions and random regression models for cow weight in beef cattle. J Anim Sci 2004; 82:54-67. [ Links ]
5. Bertrand JK, Misztal I, Robins KR, Bohmanova J, Tsuruta S. Implementation of random regression models for large scale evaluations for growth in beef cattle. Proceedings of the 8th World Congress on Genetic Applied to Livestock Production 2006; III: 00-03. [ Links ]
6. Bohmanova J, Misztal I, Bertrand JK. Studies on multiple trait and random regression models for genetic evaluation of beef cattle for growth. J Anim Sci 2005; 83:62-67. [ Links ]
7. Boligon AA, Mercadante MEZ, Forni S, Lobo RB, Albuquerque LG. Covariance functions for body weight from birth to maturity in Nellore cows. J Anim Sci 2010; 88:849-859. [ Links ]
8. Bolívar DM, Cerón-Muñoz MF, Elzo MA, Ramírez EJ, Agudelo DA. Growth curves for buffaloes (Bubalus bubalis) using random regression mixed models with different structures of residual variances. J Anim Sci 2011; 89: Suppl E1: 530. [ Links ]
9. Draper NR, Smith H. Applied regression analysis, 4th ed. New York (NY): John Wiley & Sons, Inc.; 1981. [ Links ]
10. Dias LT, Albuquerque LG, Tonhati H,Texeira R de A. Estimação de parâmetros genéticos para peso do nascimento aos 550 dias de idade para animais da raça Tabapuã utilizandose modelos de regressão aleatória. R Bras Zoot 2006; 35:1915- 1925. [ Links ]
11. Elzo MA, Famula TR. Multibreed sire evaluation procedures within a country. J Anim Sci 1985; 60:942-952. [ Links ]
12. Elzo MA, Manrique C, Ossa G, Acosta O. Additive and nonadditive genetic variability for growth traits in the Turipaná Romosinuano-Zebu multibreed herd. J Anim Sci 1998; 76:1539-1549. [ Links ]
13. Elzo MA, Wakeman DL. Covariance components and prediction for additive and nonadditive preweaning growth genetic effects in an Angus-Brahman multibreed herd. J Anim Sci 1998; 76:1290-1302. [ Links ]
14. Elzo MA, Martínez G, Gonzales F, Huertas H. Variabilidad y predicciones genéticas aditivas, no aditivas y totales para la producción de ganado de carne en el rebaño multirracial Sanmartinero-Cebú de La Libertad. Corpoica Cienc Tecnol Agropecu 2001; 3:51-64. [ Links ]
15. Federación Nacional de Ganaderos FEDEGAN (Colombia). Plan estratégico de la ganadería colombiana 2019. Bogotá D.C: San Martin Obregon y Cía.; 2006. [ Links ]
16. Gompertz B. On the nature of the function expressive of the law of human mortality, and on a new mode on determining the value of live contingencies. Phil Trans R Soc Lond 1825; 115:513-585. [ Links ]
17. Kirkpatrick M, Lofsvold D, Bulmer M. Analysis of the inheritance, selection and evolution of growth trajectories. Genetics 1990; 124:979-993. [ Links ]
18. Littell RC, Milliken GA, Stroup WW, Wolfinger RD, Schabenberger O. SAS® for mixed models. 2nd ed. Cary (NC): SAS Institute Inc.; 2006. [ Links ]
19. Martínez CA, Rodríguez AP, Manrique C, Jiménez A. Descripción matemática de la función Gompertz aplicada al crecimiento de animales. Rev Med Vet Zoot 2010; 57:76-80. [ Links ]
20. Meyer K, Carrick MJ, Donnelly BJ. Genetic parameters for growth traits of Australian beef cattle from a multibreed selection experiment. J Anim Sci 1993; 71:2614-2622. [ Links ]
21. Meyer K, Hill WG. Estimation of genetic and phenotypic covariance functions for longitudinal or ''repeated'' records by restricted maximum likelihood. Livest Prod Sci 1997; 47:185- 200. [ Links ]
22. Meyer K. Estimating covariance functions for longitudinal data using a random regression model. Genet Sel Evol 1998; 30:221- 240. [ Links ]
23. Meyer K. Estimates of genetic and phenotypic covariance functions for postweaning growth and mature weight of beef cows. J Anim Breed Genet 1999; 116:81-205. [ Links ]
24. Meyer K. Random regression to model phenotypic variation in monthly weights of Australian beef cattle. Livest Prod Sci 2000; 65:19-38. [ Links ]
25. Meyer K. Estimates of direct and maternal covariance functions for growth of Australian beef calves from birth to weaning. Genet Sel Evol 2001; 33:487-514. [ Links ]
26. Meyer K. Scope for a random regression model in genetic evaluation of beef cattle for growth. Livest Prod Sci 2004; 86:69-83. [ Links ]
27. Meyer K. ''WOMBAT –A program for mixed models analyses in quantitative genetics by REML''. J Zhejiang Uni SCIENCE B 2007; 8: 815-821. [ Links ]
28. Nobre PRC, Misztal I, Tsuruta S, Bertrand JK, Silva LOC, Lopes PS. Analysis of growth curves of Nellore cattle by multiple-trait and random regression models. J Anim Sci 2003; 81:918-926. [ Links ]
29. Riley DG, Coleman SW, Chase CC Jr., Olson TA, Hammond DC. Genetic parameters for body weight, hip height, and the ratio of weight to height from random regression analyses of Brahman feedlot cattle. J Anim Sci 2007; 85:42-52. [ Links ]
30. Sánchez J, Misztal I, Aguilar I, Bertrand JK. Genetic evaluation of growth in a multibreed beef cattle population using random regression-linear spline models. J Anim Sci 2008; 86:267-277. [ Links ]
31. SAS Inst. Inc. (USA). SAS/STAT User's guide: Statistics. Cary, NC: The institute; 2008. [ Links ]
32. Van Soest PJ. Nutritional ecology of the ruminant. 2nd ed. Ithaca (NY): Comstock publishing associates; 1994. [ Links ]
33. Vergara OD, Ceron-Muñoz MF, Arboleda EM, Orozco Y, Ossa GA. Direct genetic, maternal genetic, and heterozygocity effects on weaning weight in a Colombian multibreed beef cattle population. J Anim Sci 2009; 87:516-521. [ Links ]
34. Williams JL, Aguilar I, Rekaya R, Bertrand JK. Estimation of breed and heterosis effects for growth and carcass traits in cattle using published crossbreeding studies. J Anim Sci 2010; 88:460-466. [ Links ]
Notas al pie
¤ To cite this article: Martínez CA, Elzo MA, Manrique C, Jiménez A. Genetic parameters and breeding values for live weight using random regression models in a Bos taurus-Bos indicus multibreed cattle population in Colombia. Rev Colomb Cienc Pecu 2012; 25:548-565.
]]> ]]>