LOOKING FOR A ROAD TO GET OUT OF POVERTY. IS THE CURRENT ALLOCATION OF PUBLIC SPENDING ON EDUCATION IN COLOMBIA HELPING?
BLANCA CECILIA ZULUAGA DÍAZ1, ERIK SCHOKKAERT2
1Economista de la Universidad del Valle. Maestría en Economía, Universidad del Valle. Profesora de tiempo completo de la Universidad Icesi. E-mail: mbzuluzga@icesi.edu.co
2ADVISER
Fecha de recepción: 7-6-2004 Fecha de aceptación: 25-10-2004
Only what we have imagined can be constructed. We can not construct a word without poverty if we are not able to conceive such a world.
YUNUS (1998)
SUMMARY
This paper presents a methodology to explore the impact on poverty of the public spending on education. The methodology consists of two approaches: Benefit Incidence Analysis (BIA) and behavioral approach. BIA considers the cost and use of the educational service, and the distribution of the benefits among groups of income. Regarding the behavioral approach, we use a Probit model of schooling attendance, in order to determine the influence of public spending on the probability for the poor to attend the school. As a complement, a measurement of targeting errors in the allocation of public spending is included in the methodology.
]]> KEY WORDSPoverty, education, public spending.
JEL: H52, I28
Rating: A
1. INTRODUCTION
Public expenditure is one of the main instruments of the Government to reach the desirable objective of helping poor people to escape of their critical condition. Education and health care are primary services that allow people to obtain better quality of life, thus the government should have as one of its priorities the universal provision of these services, either directly or indirectly. However, in countries such as Colombia the government´s effort is not reflected in the country´s de facto level of poverty, since 60% of the population currently lives under this condition (National Department of Planning of Colombia).1 It seems like the poverty policies are effective just in keeping the poor alive, but they are not designed and/ or implemented to take the poor out of poverty.2
What is wrong with the current allocation of public spending? Are the current beneficiaries the ones who really need the public help, not being able to get the good or service by themselves? Which changes are required to obtain better results in terms of reduction of poverty? These are questions still waiting for an answer.
"Improvement of education and health outcomes is sought because of their intrinsic value in raising capabilities increase and individual freedoms. They also have an instrumental value in contributing to higher incomes, and in reinforcing each other. The main asset of the poor is their labor. Education and health are critical to preserving and enhancing the quality of this asset, and for this reason investment in health and education is especially important for the poor" [(Lanjouw et. all. (2001)].3
As it is well known, public subsidies on investment that enhance human capital - such as education and health care - benefit the poor. Resolving problems in targeting the poor implies i) reallocating public subsidies and ii) dealing with the constraints that keep the poor outside of the group of beneficiaries of the services. In this research, the analysis will be focused on education, considering this service as a high impact public tool that can help to reach superior development levels including the elimination of poverty.
The objective of this paper is to present a methodology for evaluating the impact on poverty of the public spending on education. The idea is to compile proposals of previous research and then to propose complementary methods, in order to obtain a more complete methodology. Specifically, we develop and apply to the case of Colombia two different approaches.
]]> The first approach that we consider is the behavioral approach. For this, we develop a Probit model to determine the impact of public spending on education on the probability of the poor to attend the educational system in Colombia. The model contains the variables that previous researches have found as relevant in determining shool participation, such as a group of household characteristics (schooling years of the head of the household, number of persons in the household) and individual characteristics (gender, age, whether the individual works or not). Here we include two more variables for household characteristics (highest level of education in the household and social stratification of the house) and two expenditures variables: per-capita public spending on education and percapita school restaurants public spending. This inclusion is useful to test how effective the public spending has been in positively affecting the decision of the poor to go to the school, as any public expenditure program is expected to contribute to the alleviation (or elimination) of poverty.The second approach developed in this research is the so-called "Benefit Incidence Analysis" (BIA),4 which is based on the use and cost of the service offered by the government. BIA results are useful for determining whether the public spending is progressive (it reduces inequality) or regressive and whether education public expenditure is being well used for transferring benefits to the poor. In addition to the behavioral and BIA approaches, an estimation of targeting errors is presented.5
Why is it important to study the incidence? Because it is a huge quantity of money that has been spent until now and so far the impact of this expenditure has not been sufficient to eliminate, or even to significantly decrease poverty. Effectiveness of the public spending depends on whether the policy setting of expenditure is adequate. In Colombia, for instance, this could be related with the fact that poor people can not continue the education until higher levels because most of them are forced to abandon school and look for a place in the labor market. In that way, it is not enough to only spend on education, but it is also necessary to think how to retain poor people in the educational system.
Another reason why a proper allocation of subsidies is important, is that in developing countries - Colombia included- the existing tax policy is not effective in altering the post-tax distribution of income, and the capacity for implementing programs to alter the post-transfer distribution of income is limited [(Davoodi et. all. (2003)]. This problem makes the provision of basic services such as health care and education a fundamental action to alter the situation of the worse-off people.
This paper consists of five parts. The second part is a description of the current situation of poverty, education and public spending in Colombia. The third part presents the methodology to be applied for determining the incidence of public education spending in Colombia, based on a review of the existing literature (BIA) and own contributions to the methodology (Probit model for attendance and targeting errors). In the fourth part we present the results of the analysis and estimations. Finally some conclusions and recommendations are provided.
STYLIZED FACTS
2.1. Poverty in Colombia
Poverty is a condition which inhibits a person to satisfy his basic needs and desires. To be poor means to be short of opportunities to choose in education, health, recreation, culture, among others. Economists and sociologists have developed several indicators to determine how many poor people a certain society has. Depending on the selected indicator, the number of poor people in Colombia varies significantly (when comparing, for instance, population with unsatisfied basic necessities with population under the line of poverty). "How poverty is measured - the choice of specific living standards indicator, the poverty cutoff point and the poverty index used- can influence policy assessments" [(Van de Walle (1998)].
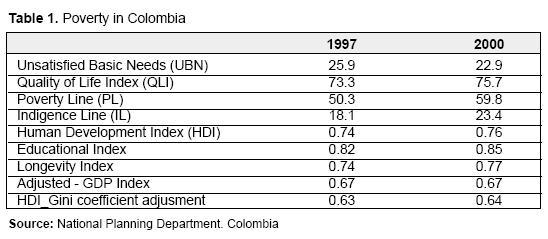
How effective are these indicators in determining the amount of poor people in a society is still an open question (Sen (2001)). This section shows the main indicators used in Colombia to measure poverty (Table 1).
]]>
The first index, UBN, consists of the following partial indicators: i) households in houses with inadequate physical conditions, ii) households in houses without utilities, iii) critical crowded households - more than three peole per room (including living room, dining room and bedrooms), iv) households with high economic dependence- more than three people per employed member, v) Households in which at least one child between 7 and 11 years does not attend a school. A household is considered poor if it has at least one of these characteristics.
According to the UBN index, a slight improvement occurred during the period. The element of the index determining this result was the higher access of households to utilities or public services. Without doubt, this is a positive factor, but is it enough to assert that poverty has decreased in Colombia?
The second indicator, Quality of Life Index - QLI, includes additional elements compared to the previous one. Unlike UBN, QLI weights every chosen element to calculate the global index. It has 12 elements grouped as follows: i) Education and human capital: Education of the head of family, education of people who are 12 or more years old, young from 12 to 18 years attending secondary school or university, children between 5 and 11 years attending school ii) Quality of the house: material of the walls, material of the floor iii) Access and quality of utilities: Water provision, what utilities households use for cooking, garbage collection, sanitary services iv) Size and composition of household: children 6 or less years old, number of people per room.
As Table 1 shows, the index had a slight improvement during the period. The element that influences this result most was the decreasing number of children younger than 6 years in the household, since the birth rate diminished in the last years. If we look slightly at this indicator it could give us the false impression that situation is better in Colombia for poor people. However, according to DNP (2000), the index improved for the highest income groups of population, and it is worse for the poorest (disaggregate information was not published in the document from DNP). Then, can we say that poverty has decreased in Colombia based on QLI? NO for sure. We can only say that conditions for richest people have improved. This is not bad, but it is surely not an achievement in the fight against poverty.
The third and fourth indexes are also highly used to count how many poor people live in Colombia. To calculate the indicators, a food basket based on minimum nutritional requirements is considered. The cost of the food basket represents the indigence line (IL). Then, the cost of a normative basket is estimated assuming that the lack of food is proportional to the lack of other basic goods and services. This normative basket includes not only food but also basic goods and services identified through the known household´s expenditure structure. The cost of the normative basket represents the minimum budget to cover basic needs and constitutes the poverty line (PL).6
Table 1 shows that both IL and PL exhibit a significant worsening in the analyzed period. The main reasons of the decline of the income are the high level of unemployment and the migration from the country side to the city. One of the disadvantages of these indicators is that the variable income as poverty criterion can be unsuitable considering the differences between the minimum income required by households living in regions that are rich in natural resources and provide food to their inhabitants without the mechanism of the market, and the minimum income required by households living in regions in which the basket of goods and services must include elements that are not necessary in other regions, e.g. security, certain types of transport, etc. In fact, the households´ structure of expenditure in different regions matters.
As Sen (2001) asserts, "the instrumental relation between the lack of rent and the lack of capacity varies from one community to other and even from a family to other and from individuals to others (the influence of rent on capacities is contingent and conditional)" .
Finally, the Human Development Index - HDI is an indicator created with the purpose of making appropriate international comparisons. The calculation of the HDI is based on three dimensions: i) longevity or life expectancy when being born; ii) level of education, based on a combination of alphabetization of adult people (wight: two thirds) and of the rates of enrolment in primary, secondary and university education (weight: a third); and iii) standard of life, measurement based on the acquisition power of household, which is assumed to be the per-capita GDP adjusted for purchasing power parity.
For each dimension there is an estimated value between 0 and 1. HDI is a simple average of the three dimensions. One advantage of HDI with respect to other indicators is the possibility of fitting it by the index of Gini - being this a fourth dimension. The increase (diminution) of the gap between the HDI and HDI adjusted by Gini indicates the increase (decrease) of inequality in income distribution. From Table 1, a slight enlargement of the gap can be seen for Colombia in the analyzed period.
]]> In summary, every index of poverty tells us a different story about how many poor people there are in Colombia. The motivation of this paper is that - whichever measure we consider- the critical poverty situation in Colombia deserves more attention. Considering education as a powerful weapon against poverty, studying the incidence and feasible improvements in public spending allocation is justified.2.2. Education in Colombia
Table 2 shows the gross and net coverage of education by level.7 The constitutional mandatory for the government to guarantee universal coverage of basic education is almost reached for primary level. However, the problem is still big for high school (10th and 11th grade) and higher education. The low rate in pre-school is due to the high percentage of children less than 7 years old attending primary level. In section 4.3.1 we will see that the problem at this level is smaller than the coverage rates show.
Both the gap between gross and net coverage and the decrease in overall coverage as the level of education increases, are consequences of several factors such as i) withdrawal from the educational system of poor people, ii) temporal withdrawal of people who need to work and then postpone the attendance to the school, iii) lack of opportunities for the majority to access to the higher education (available slots, requirements of admission), iv) lack of resources for people who want to continue in the educational system [(Zuluaga and Bonilla (2003)].
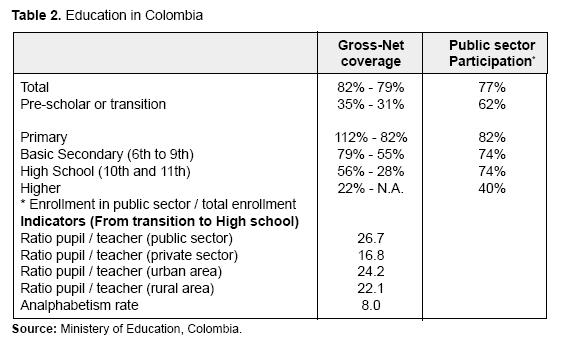
As it is also shown in Table 2, public participation in education supply is higher for elementary and high school, while for pre-school and higher level the contribution of the private sector in the total supply is more significant.
Another factor to emphasize is the difference in quality between private and public sector. One of the indicators to measure this difference is the ratio pupil / teacher in every sector, which is larger for the public sector in Colombia. Results of the students in knowledge tests are also better for students in private schools than in public schools.
In Colombia, there is a growing concern for the quality of education in the last years. In order to monitor such quality, knowledge tests (Pruebas Saber) in Mathematics, language and Natural Sciences have been given to children in primary and secondary level. Unfortunately the results in all of the three tests were not good in 1994 and they got worse in 1998, for both Mathematics and Language. In 2003 the results for Natural Sciences were roughly similar to 1994´s (Table 3).
]]>
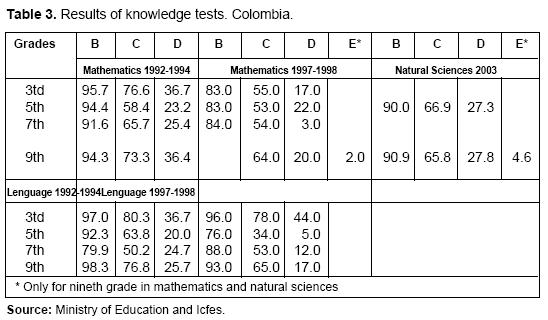
While the results became worse, public spending in the year of the last test was three times higher than the expenditure in 1994. Clearly, the public spending policy has failed in improving the level of quality of the education received by the students. A basic education and high school of better quality would increase the retention rate in the university, and would help the young in developing analytical capabilities which would make them more attractive in the labor market.
2.3. Public spending on education in Colombia
As Figure 1 shows the public spending on education has increased considerably in the last decade. Governors have included in their development plans an apparently aggressive strategy to increase the coverage of education throughout the country. owever, it is pertinent to say that the additional resources are oriented toward improvements not only in quality and coverage of education, but also in attending the large debt that government owes to the teachers in service and pension debt. This problem has to be considered in measuring the incidence of public spending. This research excludes from the spending impact analysis the resources to cover the debt with the so-called " Magisterio" (Colombian teachers´ organization), as it clearly does not result in better quality or higher coverage of the schooling system (though, of course, it is an obligation of the government to pay this debt).
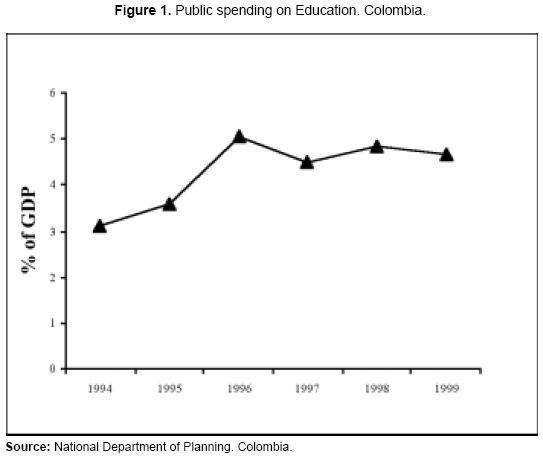
During the nineties, the resources for education increased 2,6 times. However, as the national Department of Planning recognized, the Government guarantees the educational service to less children than it could guarantee given the existing resources. "This is a consequence of an inflexible distribution of national transferences for education, an insufficient effort of the departments and municipalities and an inadequate organization and performance of the educational service" (Social Conpes, 57).
From 2002 the National Government adopted a new method for transfering resources for education (health and other social services), in an effort to correct the mentioned problems. The criterion of allocation is the enrolled students, and the idea is to make the transferred resources independent from historic costs, as it had been until then. The methodology for analyzing the impact on poverty of the public spending on education proposed in this paper can be a useful tool for evaluating the success of this reform in resources allocation, which is expected to be a better strategy for the efficiency of the public spending, as it is focused on the demand (enrolled students). The examples presented here in section 4, as they correspond to the year 2002, do not capture the impact of this reform. This is a motivation for further research.
3. METHODOLOGY
3.1. Behavioral Approach: Impact of the local public spending on the school attendance of the poor
]]> As the name suggests, this approach is based on the analysis of changes in the behavior of the poor people that can be attributed to the public spending. The policy maker expects that the increase in education spending positively affects the attendance of the most disadvantaged groups of population. This paper will verify this finding for the case of Colombia, since such an increase in attendance is not guaranteed if there are problems in the allocation of the additional resources.One technical tool for determining if the public spending is affecting the decision of the poor to participate in the schooling system is a Probit model of schooling attendance, in which several variables that are expected to have explanatory power are included, in addition to the public spending variables.
The Probit model has a binary dependent variable A, which takes the value of 1 if the person goes to the school or 0 otherwise. A number of previous researches (Sanchez and Nunez (1994), Gaviria and Barrientos (2001), among others) have found that a vector of individual characteristics and a vector of characteristics of the household to which the individual belongs are important to determine the probability of attendance - though they differ in the variables including in each vector. We include also two variables of public spending in education.



Where subscript i denotes individual, j city and s social stratification level. I includes gender, age and a dummy variable equal to 1 if the individual works (0 otherwise). H comprises education level of the head of the household, number of persons in the household, highest level of education in the household and social stratification of the house.8 The last two variables have never yet been included in Colombian papers studying participation in the schooling system. Yet Vivas (1994) considered the highest level of education in a model to analyze the welfare profile of vulnerable groups in Cali-Colombia. Gij is percapita public speding on education in city j in which individual i lives (including national and local resources). Finally, Kij is the per-capita public spending in school restaurants (city j). Gij and Kij are not included in the same regressions as they are correlated: allocation criteria between cities for this kind of expenditures are very similar in Colombia.
3.2. Benefit Incidence Analysis
The second approach that we consider in this paper is the so-called "Benefit Incidence Analysis" . This method has been highly used in the literature of incidence of public spending and can be considered as a complementary tool to the behavioral methodology presented in the previous section. While the behavioral approach regards the changes in the actions of the poor people (the decision to attend the school), the BIA is focused in determining how the benefits of the public spending is allocated between income groups of population.
The BIA approach regards the cost of providing education and the use of this service. It is useful to answer the key question whether the allocation of public spending is reaching the poor people. The method assumes that the cost to the government of providing the service is a proxy of the benefit derived by consumers. "It (BIA) brings together elements of the supply of and demand for public services and can provide valuable information on inefficiencies and inequities in government allocation of resources for social services and on the public utilization of these services. BIA is an easy to use tool for ex-ante design as well as ex-post monitoring and evaluation of the effectiveness of social spending programs [(Davoodi et. al. (2003)]" .
]]> BIA results allow us to determine whether the public spending is progressive (it reduces inequality) or regressive and whether education public expenditure is being well used to transfer benefits to the poor. The estimations are obtained through several steps that were summarized by, among others authors, Davoodi et. al. (2003). The first step is to calculate the average unit cost of providing education as the ratio between public spending on education and the beneficiaries of the service, that is, the total number of enrolled students (total and per level of education).The second step is based on the following assumption: considering the average unit cost of providing education as equivalent to the average benefit from public spending on education, as long as the public in-kind transfers (e.g. education and health) increase welfare of the beneficiaries. Third, choose a welfare measure (e.g. income or expenditure) to rank the population of users and potential users9 (i.e. population in schooling age plus enrolled students out of schooling age) from poorest to richest and divide them in equal number of users groups. This step is useful to specify whether public spending is "propoor" or "pro-rich" .
At the fourth step, the average benefit from public spending on education (step two) is multiplied by the number of enrolled students in each income or expenditure group, in order to obtain the distribution of benefits. These first four steps correspond to the estimation of equations (4) and (5) below. Formally, the BIA is developed as follow (Demery (2003)). Total benefits from public spending on all levels of education ensued to group j is:
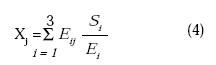
Where Xj is quantity of education spending that benefits group j (in this paper, population will be divided in five groups (or quintiles) according to the level of income, so j = 1, 2, 3, 4, 5), E is the total enrolment in public schools, S is the government education expenditure, and i represents the level of education - elementary, secondary and tertiary -. The ratio  at the right hand side of equation (1) is the unit cost of providing education at level i.
We then calculate the share of total education spending attributed to each group of income (j), by dividing every term of (2) by total public education spending:
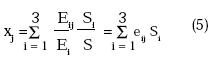
Where both eij, the average participation rate of group j in level i of education, and Si, intrasectoral allocation of spending, determine the benefit incidence of group j.
Davoodi et al. (2003) propose also a fifth step consisting of comparing the resulting distribution of benefits (step for) with benchmark distributions, in order to derive useful policy recommendations, by using Concentration curves. The Concentration Curve plots on the horizontal axis the (cumulative) proportion of individuals, ranked from poorest to richest, and the (cumulative) proportion of benefits received by individuals on the vertical axis.
The benchmark for targeting of a distribution of benefits is the 45º line in Figure 2. If the distribution lies above this line, it is considered pro-poor. A distribution is pro-rich if the curve lies under the 45º line. On the other hand, the benchmark for progressiveness is the Lorenz curve of income (or whatever welfare measure as consumption or expenditure). Thus, if the distribution curve is above the Lorenz Curve - but below the 45° line, it is considered progressive; otherwise we can say that public spending is regressive. Why progressive? Because the proportion of the benefits from public spending for lower-income groups is larger than their participation in the total income, which is expected to have a redistributive effect.
]]>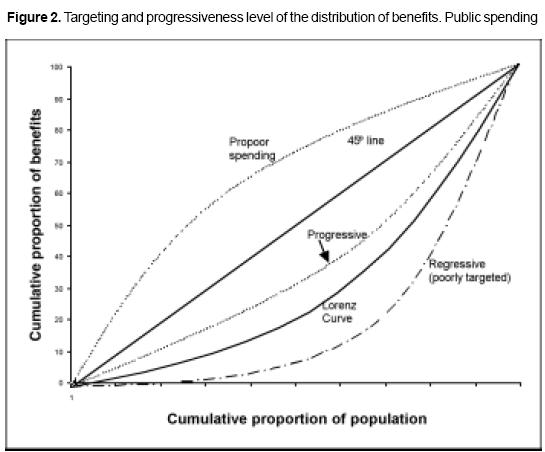
As can be seen in Figure 2, when benefits from public spending are propoor, they are also progressive, but progressiveness does not imply propoor spending.
Although BIA is not enough to have a solid idea of the required pro-poor reforms in governmental spending, it is still a useful tool in order to know how the public spending is distributed among different groups of population; that is why it is worth to include it in an analysis of the governmental spending incidence, with additional methodologies to extend the incidence examination.
3.3. Targeting error
A complementary method to the behavioral and BIA approaches is related to the target population of the government expenditure. One attractive objective of the public spending policy is the minimization of errors in targeting. In general terms, we can identify two kinds of errors in the allocation of government spending. Type I error corresponds to the exclusion from the beneficiaries group of poor people that surely need the subsidy. On the other hand, type II error consist of including people in that group who could obtain the good or service with their own resources. Both errors make government´s actions inefficient in attacking poverty through public spending. Table 4 illustrates the two types of errors.
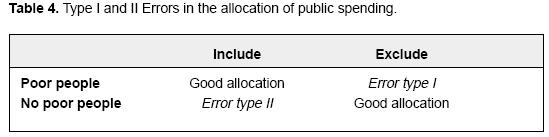
Table 4, however, should be interpreted in a different way when it is applied to education expenditure. In that case, identifying who should be included in the group of beneficiaries seems to be easier than specifying who should be excluded. Who should be included? All people considered as a poor. Who should be excluded? All non-poor people? The answer is no. The problem is not that many nonpoor people use the public education service, but it is that poor people have fewer opportunities to access and stay in the educational system.
In this sense, we can say that for the case of education, it is only type I error which can be sensibly defined.10 As a complementary method to the behavioral and BIA approaches in order to measure the impact of public spending on poverty, we will find the proportion and number of poor people excluded from the schooling system.
]]> 4. RESULTS4.1. Probit model for School attendance
In this section, we will develop a Probit model to determine how relevant the local public spending has been in influencing the participation of the low income students in the educational system. As it was mentioned in the previous section, this kind of calculations belongs to the behavioral approach for determining the impact of public spending on poverty.
We will use information from a Continuous Households Survey (ECH - Encuesta Continua de Hogares) in Colombia, which contains data at both individual and household level for the urban area of the cities. The unit of analysis in this model is the individual. We considered people between 5 and 17 years old living in the nine biggest cities in Colombia.11 Therefore, the analysis corresponds to the pre-school, elementary and secondary12 levels of education. The analyss for superior level of education is to be developed separately, since all the structure of public spending for this level in Colombia is completely different to the system for elementary and secondary, making a joint study inappropriate.13
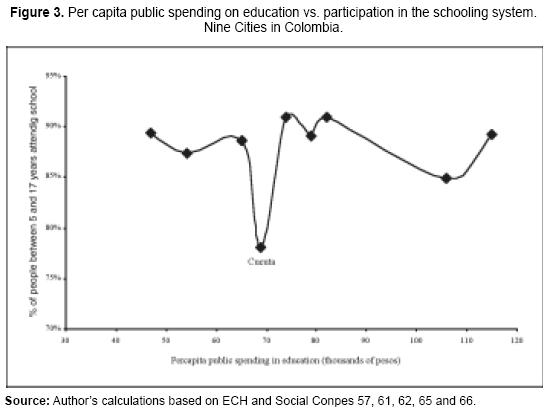
Table 5 shows the outcome of the basic model by city, without spending variables -corresponding to equation (1) - and table 6 the results by levels of social stratification including the variable per-capita public spending on education - corresponding to equation (2). The group of regressions in table 6 does not include the information of Cucuta, since the relationship between attendance and public spending in this city is atypical with respect to the other cities, which can introduce noise into the results. Figure 3 shows this relationship.
All the variables resulted significant and, excluding some exceptions, with the expected sign. With respect to the variable "schooling years of the head of the household" the outcome reveals, for most of the cases, the existence of a vicious circle represented by the impact of the schooling level of the "head" on the probability for the children to attend school: the less years of education of the " head" the lower probability of attendance. The exceptions (negative sign for the coefficient of "head_sch" ) are the cities of Cali and Cucuta (Table 5) and the lowest (SS 1) and the two highest (SS 5 and 6) levels of social stratification (Table 6). These cases (except Cali) are also those with a higher coefficient for the variable " highest level of education in the household" , which can be a possible explanation of this result: the positive impact of the increase of education of one member of the household onto the probability of schooling attendance for the rest of the members could eventually alter the negative inertial impact of the education level of the parents over the education of the children. If one of the children can reach higher levels of education, this encourages the other individuals from the same household to continue in the educational system.
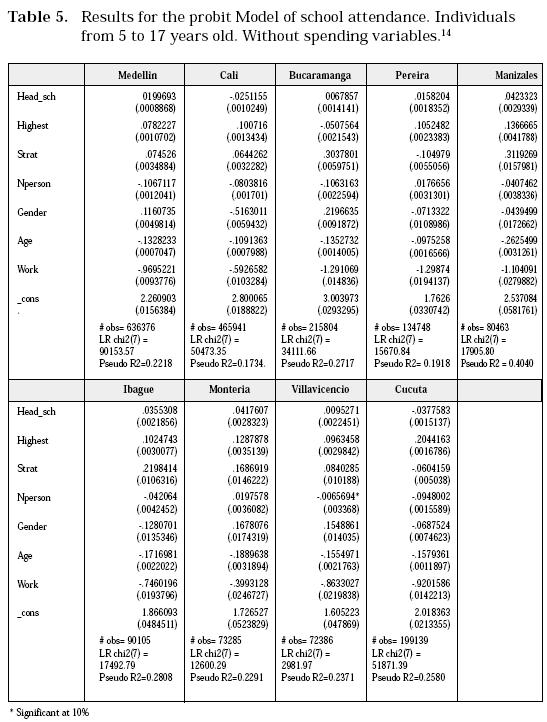
We also found that the variable "highest level of education in the household" has greater influence on the participation than the variable "years of education of the household head" (the sign of the coefficient is positive for all cities and all social stratification levels, but Bucaramanga). This fact has an important policy implication: to guarantee the permanence in the schooling system until the highest level of education for at least one member of each household would have a positive impact on the probability for the rest of the members to attend school. This suggestion can be deduced from Vivas (1994), who already found that the highest level of education of one member of the household has the most important role in explaining the differences between income groups of the population (probability of being poor), together with other variables of human capital (years of education of the household head and average education level of members in age to work).
In addition, the coefficient of the social stratification16 of the household suggests, as it is obvious, that the probability of participation in the schooling system increases with the social classification of the house in which the individuals live. The interesting - although out of the scope of this research - issue of this finding is the link that we could make between this result and the discussion about relative deprivation, introduced 40 years ago by Runciman (1966): "people´s attitudes, aspirations and grievances largely depend on the frame of reference within which they are conceived" . Runciman suggests that the reference group (e.g. community in which the individual lives) determines the feeling of deprivation of a person. Applying this to our discussion, we could say that the individuals living in a community in which most of the people attend school are more motivated to go to the school (or to send the children to the school); otherwise a feeling of deprivation would occur.
The exceptions for the sign of the coefficient of social stratification are Pereira and Cucuta. In fact, in these cities the percentage of attendance for the 3 lowest stratification levels is higher than the percentage for the three highest levels (91,21% and 87,53% respectively for Pereira and 76,71% and 73,47% for Cucuta). For this last city, the attendance is relatively low for both lowest and highest social levels (Figure 3).
The number of people in the household has also a significant impact on school participation. A higher amount of people in the household reduces the probability of attendance. The result suggests that one way to increase the efficiency of public spending on education is to include a more aggressive sexual and family planning education (including pregnancy prevention methods) in the academic curriculum. Pregnancy of women in school age is still a big phenomenon in Colombia, especially among low income groups, which makes it more difficult to break the vicious circle of poverty.
]]> As exceptions, Pereira, Monteria and population belonging to social stratification 5 and 6 presented a negative coefficient for the variable "number of members" . One reason for this can be that the percentage of attendance in these cites and for this social level is very high (91% for both cities and 96% for 5 and 6 social levels), weakening (or in any case altering) the importance of the size of household in the probability of schooling attendance.Related to the variables of individual characteristics we found, as expected, that the participation of an individual in the labor market has a very high negative impact on the participation in the schooling system. These results are consistent with the information for all the country reported by the National Department of Statistics in Colombia (Table 7).
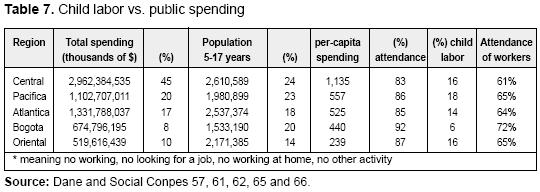
In fact last column of Table 7 shows that the attendance level decreases by around 20 points for working children with respect to the total percentage of attendance. Even if it were not like that, people younger than 18 years still need some preparation for the labor market and need to spend some of their time in recreation, social and cultural activities, and not working.
With respect to age, the result reflects the fact that many young students have to leave school to enter the labor market, and the probability of staying in the schooling system decreases with age. This is also consequent with the low participation rate in higher education in Colombia. This fact also contributes to maintain the vicious circle of poverty: if poor people abandon school at early age, they will not be able to be competitive in the labor market and will be condemned to very low wages during all their working life. In fact, the gap between wages for skilled and unskilled workers in Colombia has reached huge proportions.
Results for the coefficient of variable " gender" for all regressions are not conclusive: in half of the cases the probability of attendance seems higher for girls and the opposite for the other half. In Colombia, discrimination does not exist at any level of education for men or women. However, there is evidence for the last years about the longer permanence of women in the schooling system comparing with men, due to the higher incorporation of men at early ages to the labor market and to the increasing educational aspirations of women.
Let us focus now on the variable of public spending, the main interest of this research. The outcome for the aggregate of the 8 cities shows that public spending - as it is desirable- has a positive impact in the probability for the children to attend the school (Table 6). However, the disaggregated results by social stratification levels reveal that the public spending is not increasing the probability of attendance of population from the lowest social level. There are many obstacles that prevent public spending to be efficient in increasing such a probability at that social level: more teachers or more schools are not enough for capturing the worse-off group of population into the schooling system. For people with very low income it is difficult to attend school even if they do not have to pay any fee, as it implies costs: schooling material, school uniform and the opportunity cost of being at school and not working at least at home. In this sense, a group of social assistance policies oriented to this group of the population is highly justified.
We can refer now to the results for equation (3) that are shown in Table 8. This group of regressions includes only the population between 5 and 11 years old, since the main target population of the public spending in school restaurants is the youngest people enrolled in the official system. 17
]]>
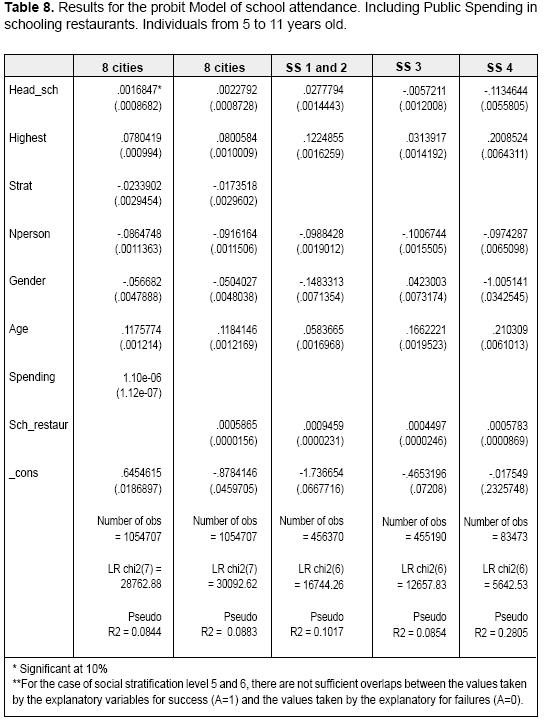
Apart from the result for spending in schooling restaurants, it is interesting also to highlight the outcome for the coefficient of the variable "age" and stratification level. When we consider population until 17 years old such coefficient resulted negative (Table 6). In this case (5 to 11 years) the sign is the opposite, which shows that the risk of abandoning school as age increases is mainly at secondary level of education: once the child has started elementary school the probability of finishing this level is increasing. This is not true any more once he/she finishes this level of education.
The coefficient for stratification level - unlike the case in which individuals until 17 years old were included in the regression- has negative sign. The explanation can be that primary education in Colombia has been a priority for the government from several decades ago, and the public spending on this level of education is highly progressive (the highest share of benefits is for the worse-off groups), as it will be shown in section 4.2 through the Benefit Incidence Analysis.
The variable of spending in school restaurants has definitely a positive impact on the participation. The result suggests that this kind of spending increases the efficiency of the general public spending on education, as it contributes to the increase in the probability of school attendance. The coefficient is higher for the lowest social stratification levels and decreases with such level.
Intuitively, spending in school restaurants also increases the efficiency of the education spending, as higher nutrition level of the students can be reflected in better academic results of the students. It can also constitute a saving in future health spending, as better nutrition during childhood and youth decreases the risk of illness through the life.
Some policy makers argue against social assistance policies. They use as a motto "it is more valuable to teach how to fish than giving the fish" . That could be true, but not in the case of Colombia and other countries, where some children and young students go to the school without any meal (no strength to fish). A proper combination of short-run (social assistance) and long-run policies will be necessary until olombia reach a better social situation.
4.2. Benefit Incidence Analysis
We used information from the Household Continuous Survey - ECH about beneficiaries of the public schooling system. Public spending data comes from the "social Conpes" (National Department of Planning) and National Ministry of Education. The five steps for the BIA exposed in section 3.2 have been applied for each city and each level of education. However, the complete analysis could only be applied for 3 of the 13 cities included in the survey (Manizales, Pereira and Barranquilla), since many households (20% in average) from the other cities had at least one member´s income unreported, not allowing for total income estimations.18
For the computation of the total income of households, we added the income of all the members: employees, unemployed and inactive, as well as the different kinds of income - wage, earnings, rents, pensions, aids, dividends and other sources. In cases in which one of the sources of income was not reported, the income of the household was not calculated - to avoid under-estimation- and the household was not included in any quintile.
The results of equation (4) - the amount of resources ensued to each quintile of income- are presented in Annex 1. From that information, the results of equation (5) were estimated and they are shown in Table 9. As it can be observed, the share of benefits for the poorest quintiles is significantly higher for the three first levels of education. The results are exactly the opposite for higher education, in which around 60% of the benefits are captured by the 2 richest quintiles of income.
]]>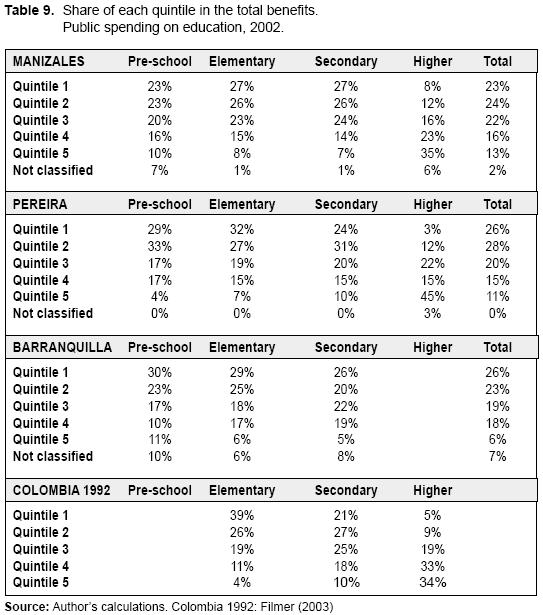
At the bottom of Table 9 is also shown the results of the BIA for the year 1992, presented by Filmer (2003) in a paper about international comparisons of this method of incidence analysis. What is surprising about this information is that the results do not present big differences in 10 years, while as it was shown in section 2.3, the public spending on education presented the highest increase ever. Although we can not deny the improvement in the participation rate during the decade, the public spending has failed in allowing the poorest groups of the population to reach the higher education, which limits its impact on poverty.
The fifth step of the BIA better illustrates the relative success in the distribution of resources for basic education and high school and the perversion in the distribution of benefits for the higher level. In fact, for the three cities - Manizales, Barranquilla and Pereira- the benefits allocation from pre-school to high school is both progressive (concentration curve lies above the Lorenz curve) and propoor (the curve lies above the 45° line). On the contrary, the concentration curve for higher level lies under the 45° line, that is, public expenditure on this level is pro-rich. Although, the distribution of benefits in Manizales is progressive, as long as the concentration curve lies above the Lorenz curve. For the case of Pereira, the position of the concentration curve and Lorenz curve reveals that the worse-off group of population receives a lower proportion of the benefits comparing to their share on income.
The coming message from the BIA results is clear: it is time to orient the efforts toward the higher level of education, in order to make more significant the impact of the resources for education on poverty. It is not enough to have basic or high school level of education to be competitive in the labor market. The problem is both slots and financing resources. Section 5 - conclusions and recommendations- includes a groups of suggestions which could eventually contribute to the alleviation of these problems (technological or technical secondary level, increase of the information for available scholarships, fairness in competition for slots in public universities, among others).
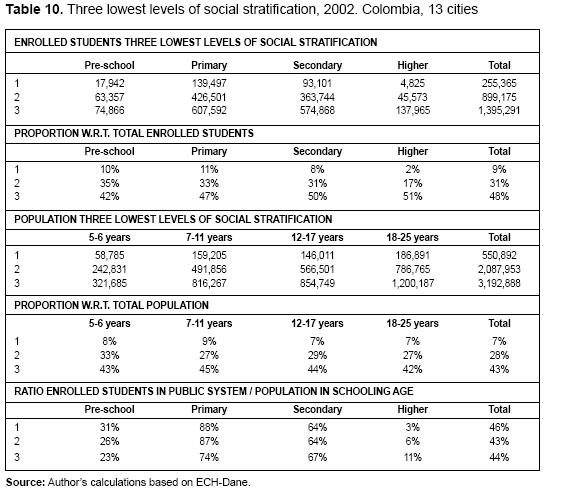
As a complement to the previous analysis, it is also useful to determine the coverage rate of the public system by income groups. In order to havea picture closer to the country reality (13 cities), we use the social stratification - explained in section 4.1- in order to analyze the situation of the worse-off individuals. Doing so, we find that the higher participation in subsidies for pre-school, elementary and secondary of lowest income groups is not only due to the goodness of the allocation, it is also because these groups have a big proportion of the total population in schooling age.
4.3. Targeting error
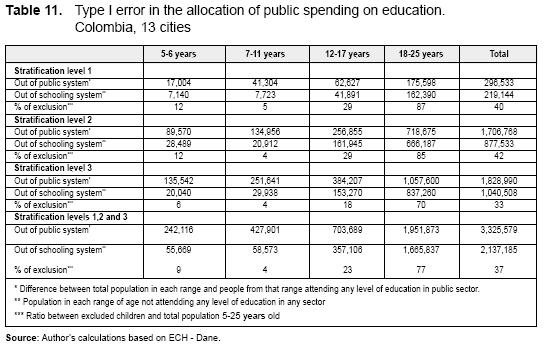
As it was mentioned in section 3.1, type I error in the allocation of public spending on education refers to the poor people excluded from the schooling system. In this section, we consider the population belonging to the three lowest levels of social stratification in the 13 principal cities in Colombia. Stratification level (from 1 to 6 in Colombia) is a good indicator of the poverty situation of a household, as it is based on conditions of the house, utilities, characteristics of the neighborhood, among others. Independently of what the existing measures of poverty say about who should be considered poor or not, we can say that population from these three levels of social stratification have to be considered as a target of the education public expenditure: taking into account the households that reported complete income in the ECH, the estimations for monthly average income per-person for these levels are 164, 117 and 101 thousands of pesos respectively (51, 37 and 32 euros). Obviously, this amount of money does not allow a representative household from these social levels to afford a good quality private institution, thus they are supposed to be the main recipients of the public expenditure on education.
To calculate the type I error, we considered the target population of the spending on education of the government: children and young from 5 to 25 years from the three lowest levels of social stratification.19 The error in allocation is represented by those not attending any level of education in any sector - public or private- , and it is shown in the second and third rows in Table 11.
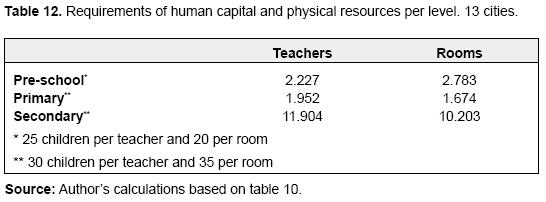
In terms of requirement of resources, we could use the results in Table 12 to roughly calculate the deficit of teachers and class-rooms per level of education. In the case of teachers it does not mean necessarily hiring all those new public servants. A redistribution of the current staff can partially help.
Finally, what to do with those 1,6 millions of young excluded from the higher education institutions? We will mention a group of policy recommendations in section 5.
]]> 5. CONCLUSIONS AND RECOMMENDATIONSThis paper presents a methodology for evaluating the impact on poverty of the public spending on education. The idea was to combine previous proposals for measuring the incidence of the public spending (BIA specifically), with complementary methods of analysis that make the evaluation more complete. The proposal here does not pretend to be entirely complete. On the contrary, the first recommendation is to continue looking for complementary methods to be added to those exposed here, at the rhythm in which more information is available for this purpose.
The proposal for the analysis of education public spending impact presented here consists of two approach es, behavioral and Benefit Incidence Analysis. In addition, ameasure of targeting errors in the allocation of the expenditure is estimated. We applied this methodology to the case of Colombia (or cities from Colombia) and the results were reported in this paper.
It is worth saying that in 2002, policy makers in Colombia started a new mechanism of allocation of public spending for education, health and other social services. The analysis here corresponds precisely to this year of transition. When the new required information is available, it would be valuable to re-apply the proposed methodology of incidence, to see the impact of this reform in the efficiency of public spending.
Several conclusions can be extracted from our results. The Probit model of school attendance showed that public spending has a positive impact on the probability for children to attend school. Unfortunately, this is not true in the case of population from the lowest social level. As it was mentioned in section 4.1, many obstacles prevent public spending from being efficient in increasing the probability of attendance for the lowest social level, mainly the schooling costs different to fee. Social assistance policies oriented to this group are required to make more efficient the education expenditure.
The result when including spending in school restaurants suggests that this kind of spending increases the efficiency of the general public spending on education, as it contributes to the increase in the probability of school attendance mainly for the lowest social stratification levels. Spending in school restaurants also increases the efficiency of the education spending, as higher nutrition level of the students can be reflected in better academic results of the students. It can also constitute a saving in future health spending, as better nutrition during childhood and youth decreases the risk of illness through the life.
With respect to the other variables included in the Probit model, we found that variable "highest level of education in the household" has greater influence on the participation than the variable "years of education of the household head" , which has an important policy implication: to guarantee the permanence in the schooling system until the highest level of education for at least one member of each household would have a positive impact on the probability for the rest of the members to attend school.
In addition, a higher amount of people in the household reduce the probability of attendance, suggesting that one way to increase the efficiency of the public spending on education is to include a more aggressive sexual education (including pregnancy prevention methods) in the academic curriculum. The model also showed that the attendance probability decreases for working children.
Related to the second approach, the main problem revealed by BIA is in higher education: public spending at this level is pro-rich and only slightly progressive. It is time to orient the effort to this level of education, thinking in strategies that allow young to stay in the educational system. The problems are the limited supply of slots in the public system and the incapability of the poor to finance that stage of education. One of the conditions for public spending to be efficient is to target and reach the good and services that poor people indeed use. The government must find mechanisms for finding out about the needs and behavior of the main receptors of its spending: poor people. Finally, the analysis of targeting errors allows us to roughly calculate the deficit in terms of human and physical resources required to cover the type I error, or poor children excluded from the schooling system in each range of age (Table 12).
A group of policy recommendations can include: i) An expansion of the coverage of the SENA (Servicio Nacional de Aprendizaje),20 and an increase in the quality of the programs, ii) Increase of the scholarships available for students from low stratification levels to attend public or private institutions of good level iii) technical and technological secondary education in order to allow poor people to obtain abilities for the labor market. In that way they would be able to self-finance their superior studies iv) to increase slots in existing public universities oriented to worse-off groups.
]]> One debate in Colombia is whether it is convenient to offer a unique type of secondary education, say academic or classical secondary, instead of diversifying according to the population´s needs. This entails - for instance - to privilege technical education in schools located at poor zones. Technical education opponents say that this proposal implies a sacrifice of mathematical education, reading and analytical capacities, which are fundamental general capabilities for everyone.It is true that we can not neglect the importance of those general capabilities, but neither can we neglect the reality of some poor groups of population.21 Situation of students from low income groups makes it necessary to offer a secondary education in which they can acquire certain abilities that allows them to enter the labor market. In that way, they could pay higher education by themselves. A classic secondary education is useful only for students that can immediately enroll in a university. It is a minority in Colombia.22
With respect to the availability of scholarships for poor people to attend institutions of higher learning, it is not only required to expand the amount of them, but also to increase the information for poor students about the existing scholarships. Zuluaga and Bonilla (2003) found that students from the poorest area in Cali-Colombia are not privy to such information.
FOOT NOTES
1. Estimations of poverty levels for 2003 differed between the National Department or Planning (decreasing to 53%) and the "Contraloria General de la Republica" (increasing to 64%). Both estimations are very high, which makes much less interesting the discussion about who is right.
2. In spite of the improvement in the access to education in Colombia, the big gap between rich and poor increased in the last 20 years. This inequality made poverty increase in 9% during that period (World Bank, 2002).
3. That is on the same line of Amartya Sen (2001): i) poverty is not only lack of income but it is also the privacy of capabilities, and ii) income is a "mean" and capabilities are an "end" . In this sense, education could be considered as an "end" itself and not only as a "mean" to obtain more income, as long as it increases individual capabilities.
4. Selowzky (1979) is the author of a seminal paper about the methodology of BIA applied to Colombia.
5. Lanjouw and Ravallion (1998) proposed a technique to identify marginal incidence by comparing average incidence among regions.
6. This way to construct the poverty line can be considered as better than the usual 1 dollar criterion, with which one household is poor one day and the next day is not poor any more given the variation in the exchange rate.
]]> 7. Gross coverage is the ratio between total enrolled students and people in schooling age (3-6 years transition, 7-11 primary, 12-15 basic secondary, 16-17 high school and 18-25 superior). For net coverage the numerator includes only the enrolled students in the respective schooling age.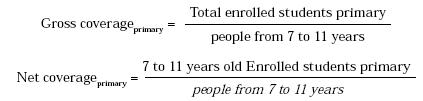
8. Some researches include as human capital variables schooling years of the head of the household and schooling years of his/her wife/husband. However, these two variables are correlated.
9. Davoodi et. al. mentioned only "users" and no potential users. However, if we include only users in the third step, the distributions of benefits will be the same among groups, as the average benefit calculated in the first step is unique.
10. When measuring the impact of public spending on health, both type I and type II errors can be properly identified as it is indicated in Table 4.
11. Cali, Medellin, Bucaramanga, Pereira, Manizales, Ibague, Monteria, Villavicencio and Cucuta. Bogota, Cartagena, Barranquilla and Pasto were excluded because they have different structure of sources of income for public spending, not allowing for comparison.
12. Basic secondary (6th to 9th grades) and high school (10th and 11th grades).
13. People younger than 18 attending higher education were excluded from the sample.
16. In Colombia, households are divided in six groups of social stratification, according to the geographical location, which is related with the income of the households, materials of construction of the house, utilities of the house.
17. It is worthy to note that this kind of spending is specially oriented to indigenous and rural population. In urban areas is mainly oriented to the youngest students in public schools.
]]> 18. For further applications of the metodology, a researcher would better use the results of the next Survey of Income and Expenditures of the National Department of Statistic in Colombia.19. Officially (from the Ministry of Education), the range of age starts in 3 years but the Households Continuous survey only includes people from 5 years on in the education module.
20. Sena offers technical and technological programs at low cost to people who have finished the secondary level of education.
21. "I remember that I keenly taught economic theories, showing that they gave us answers to all kind of problems. I was very sensitive to the beauty and elegance of those theories. Then, I suddenly started to be aware of the vanity of that teaching. What was its usefulness if people were dying of hunger on the roads?" Yunus (1997).
22. Zuluaga and Bonilla (2003), based on surveys applied at schools, found that students in eighth and ninth year start to question whether it is useful or not to continue their studies. They ask themselves if they will have in fact more opportunities by finishing secondary studies. Many of them leave the educational system for failing in perceiving the opportunities.
REFERENCES
Aaron, H. and McGuire, M. (1970). Public goods and income distribution. Econometrica, volume 38 Nº 6, November. Pages 907 - 920. [ Links ]
Ayala, U. et all. (2001). "Hacia una red de protección social para Colombia" . Fedesarrollo. Colombia. [ Links ]
Brennan, G. (1967). The distributional implications of public goods. Econometrica, volume 44 Nº 2, March. Pages 391 - 399. [ Links ]
Castro - Leal, F, et. all. (1999). Public Social Spending in Africa: Do the poor benefit? The World Bank Research Observer, vol. 14, n° 1. Pages 41 - 72. [ Links ]
Davoodi, H. Tiongson, E. and Asawanuchit, S. (2003). How useful are Incidence Benefit Analyses of public education and health spending? IMF working paper. [ Links ]
Demery, L. (2003). Analyzing the incidence of public spending. Washington, D.C.: World Bank. [ Links ]
Departamento Nacional de Planeación - DNP (2000). Coyuntura Económica e Indicadores Sociales. Boletín # 26. Julio. [ Links ]
Departamento Nacional de Planeación. (2002). Social Conpes 57, 61, 62, 65 and 66. [ Links ]
Filmer, D. (2003). The incidence of public expenditures on health and education. Washington, D.C.: World Bank. [ Links ]
Fresneda, O. González, J.I. Cárdenas M.E., Sarmiento L. (1994). "Reducción de la Pobreza en Colombia: el impacto de las políticas públicas". PNUD. [ Links ]
Hammer, J. et.al. (1995). Distributional effects of social sector expenditures in Malaysia, 1974 - 89. In: Public spending and the poor. Theory and evidence. Edited by Dominique Van de Walle and Kimberly Nead. World Bank book. Pages 521 - 554. [ Links ]
Gaviria, A. and Barrientos, J. (2001). Determinantes de la calidad de la educacion en Colombia. Papers of Economics. National Department of Planning. Bogota, Colombia. Number 159, November. [ Links ]
González, J.I. and Sarmiento A. (1997). "La calidad de la educación y el logro de los planteles educativos". Revista Planeación y Desarrollo vol. XXVIII No. 1. [ Links ]
Lanjouw P. and Ravallion, M. (1999). Benefit incidence, Public Spending Reforms, and the timing of program capture. World Bank Economic Review, 13(2). [ Links ]
Lanjouw P. et. all. (2001). Poverty, Education and Health in Indonesia: Who Benefits from Public Spending? World Bank. [ Links ]
Nina E. and Grillo S. (2000) "Educación, movilidad social y Trampa de la pobreza". Coyuntura Social No. 22. Fedesarrollo. Colombia. [ Links ]
Pérez, F. (1997) "Nuestro sistema de gasto educativo empobrecerá a los pobres". Revista Estrategia Económica y Financiera. No. 253. [ Links ]
Ravallion, M. (1999). Are poorer states worse at targeting their poor? In: Economic Letters, 65. [ Links ]
Sánchez, F. and Núñez, J. (1997). "¿Porqué los niños pobres no van a la escuela?". Departamento Nacional de Planeación. Colombia. [ Links ]
Selden, T. and Wasylenko, M. (1995). Measuring the distributional effects of public education in Peru. In: Public spending and thepoor. Theory and evidence. Edited by Dominique Van de Walle and Kimberly Nead. World Bank book. Pages 154 - 186. [ Links ]
Selowzky, M. (1979). Who benefit from government expenditure? A case of study for Colombia. Oxford University, Press New York. [ Links ]
Sen, A. (1999). Development as Freedom. USA: Alfred A. Knopf Ed. [ Links ]
Sen, A. (2001). La desigualdad economica. With a fundamental annex from Sen and Foster. México D.F.: Fondo de Cultura Economica. [ Links ]
Van de Walle, D (1995). Incidence and targeting: an overview of implications for research and policy. In: Public spending and the poor. Theory and evidence. Edited by Dominique Van de Walle and Kimberly Nead. World Bank book. Pages 585 - 594. [ Links ]
Van de Walle, D (1998). Assessing the welfare impacts of public spending. World Development, volume 26, N°3. [ Links ]
Van de Walle, D (2003). Behavioral Incidence Analysis of Public Spending and Social programs. S.L.: World Bank. [ Links ]
Vivas, H. (1996). Perfiles de bienestar de los grupos vulnerables en el área metropolitana de Santiago de Cali. Lecturas de Economía # 44. Universidad de Antioquia: Medellín. [ Links ]
World Bank (2002). Colombia poverty report. World Bank, Volume 1, March. [ Links ]
Younger, S. (1999). The relative progressivity of social services en Ecuador. In: Public Finance Review, vol. 27 N° 3, pages 310 - 352. [ Links ]
Younger, S. (2002). Benefits on the margin: observations on Marginal Benefit Incidence. New York: Cornell University. [ Links ]
Yunus, M. (1998). Hacia un mundo sin pobreza. Editorial Andrés Bello. Chile. [ Links ]
Zuluaga, B. and Bonilla, D. (2003). El papel de las instituciones educativas públicas en la eliminación de la pobreza. Borradores de Economía. Economics Department, Icesi University, Cali - Colombia. [ Links ]