ARTICLES
The consumer's choice among television displays: A multinomial logit approach
La elección del consumidor entre visualizadores de televisión: una aproximación logit multinomial
Le choix du consommateur entre les différents types d'écrans de télévision: Une approche logit multinomial
]]> Carlos González*; Natalia Serna**
* Doctor en economía. Profesor Tiempo Completo, Departamento de Economía, Universidad Icesi, Cali, Colombia. Dirección postal: Calle 18 n° 122-135 Pance, Cali, Colombia. Tel.: (+57) 2 5552334, Ext. 8844. Dirección electrónica: cggonzalez@icesi.edu.co. Web-Page: www.icesi.edu.co/cggonzalez.
** Economista y Negociadora Internacional. Practicante Banco de la República sucursal Cali. Dirección postal: Calle 18 n° 122-135 Pance, Cali, Colombia. Tel.: (+57) 2 5552334, Ext. 8844. Dirección electrónica: nsernabo@banrep.gov.co.
Los errores u omisiones son de exclusiva responsabilidad de los autores.
–Introduction. –I. Discrete choice models for estimating demand systems. –II. Empirical Strategy. –III. Data and descriptive evidence. –IV. Estimation. –Conclusions. –References.
Primera versión recibida el 6 de mayo de 2013; versión final aceptada el 17 de julio de 2013
ABSTRACT
]]> The consumer's choice over a bundle of products depends on observable and unobservable characteristics of goods and consumers. This choice is made in order to maximize utility subject to a budget constraint. At the same time, firms make product differentiation decisions to maximize profit. Quality is a form of differentiation. An example of this occurs in the TV market, where several displays are developed. Our objective is to determine the probability for a consumer of choosing a type of display from among five kinds: standard tube, LCD, plasma, projection and LED. Using a multinomial logit approach, we find that electronic appliances like DVDs and audio systems, as well as socioeconomic status, increase the probability of choosing a high-tech television display. Our empirical approximation contributes to further understanding rational consumer behavior through the theory of utility maximization and highlights the importance of studying market structure and analyzing changes in welfare and efficiency.Keywords: Observable product characteristics, product differentiation, quality, television display.
JEL Classification: D12, L15.
RESUMEN
La decisión de los consumidores sobre un conjunto de productos depende de las características observables y no observables de bienes e individuos. Esta elección se hace para maximizar la utilidad sujeta a una restricción presupuestaria, al mismo tiempo que las firmas deciden diferenciar los productos para maximizar sus beneficios. La calidad es una forma de diferenciación; esta ocurre, por ejemplo, en el mercado de televisores, donde se desarrollan diversos visualizadores. Nuestro objetivo es determinar la probabilidad de que un consumidor escoja un tipo de pantalla entre cinco opciones: televisor estándar, LCD, plasma, proyección y LED. Usando una aproximación logit multinomial, los resultados muestran que los DVDs, los sistemas de audio y el estatus socioeconómico incrementan la probabilidad de elegir un televisor con visualizador de alta tecnología. Nuestro estudio contribuye al entendimiento de la teoría de la maximización de la utilidad en consumidores racionales y resalta la importancia de analizar la estructura del mercado y cambios en el bienestar y la eficiencia.
Palabras claves: Características observables del producto, diferenciación de producto, calidad, dispositivo del televisor.
Clasificación JEL: D12, L15.
RÉSUMÉ
Le choix des consommateurs sur un ensemble de produits dépend des caractéristiques observables et non observables. Ce choix peut être expliqué à travers un processus de maximisation de l'utilité du consommateur soumis à une contrainte budgétaire, tandis que les entreprises choisissent de différencier les produits offerts à travers un processus de maximisation de leurs profits. La qualité est une manière qui sert justement à différencier un produit, c'est le cas par exemple du marché des téléviseurs avec des différents types d'écrans. Notre objectif est de calculer la probabilité qu'un consommateur choisis un certain type d'écran parmi les cinq options suivantes: télé standard, LCD, plasma, projection et LED. À travers une approche logit multinomial, nous montrons que les caractéristiques techniques additionnelles de la télé (un DVD ou bien un système audio) et le statut socioéconomique du consommateur, augmentent la probabilité de choisir un téléviseur avec un écran High-Tech. Notre étude contribue ainsi à la compréhension de la théorie de la maximisation de l'utilité du consommateur rationnel, puis que nous soulignons l'importance d'analyser la structure du marché et les changements dans le bien-être et dans l'efficience.
Mots-clés: caractéristiques observables du produit, différenciation des produits, qualité, appareils de télévision.
]]> Clasificación JEL: D12, L15.
INTRODUCTION
Several factors affect the consumer's decision over her bundle of choices. Price and quality are some of them. In the case of the market for electronic appliances, firms often produce many varieties of products within the same line of production to increase profit. This market exhibits certain level of imperfect competition due to the vertical differentiation of goods by quality. In fact, differences in quality are a form of price discrimination that has little or nothing to do with production costs (Hastings, 2004). Thus, variations in price and quality explain why consumers choose or buy one product over another. Other factors affecting it are the demographic characteristics and unobservable attributes of products and buyers, which can emerge from external shocks to demand (Berry, Levinsohn and Pakes, 2003).
We follow the theoretical framework of utility maximization. This framework states that consumer's preferences can be modeled through a utility function, in which an ordinal measure of product satisfaction is the variable of interest and price and income are determinants (Mas-Colell, Whinston, Green, 1995). Quality and exogenous shocks to demand also determine the consumer's decision over a bundle of choices. In our paper, we use a discrete choice model as an approach to the indirect utility function (Nevo, 2003). We apply this method to the television market in order to determine the consumer's choice over a type of TV display. Specifically, the multinomial logit predicts the probability for the consumer of choosing a type of display, conditional on observable and unobservable characteristics of both products and consumers. This empirical approximation to the television market contributes to further understanding rational consumer behavior through the theory of utility maximization. It also stimulates the study of market structure and its welfare implications through the theoretical linkages between the firms' problem of maximizing profits and the consumers' problem of maximizing utility.
This paper is structured as follows: the first section presents the theoretical framework. In the second section, we introduce our empirical approach. Then, in the third section, we describe our database and the relevant variables for the multinomial logit. Finally, in the fourth section, we present the estimations. We conclude by giving some additional remarks.
I. Discrete choice models for estimating demand systems
The estimation of differentiated products demand systems is an efficient way to analyze substitution patterns and the market shares for a family of products. It is also a way of addressing observable and unobservable characteristics of products that determine the decision of whether a consumer purchases certain attributes.
]]> Anderson, Palma and Thisse (1989) proposed a specific characteristics framework to model product differentiation. They linked several conceptual approaches in their study: the ''representative consumer model'' (Spence, 1976; Dixit and Stiglitz, 1977), the bundle of characteristics model (Lancaster, 1979; Archibald, Eaton and Lipsey, 1986), and the probabilistic choice framework (Perloff and Salop, 1985). Using the logit, probit, and linear probability models the authors concluded, ''randomness in observed consumer behavior lies in the unobservable characteristics that influence consumer choices'' (Anderson et al., 1989, p. 1). In the particular case of the multinomial logit, they stated that consumer and product heterogeneity are the same at the aggregate level. Then, using aggregated data would solve the problems of unobserved heterogeneity and yield consistent and asymptotically efficient estimators.Dale and Roheim (1990) also developed one of the theoretical approaches regarding the use of micro-data to estimate demand systems. They suggested that micro-data helps to measure the effects of demographic variables. However, household-level data tend to have many missing values because some goods have zero consumption levels. This issue motivates the authors to use a censored dependent variable or otherwise they will obtain biased results. Further analysis showed that a more accepted method was developed to estimate demand systems. It is known as the BLP method, described in the following.
Berry et al. (2003) showed that micro and macro data are important to describe the consumer's preference relation, which depends on price and the distribution of attributes among products. Their results showed that as the variance of the error term, representing random tastes for a specific characteristic, increases, then products with similar attributes become better substitutes. The BLP procedure also helps to model the decision of buying the outside product (i.e. the decision of not buying or dedicating the remaining income to buy products outside of the bundle). However, when macro data is not available then variables such as the market share, which is correlated with the error term, has to be obtained through simulations over the logistic distribution of the probability for consumer of choosing product with characteristics.
Additionally, Nevo (2003) used demand systems to evaluate the determinants and implications on welfare. He studied the effect of quality changes in existing products and inclusion of new products. Using data for ready-to-eat cereal, he estimated a discrete choice model and concluded that despite increases in price, the consumed quantity had also grown because of the development of higher quality, and so a general increase in welfare was perceived. Precisely, the error term captured the effect of unobserved characteristics like quality on consumer welfare.
The difference between the BLP method and the approach developed by Nevo (2003) lies on the treatment of unobserved product characteristics. For the first authors, the error term shows the evolution of the unobserved product characteristics, while the second assumes these characteristics are fully represented by the residual.
Nilsson, Fostrer and Lusk (2006) also used the BLP model in their study. The random utility maximization theory helped them exemplify the demand for certified pork chops in the United States. The discrete choice model applied in their study allows elasticities and product substitutability to vary between three consumer segments in the pork chops market. After evaluating the demand elasticity, the authors showed that as the number of certification attributes increases within each class, the own-price elasticity increases as well. Then, although the buying probabilities are equal, the degree of substitutability varies considerably between consumer segments. This gives evidence on the importance of including demographic characteristics in the specifications.
Dunn (2012) developed another application of the BLP procedure in the anti-cholesterol drug market. The author finds that risk factors and drug insurance have a significant effect on the decision of purchasing anti-cholesterol drugs. They also build a price index, in which quality-adjusted prices suggest that the real price of non-statin drugs has declined over the period from 1996 to 2007. Nonetheless, this result is independent of the variation of the unobserved mean utility; so, under certain conditions, price is independent of external shocks to demand.
Consumer's choice can also depend on previous choices. Bass (1969) argues that the first purchase decision follows an S-shaped pattern. The author focuses on the diffusion theory in which the probability of adopting a new product depends on market potential, the number of adopters, the brand, and generational factors such as the incremental market potential. The diffusion model approach may be suitable for analyzing the market for durable goods. However, it does not allow studying competition among products nor considering the demand for future products. Addressing these limitations, Lee et al. (2006) developed a ''conjoint analysis estimation of the static random utility function'' that preserves the generational factors, includes the consumer's preferences for new products and allows forecasting a product's market share. Lee et al. (2006) applied this method to estimate the future demand for large-screen TVs in Korea. In this same fashion, Sultan (1999) examined the individual's inter-temporal preferences for different levels of technology in high-definition televisions.
Several factors are important for the estimation of demand systems: first, technological changes affecting the dynamics of demand are relevant for the study of the TV market, in the sense that it helps explain consumers' expectations. The development of new technologies accounts for a large portion of the variation in price, making it relevant for the study of the substitution patterns within the line of production. Second, the choice of price or level of quality implies matching the characteristics of both the demand side and the supply side (Epple, 1987).
Moulton, LaFleur and Moses (1998) studied the TV market, particularly the quality improvements in televisions and how this affected their price levels. The authors used the CPI television component in the U.S. and designed a hedonic price approach that captures the effect of innovations in the field of sound, display and size. Their estimations yielded the following results: important quality changes came from the surround sound, projection and picture-in-picture inclusion. However, tied services like free delivery or console models did not help explain the changes in price. In terms of the size of the television, results verified that the effect of screen size on the marginal price had fallen with the passing of years. The fact that there are many available sizes and varieties of televisions in the market implies that it is not difficult for consumers to choose certain size conditional on price. Moulton et al. (1998) also determined that a typical television set remained in the sample for less than a year, but the replacement items were selected in order to be close enough in characteristics to the one the consumer used to have. Then, replacements did not explain changes in quality of televisions.
]]> Utility maximization is the theory behind our specification, which depends on vertical differentiation of goods by quality analyzed first by Gabszewicz and Thisse (1979) in oligopolies. The television market in the United States can also be considered an oligopoly because brand names explain quality and price differentiation: ''a set with the same screen size and other observable characteristics with a premium brand name, such as Sony, may sell for as much as 50 percent more than similar television from a less prestigious brand'' (Moulton et al., 1998, p. 9). The existence of price variations among similar products means there are several choices for consumers over TV displays and other attributes.Because price measurements impact the level of utility reached by a consumer, the demand system comes from an indirect utility function that depends on price and observable characteristics of both consumers and products. The level of utility given certain attributes will determine the consumer's choice. Then, utility is a discrete variable and its estimation corresponds to a discrete choice model for which we have assumed a logistic distribution. The statistical approach used in this paper follows the analysis of Anderson et al. (1989). We use a multinomial logit to obtain unbiased and consistent estimators.
II. Empirical strategy
Although price is correlated with unobservable product characteristics (because external shocks to demand exert an upward or downward pressure on price) and some of these characteristics are quality improvements, we correct for endogeneity through an instrumental variable approach. In the case of vertical product differentiation, theory also states that it is expected that suppliers' market share is correlated with price to the extent that market power derived from quality improvements will translate into higher prices. Hence, we control for market share in our model.
We are interested in estimating the following indirect utility function:
where vij is a discrete variable denoting five types of TV displays (standard tube, LCD, plasma, projection and LED); xj is a vector of observable product characteristics that vary for each product j; zi is a vector of observable consumer characteristics that vary for each individual i ; β and d γ are the vectors of coefficients describing the constant effect of products' and consumers' observable characteristics on the probability of choosing a type of display, respectively; and εij is an i.i.d. error term for which we assume a logistic distribution.
The statistical model for the choice of TV displays is:


The derivatives of this log-likelihood have the following form:

In the case of having data in the form of proportions, for example market shares (ηi), as in this study, the proper log- likelihood function is:

and its derivatives:

In the following section, we describe our database and present some descriptive statistics.
]]> III. Data and descriptive evidence
For the multinomial logit estimation, we wish to analyze the probability and determinants of choosing a type of TV display. The public use microdata comes from the Residential Energy Consumption Survey of 2009 (RECS) developed by the U.S. Energy Information Administration. This database has 12,083 household respondents and contains information on housing unit characteristics, home appliances and electronics, fuels, housing unit measurements, fuel bills, household characteristics, energy assistance and scanning of fuel bills. Response rates in this survey were of 79% and the missing-value analysis of the variables used in this article showed that there were less than 2% missing values in each of them. Therefore, we could previously determine their inclusion in our model following Dale and Roheim (1990).
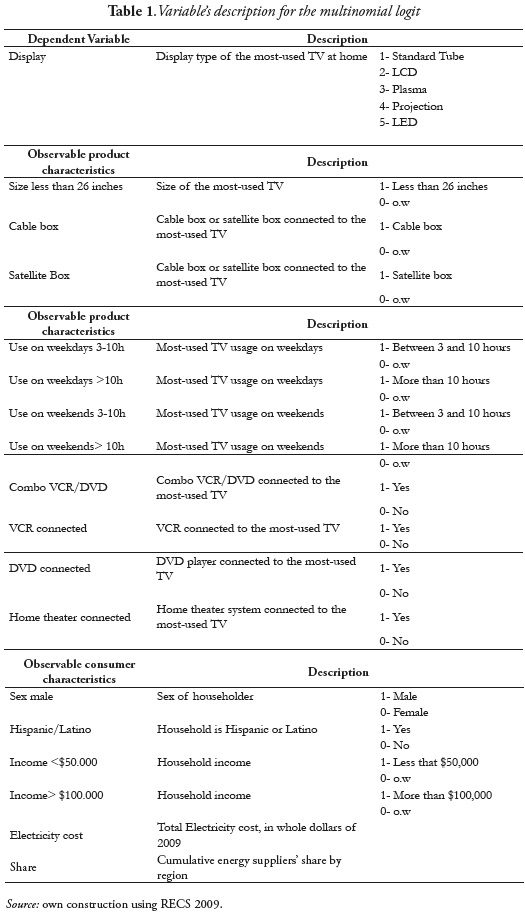
We also collected information from the U.S. Energy Information Administration regarding the amount of televisions supplied to each region in the United States to build the cumulative market share of different TV suppliers by region. This procedure works well because each consumer was also identified by region, so we were able to merge these databases. The explanatory variables used in the estimation of the multinomial logit are reported in Table 1.
Competition in the TV market is imperfect because although there are a lot of consumers, some suppliers (Sony, Samsung, Panasonic, LG, among others) have market power. Product differentiation implies high profit for firms and a large bundle of choices for consumers. Hence, to determine the expected sign of the coefficients in our model, we characterize the television market in this section.
The supply of standard tube televisions and recent developments such as LCD, plasma or LED is evidence that companies within this sector cannot perfectly distinguish their consumers. Firms design menus, bundling or tying strategies so that buyers are self-selected and they can maximize profits (Ekelund, 1970). However, the ability of a firm in this industry to discriminate prices does not depend on its market power, as further results will show, but on the quality of products (Hastings, 2004). Based on the available data, we modeled the effect of price discrimination through the changes in electricity tariffs conditional on the type of TV display. In other words, we focus on the savings on the electricity bill (Electricity cost) when choosing a display.
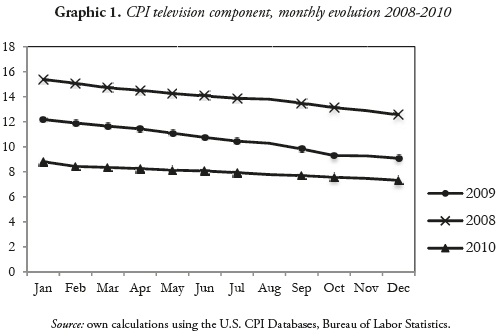
Based on this empirical approximation, we expect the coefficient for DVD and TV audio systems to be positive for the alternatives that display a better image. As the price of televisions is falling (see Graphic 1), we can also expect a positive effect for income>$100.000 over the probability of interest because the income effect on TVs is positive and these are normal goods. The sign of demographic variables is not clear. We might expect that being male influences the most the decision of choosing large displays over small ones, as well as more expensive or high-tech displays.
]]> Graphic 1 shows the decreasing tendency of prices for televisions mentioned by Moulton et al. (1998). During 2008, the CPI for televisions was around 16 points for the month of January. The same for 2009 was around 12 points and in 2010 it decreased until 9 points. The CPI series for the three years shows that there have been both, structural and shortterm, changes in the prices of TVs. This can be explained by the inclusion of a great variety of televisions mainly by screen size and type of display. Moreover, the price of televisions has a positive relation with the size of the screen (Moulton et al., 1998). The decreasing tendency in price should also be reflected in the number of televisions owned per household. Data from the EIA demonstrates that the average number of televisions in a house has increased from 1 in 1978 to 2.5 in 2009. In fact, over 45 percent of homes have bought a large-screen television (approximately 37 inches or larger).
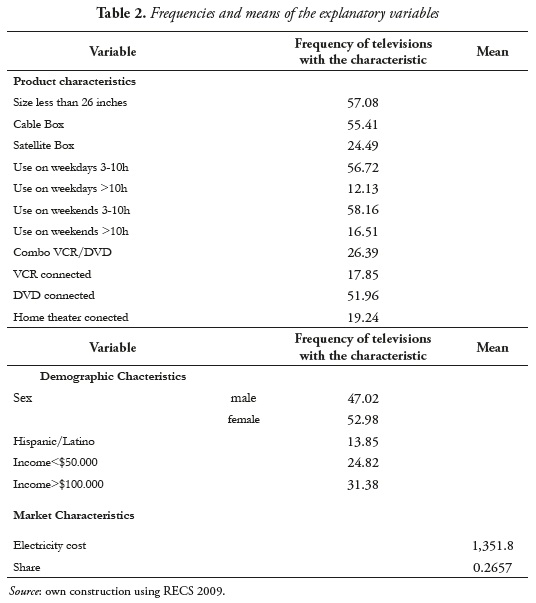
The following table shows the frequencies of the discrete independent variables used in our study and the means of the continuous variables:
From these statistics we can see that more than a half of the individuals reported having televisions with a screen between 21 and 26 inches wide. A higher percentage of the sample had televisions connected to a satellite box (55.41%) rather than to a cable box (24.49%). Also, most of the televisions have a DVD (51.96%) instead of a VCR (17.85%). However, just 19.24% of the individuals have an audio system installed. With respect to the frequency of use, most people (around 56% of the sample) use their televisions between 3 and 10 hours both during weekdays and weekends.
Regarding the demographic variables, there are 5% more females than males, but only 14% of the sample is Hispanic. Nevertheless, 31% of Hispanics earn more than US$70,000 and part of this income is dedicated to the payment of the electricity bill that on average charges US$1,352.
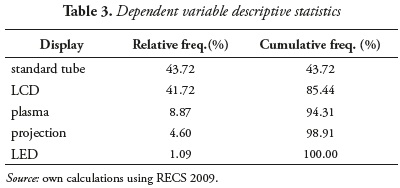
The dependent variable in our study is Display, which denotes 5 types of displays coded 1 for Standard tube, 2 for LCD, 3 for Plasma, 4 for Projection and 5 for LED. From Table 3, we can see that most of the individuals have a standard tube television, which is counter-intuitive given the lower prices of more recent screens and the innovation in the field of image display. Despite this, the percentage of individuals with LCD TV differs only in 2 percent from the ones having standard tube.
Relative frequencies are decreasing with each of the alternatives following standard tube: only a 1.09% of individuals reported having a LED TV and the percentage for Projection display was higher than this one.
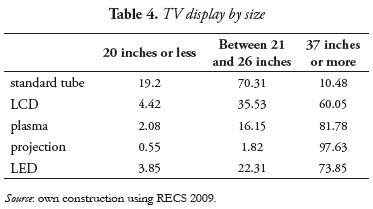
]]> Recent TV displays come in bigger sizes and people would rather buy large TVs with high resolution than small televisions with a good image (see Table 4). Only 10.48% of the standard tube televisions have a display of 37 inches wide or more compared to the 73.85% of LED televisions with this screen size. For the LCD, the percentage of televisions produced with a size between 21 and 26 inches more than doubles the percentage of plasma televisions with these dimensions.
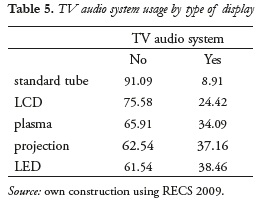
The fact that televisions with high image resolution are developed with larger dimensions gives some insights in relation to the usage of TV audio systems (home theater). Specifically, 8.91% of standard tube televisions had audio systems compared to the 38.46% of LED and 34.09% of plasma televisions (see Table 5). Certainly, there exists a complementarity relation between TV display and TV audio system. Firms that sell electronic devices such as televisions and home theaters have incentives to develop price discrimination mechanisms like the design of bundling and tying strategies that affect the probability of choosing a display.
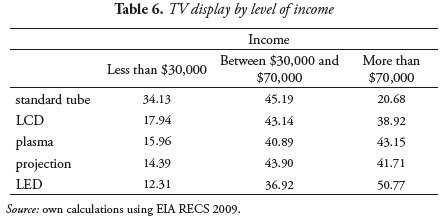
From Table 6, high-income households prefer to buy the last technology developed for television display. This can be noticed by the comparison between the 50.77% of LED televisions bought by families with more than US$70.000 annual versus the 20.68% of standard tube televisions for this same group, followed by LCD, projection and plasma displays. Specifically, by looking at the first column denoting the households that earn less than $30,000 annually, the largest percentage of type of display chosen by this group is the standard tube, followed by LCD, plasma, projection and LED.
Image resolution is also associated to the box connected to the mostused TV. There are two types of boxes: satellite and cable. Table 7 shows the proportion of satellite and cable boxes connected to each type of display:
]]>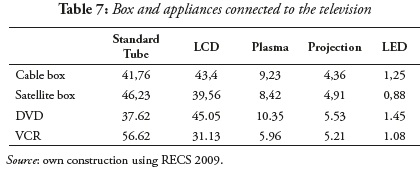
The percentage of LED televisions connected to each type of box is not significant compared to that of the standard tube and LCD. But these results might be associated to the participation of LED televisions in total sales for a supplier during the year the survey was conducted, because this display was just entering the market. Despite the intuition behind the low participation of LED TV by 2009, of all the televisions connected to cable boxes 41.76% were standard tube, 43.4% LCD, 9.23% plasma, 4.36% projection and 1.25% LED.
Information regarding the electronic appliances gives us insights about the obsolescence of some devices, which no longer is compatible with the TV display. VCR, for example, is a common device for standard tube televisions (56.62%) but it is no longer used for LED or plasma TVs (1.08 and 5.96%, respectively). Besides this, only 1.45% of televisions with DVD were LED, followed by 5.53% projection display, 10.35% plasma, 37.62% standard tube and 45.05% LCD.
IV. Estimation
Before estimating a multinomial logit, we have to test IIA to see whether or not this type of model is applicable. After performing the Hausman test for the null that the different irrelevant alternatives or categories are independent, the chi-squared statistic (51 degrees of freedom) assuming standard tube as the base category yields a negative value of 22,997.22, which fails to reject the null. In this test, a negative value for the chi-squared estimator is very common, as noted by Hausman and McFadden (1984). Therefore, a multinomial logit is suitable for the interest of estimating the probability of choosing a television display.
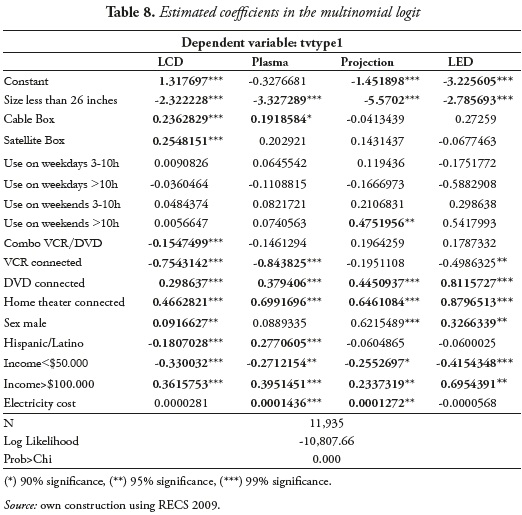
Following this conclusion, Table 8 presents the estimated coefficients for the multinomial logit with Standard Tube as the base category.
]]> Our model fits better than an empty model because the p-value associated to the model's test of significance is less than a significance level of 1%. The coefficients associated to the size of the television, satellite box, cable box, combo VCR/DVD, VCR, DVD, television audio system, householder's gender and race, and low income and high income family are significant. When the television at home has between 21 and 26 inches, the relative log odds of choosing an LCD display vs. standard tube decreases in 2.32 points.
Variables such as having a VCR, being a low-income family and a Hispanic householder are also associated to a negative effect in the relative log odds of 0.75, 0.33 and 0.18, respectively. While the connection to a satellite box and a cable box, having electronic appliances like DVD and home theaters (TV audio systems), being a high-income family and a male are all associated with increases in this relative log odds (0.23, 0.25, 0.29, 0.47, 0.36, and 0.09 points of increase, respectively).
Focusing on the relative log odds of choosing a plasma display vs. a standard tube, some variables such as being connected to a satellite box and a cable box, having a combo VCR/DVD and the householder gender lose significance. However, characteristics that are more compatible with Plasma TVs maintain their significance; for example, TV size, VCR, DVD, audio system and high-income family. For this specification, it is important to notice that the expenditure in the electricity bill is significant at a 99% but its effect over the relative log odds of choosing a Plasma TV over a standard tube TV is very small compared to the relative log odds of the other types of screen. And also if the household has a television audio system, this will increase the relative log odds of choosing a Plasma television in comparison to the base category in 0.70 points.
The electronic appliances that are more compatible with some displays are also associated to larger changes in the relative log odds as the introduction of a type of display in the market is more recent, like in the case of LED TV. The relative log odds of choosing a LED TV vs. a standard tube will increase in 0.81 points when the household has a DVD, and in 0.81 points if they have a home theater. Furthermore, during 2009 the prices of Plasma televisions and LED TV did not converge as they do in recent years. This is why the effect of belonging to the high-income group is larger for LED than for Plasma: having an income higher than US$ 65,000 is related to a 0.69 point increase in the relative log odds of choosing LED over Standard tube.
On one side, for all specifications of the relative log odds, the estimated coefficient for the television size is significant and negative: when it has between 21 and 26 inches wide, a decrease in the relative log odds of choosing any type of display over the standard tube occurs. This finding is related to the fact that consumers would rather buy a large LCD, Plasma or LED TV than a small one because improvement in quality of the image displayed compensates the relative increase in price. So the category for televisions with a larger size (over 37 inches) is expected to have an increasing effect or at least no effect on the relative log odds compared to the categories of less than 21 inches and between 21 and 26 inches wide.
On the other hand, the effect of demographic characteristics is not significant for all specifications. In the case of the householder gender, males tend to choose high-tech large displays over the standard tube and small displays. For the relative log odds of choosing a projection and a LED display over the base category, the increase associated to being a male is of 0.62 and 0.32 points, respectively. The only reason for the existing relation between gender and television size to be relevant is the increase associated to choosing a projection display, which is the largest in magnitude compared to other types of screen. Moreover, projection displays are not produced in small sizes; rather, their size is usually larger than 52 inches.
The expenditure in electricity is considered to capture the effect of price on the relative log odds of choosing display j. However, from Table 8 the effect of the electricity cost is not significant for all specifications. This implies that savings in the electricity bill are not relevant for the consumer's decision or, additionally, the electricity expenditure does not vary significantly by type of display when all the other characteristics are considered.
Although the theory of vertical differentiation in the presence of oligopolistic markets states that market power is a source of higher levels of prices, the measurement of the share value for each type of display was not significant in any of the specifications. Firms should try designing menus, tying sales or bundling sales to maximize profit. This idea is based on the significance of demographic characteristics associated to the socioeconomic status of the household: belonging to the high-income group is significant for explaining the changes in the odds of choosing any type of display in relation to standard tube.
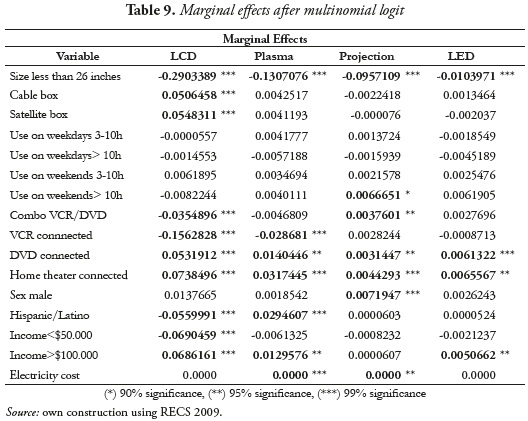
Next we will analyze the magnitude and direction of the effect of the explanatory variables in the probability of choosing each type of screen, independently of the base category. Table 9 reports the estimations for the marginal effects.
]]>The marginal effect of Size less than 26 inches is negative for all the probabilities reported. A television with this characteristic generates a decrease in the probability of choosing a LCD display of 29 percentage points, a Plasma TV of 13, Projection of 9.5 and LED TV of 1 percentage point.
For cable box and satellite box, their effect is significant only for LCD TVs. Once again, electronic appliances that can be combined with the use of television displays and demographic characteristics are also relevant to explain variations of the probability. Specifically, the larger effect among the electronic appliances comes from the television audio system, which generates a 7.4 percentage point increase in the probability of choosing LCD compared to the 5.3 increase of having DVD. In terms of demographics, belonging to the high-income group and being a male produce an increase of 6.8 and 1.4 percentage points, respectively, in this same probability. Reductions come from having a combo VCR/DVD, VCR, belonging to the low-income group and being Hispanic.
For plasma televisions, the marginal effect of gender and low-income household are not significant. Therefore, these variables do not affect the probability of choosing this type of display compared to that of standard tube. Also, having a DVD increases the probability of choosing Plasma in 1.4 percentage points and being a high-income household increases it in 1.3 percentage points. For this display, the magnitude of the effect of having a television audio system is 4 percentage points less than LCD's.
In the case of projection displays, the frequency of use has a significant impact over the probability of choosing it: when the television is used for more than 10 hours during the weekends, the probability of choosing a projection display increases by 0.6 percentage points. As mentioned before, men's decision weights the most when deciding whether to buy a large TV or not. This explains why, in the case of Projection displays, being a male has a positive and significant effect over the probability of choosing this type of screen. Despite this finding, other demographic variables such as income level and race have no significant effect. Then, in the particular case of usage, television audio system and gender are the determinants of the increasing effect on the probability of choosing a projection display in relation to the base category.
As of 2009, LED TVs is the most recent television development in the market. Most of the explanatory variables have no effect on the probability of choosing this display over the rest. As stated before, consumers prefer to have large high-tech screens, which is why the effect of having a display of between 21 and 26 inches wide lowers the probability of choosing LED TV in 1.04 percentage points. Some electronic appliances like DVD and the TV audio system are positively related to this probability, as well as belonging to the high-income group of households.
Summarizing these findings, televisions nowadays come in bigger sizes. But, despite their size and quality improvements, price does not seem to reflect these changes. As noted from the CPI television component, the price of televisions is falling over time.
Most of the individuals in the sample tie the purchase of TV displays with other electronic appliances, mostly with DVDs and audio systems. These products are very important in explaining consumer's decision. However, the frequency of use does not affect it, though descriptive statistics showed that most individuals turned on their TVs between 3 and 10 hours both during weekdays and weekends.
Some demographic variables also seem to influence the consumer's decision: in the case of gender, males prefer larger screens to small ones. Particularly, being Hispanic only affects the probability of choosing LCD and Plasma, but the intuition behind this finding is not very clear at first sight, which is why we have to look at the relation between race and income level. In this sense, 35% of the individuals are Hispanics who earn less than US$30,000, which is the income group that chooses LCD the least. This explains why the effect of race on the probability of choosing LCD TVs is negative. Also, 47% are Hispanics with an income between US$30,000 and US$70,000. Individuals within this group are the ones who choose a large portion of Plasma televisions as reported in Table 6, which explains its positive effect on the probability of choosing a Plasma display.
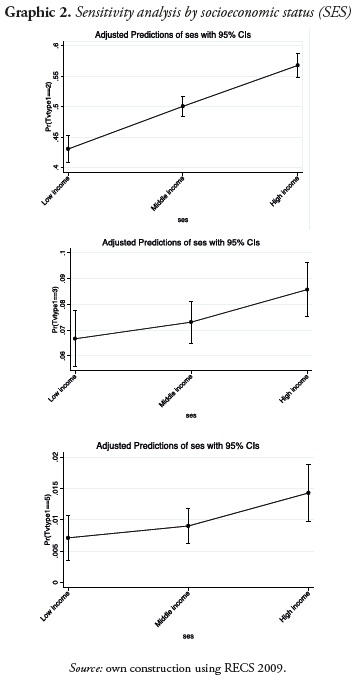
According to the socioeconomic status, Graphic 2 shows how the probability of choosing LCD, Plasma and LED TVs changes when the individual passes from a low-income group (less than US$30,000) to a middle-income group (between US$30,000 and US$70,000) and to a high-income group (more than US$70,000). All these probabilities are increasing with respect to income: while the relation for LCD TVs is linear, the probability of choosing a Plasma TV increases more significantly when the individual passes from the middle-income to the high-income (from 0.74 to 0.86) group, as well as for LED TV (from 0.009 to 0.015).
]]>
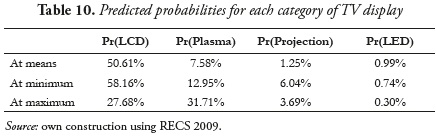
For 2009, our model predicts that for the average individual (for which the variables take their mean value) 51% of the televisions chosen would be LCD, 7.6% Plasma, 1.2% Projection, and a very low percentage LED TVs that at the time were just entering the market (see Table 10). When the probability is calculated on the minimum value for each variable, the prediction for LCD, Plasma and Projection displays are higher by approximately 8%, 4% and 5%, respectively. Finally, when the probability is calculated in the maximum value for each variable, the predictions decrease considerably except for plasma displays.
In the following section we will address the main conclusions obtained from the study.
Conclusions, implications, limitations and future lines of research
The television market has been a source of innovation and product development. Firms in this market cannot perfectly identify the type of consumer. Instead, they develop several products within one line of production. This strategic behavior increases the varieties of products among which consumers choose. In this case, they face the decision of choosing one type of display among standard tube, LCD, plasma, projection and LED. The decision is conditional on demographics and observable product characteristics like size, frequency of use and the electronic appliances connected to the TV. Our findings suggest that most of the televisions chosen by consumers were LCD, while LED TVs had the least probability among the five choices. Moreover, the use of electronic appliances increased the probability of choosing high-tech displays.
Further evidence shows that the price of TVs has been falling over a long period. Thus, price might not be relevant in explaining the decision of consumers over the type of display, as it can also be associated to an inelastic demand. This fact is important for managerial decisions: in the market for durable goods, demand inelasticity allows firms to increase their market share not through price increases but through quality improvements, which in turn accounts for more consumers buying their products. Other marketing strategies such as bundling or tying sales facilitate the identification of consumers and also allow firms to charge higher prices. However, in the TV market, lower prices and greater variety could explain the larger consumer surplus, and an overall increase in welfare is to be expected.
]]> An increase in market share means higher profits. The inclusion of the variable share in our specifications yielded no significant results. This represented a limitation in our study because predicting market share is one of the main results of a BLP model, and this empirical approximation constitutes a first step to such estimation. Thus, future research should use non-parametric techniques to obtain the probability distribution of the market share and enable its prediction. Our data did not contain information about brands, so its impact on the consumer's decision could not be obtained directly. Nonetheless, we assume brand is correlated with quality. The frequency of use and the value of the electricity bill were not relevant for the probability of interest, either.In this type of market, only observable product characteristics for which consumers have available information are significant to the estimation of the relative log odds of choosing a type of display over the base category, standard tube. Among these are size and cable box connection. Demographic characteristics, among which are gender, race and socioeconomic status, impact the most in the decision. This is how we know that the probability of choosing large high-tech displays is larger for males than for females.
References
Anderson, Simon P.; De Palma, André and Thisse, Jacques-François (1989). ''Demand for Differentiated Products, Discrete Choice Models and the Characteristics Approach'', The Review of Economic Studies, Vol. 56, pp. 21-35. [ Links ]
Archibald, George; Eaton, B. Curtis and Lipsey, Richard G. (1986). ''Address Models of Value Theory''. In: Stiglitz J. E and Mathewson, G. F. (eds.) New Developments in the Analysis of Market Structure. London: Macmillan. [ Links ]
Bass, Frank (1969). ''A New Product Growth Model for Consumer Durables'', Management Science, Vol. 15, pp. 215-227. [ Links ]
]]>Berry, Steven; Levinsohn, James and Pakes, Ariel (2003). ''Differentiated Products Demand Systems from a Combination of Micro and Macro Data: The New Car Market'', Working paper No. 6481. The National Bureau of Economic Research. [ Links ]
Bureau of labor statistics (2008-2010). CPI Detailed report tables. Retrieved from: http://www.bls.gov/cpi/tables.htm. [ Links ]
Dale, Helen and Roheim, Cathy (1990). ''Demand Systems Estimation With Microdata: A Censored Regression Approach'', Journal of Business and Economic Statistics, Vol. 8, No. 3, pp. 365-371. [ Links ]
Dixit, Avinash K. and Stiglitz, Joseph. E. (1977). ''Monopolistic Competition and Optimum Product Diversity'', The American Economic Review, Vol. 67, No. 3, pp. 297-308. [ Links ]
Dunn, Abe (2012). ''Drug Innovations and Welfare Measures Computed from Market Demand: The Case of Anti-Cholesterol Drugs'', Applied Economics, Vol. 4, No. 2, pp. 167-189. [ Links ]
]]>Ekelund, Robert (1970). ''Price Discrimination and Product Differentiation in Economic Theory: An Early Analysis'', The Quaterly Journal of Economics, Vol. 84, No. 2, pp. 268-278. [ Links ]
Epple, Dennis (1987). ''Hedonic Prices and Implicit Markets: Estimating Demand and Supply Functions for Differentiated Products'', The Journal of Political Economy, Vol. 95, No. 1, pp. 59-80. [ Links ]
Gabszewicz, Jaskold and Thisse, Jacques- François (1979). ''Price competition, quality and income disparities'', Journal of Economic Theory, Vol. 20, No. 3, pp. 340-359. [ Links ]
Greene, William (2012). Análisis econométrico. Madrid: Prentice-Hall. [ Links ]
Hastings, Justine (2004). ''Vertical Relationships and Competition in Retail Gasoline Markets: Empirical Evidence from Contract Changes in Southern California'', The American Economic Review, Vol. 94, No.1, pp. 317- 328. [ Links ]
]]>Hausman, Jerry and McFadden, Daniel (1984). ''Specification Tests for the Multinomial Logit Model'', Econometrica, Vol. 52, No. 5, pp. 1219-1240. [ Links ]
Lancaster, Kelvin (1979). Variety, Equity and Efficiency. New York: Columbia University Press. [ Links ]
Lee, Jongsu; Cho, Youngsang; Lee, Jeong-Dong and Lee, Chul-Yong (2006). ''Forecasting future demand for large-screen television sets using conjoint analysis diffusion model'', Technological Forecasting and Social Change, Vol. 73, No. 4, pp. 362-376. [ Links ]
Mas-Colell, Andreu; Whinston, Michael and Green, Jerry (1995). Microeconomic Theory, New York: Oxford University Press. [ Links ]
Moulton, Brent; LaFleur, Timothy and Moses, Karin (1998). ''Research on Improved Quality Adjustment in the CPI: The Case of Televisions'', Working Paper. Bureau of Labor Statistics. [ Links ]
]]>Nevo, Aviv (2003). ''New Products, Quality Changes, and Welfare Measures Computed from Estimated Demand Systems'', Review of Economics and Statistics, Vol. 85, pp. 266-275. [ Links ]
Nilsson, Tomas; Foster, Ken and Lusk, Jayson (2006). ''Marketing Opportunities for Certified Pork Chops'', Canadian Journal of Agricultural Economics, Vol. 54, No. 4, pp. 567-583. [ Links ]
Perloff, Jeffrey and Salop, Steven (1985). ''Equilibrium with Product Differentiation'', The Review of Economic Studies, Vol. 52, No. 1, pp. 107-120. [ Links ]
Spence, Michael (1976). ''Product Selection, Fixed Costs and Monopolistic Competition'', The Review of Economic Studies, Vol. 43, No. 2, pp. 217-235. [ Links ]
Sultan, Fareena (1999), ''Consumer preferences for forthcoming innovations: the case of high definition television'', Journal of Consumer Marketing, Vol. 16, No. 1, pp. 24-41. [ Links ]
]]>U.S Energy Information Administration (2009). Residential Energy Consumption Survey (RECS). Retrieved from: http://www.eia.gov/consumption/residential/data/2009/. [ Links ]
]]>