<?xml version="1.0" encoding="ISO-8859-1"?><article xmlns:mml="http://www.w3.org/1998/Math/MathML" xmlns:xlink="http://www.w3.org/1999/xlink" xmlns:xsi="http://www.w3.org/2001/XMLSchema-instance">
<front>
<journal-meta>
<journal-id>0012-7353</journal-id>
<journal-title><![CDATA[DYNA]]></journal-title>
<abbrev-journal-title><![CDATA[Dyna rev.fac.nac.minas]]></abbrev-journal-title>
<issn>0012-7353</issn>
<publisher>
<publisher-name><![CDATA[Universidad Nacional de Colombia]]></publisher-name>
</publisher>
</journal-meta>
<article-meta>
<article-id>S0012-73532013000200003</article-id>
<title-group>
<article-title xml:lang="en"><![CDATA[SALIENCY-BASED CHARACTERIZATION OF GROUP DIFFERENCES FOR MAGNETIC RESONANCE DISEASE CLASSIFICATION]]></article-title>
<article-title xml:lang="es"><![CDATA[CARACTERIZACIÓN DE DIFERENCIAS GRUPALES BASADAS EN SALIENCIA PARA LA CLASIFICACIÓN DE PATOLOGÍAS EN RESONANCIA MAGNÉTICA]]></article-title>
</title-group>
<contrib-group>
<contrib contrib-type="author">
<name>
<surname><![CDATA[RUEDA]]></surname>
<given-names><![CDATA[ANDREA]]></given-names>
</name>
<xref ref-type="aff" rid="A01"/>
</contrib>
<contrib contrib-type="author">
<name>
<surname><![CDATA[GONZÁLEZ]]></surname>
<given-names><![CDATA[FABIO]]></given-names>
</name>
<xref ref-type="aff" rid="A02"/>
</contrib>
<contrib contrib-type="author">
<name>
<surname><![CDATA[ROMERO]]></surname>
<given-names><![CDATA[EDUARDO]]></given-names>
</name>
<xref ref-type="aff" rid="A03"/>
</contrib>
</contrib-group>
<aff id="A01">
<institution><![CDATA[,Universidad Nacional de Colombia BioIngenium Research Group ]]></institution>
<addr-line><![CDATA[Bogotá ]]></addr-line>
<country>Colombia</country>
</aff>
<aff id="A02">
<institution><![CDATA[,Universidad Nacional de Colombia BioIngenium Research Group ]]></institution>
<addr-line><![CDATA[Bogotá ]]></addr-line>
<country>Colombia</country>
</aff>
<aff id="A03">
<institution><![CDATA[,Universidad Nacional de Colombia BioIngenium Research Group ]]></institution>
<addr-line><![CDATA[Bogotá ]]></addr-line>
<country>Colombia</country>
</aff>
<pub-date pub-type="pub">
<day>00</day>
<month>04</month>
<year>2013</year>
</pub-date>
<pub-date pub-type="epub">
<day>00</day>
<month>04</month>
<year>2013</year>
</pub-date>
<volume>80</volume>
<numero>178</numero>
<fpage>21</fpage>
<lpage>28</lpage>
<copyright-statement/>
<copyright-year/>
<self-uri xlink:href="http://www.scielo.org.co/scielo.php?script=sci_arttext&amp;pid=S0012-73532013000200003&amp;lng=en&amp;nrm=iso"></self-uri><self-uri xlink:href="http://www.scielo.org.co/scielo.php?script=sci_abstract&amp;pid=S0012-73532013000200003&amp;lng=en&amp;nrm=iso"></self-uri><self-uri xlink:href="http://www.scielo.org.co/scielo.php?script=sci_pdf&amp;pid=S0012-73532013000200003&amp;lng=en&amp;nrm=iso"></self-uri><abstract abstract-type="short" xml:lang="en"><p><![CDATA[Anatomical variability of patient's brains limits the statistical analyses about presence or absence of a pathology. In this paper, we present an approach for classification of brain Magnetic Resonance (MR) images from healthy and diseased subjects. The approach builds up a saliency map, which extract regions of relative change in three different dimensions: intensity, orientation and edges. The obtained regions of interest are used as suitable patterns for subject classification using support vector machines. The strategy's performance was assessed on a set of 198 MR images extracted from the OASIS database and divided into four groups, reporting an average accuracy rate of 74.54% and an average Equal Error Rate of 0.725.]]></p></abstract>
<abstract abstract-type="short" xml:lang="es"><p><![CDATA[La variabilidad anatómica presente en los cerebros de pacientes limita la realización de análisis estadísticos acerca de la presencia o ausencia de una patología. En este artículo, presentamos una aproximación para la clasificación de imágenes de Resonancia Magnética (MR) cerebral de sujetos sanos y afectados por una patología. El enfoque se basa en un mapa de saliencia, el cual extrae regiones de cambio relativo en tres diferentes dimensiones: intensidad, orientación y bordes. Las regiones de interés obtenidas se utilizan como patrones para la clasificación de sujetos utilizando máquinas de vectores de soporte. El desempeño de la estrategia propuesta fue evaluado en un conjunto de 198 imágenes de MR extraídas de la base de datos OASIS y divididas en cuatro grupos, reportando una tasa de precisión promedio de 74.54% y una tasa de error igual (Equal Error Rate) promedio de 0.725.]]></p></abstract>
<kwd-group>
<kwd lng="en"><![CDATA[Subject classification]]></kwd>
<kwd lng="en"><![CDATA[Magnetic Resonance Imaging]]></kwd>
<kwd lng="en"><![CDATA[Visual Attention models]]></kwd>
<kwd lng="en"><![CDATA[Saliency maps]]></kwd>
<kwd lng="es"><![CDATA[Clasificación de sujetos]]></kwd>
<kwd lng="es"><![CDATA[Imágenes de Resonancia Magnética]]></kwd>
<kwd lng="es"><![CDATA[Modelos de Atención Visual]]></kwd>
<kwd lng="es"><![CDATA[Mapas de Saliencia]]></kwd>
</kwd-group>
</article-meta>
</front><body><![CDATA[ <p align="center"><font size="4" face="Verdana, Arial, Helvetica, sans-serif"><b>SALIENCY-BASED CHARACTERIZATION OF GROUP DIFFERENCES FOR MAGNETIC RESONANCE DISEASE CLASSIFICATION</b></font></p>     <p align="center"><i><font size="3"><b><font face="Verdana, Arial, Helvetica, sans-serif">CARACTERIZACI&Oacute;N DE DIFERENCIAS GRUPALES BASADAS EN SALIENCIA PARA LA CLASIFICACI&Oacute;N DE PATOLOG&Iacute;AS EN RESONANCIA MAGN&Eacute;TICA</font></b></font></i></p>     <p align="center">&nbsp;</p>     <p align="center"><b><font size="2" face="Verdana, Arial, Helvetica, sans-serif">ANDREA RUEDA    <br>   </font></b><font size="2" face="Verdana, Arial, Helvetica, sans-serif"><i>M.Sc. BioIngenium Research Group, Universidad Nacional de Colombia, Bogot&aacute;, Colombia, <a href="mailto:adruedao@unal.edu.co">adruedao@unal.edu.co</a></i></font></p>     <p align="center"><font size="2" face="Verdana, Arial, Helvetica, sans-serif"><b>FABIO GONZ&Aacute;LEZ</b>    <br>   </font><font size="2" face="Verdana, Arial, Helvetica, sans-serif"><i>Ph.D. BioIngenium Research Group, Universidad Nacional de Colombia, Bogot&aacute;, Colombia, <a href="mailto:fagonzalezo@unal.edu.co">fagonzalezo@unal.edu.co</a></i></font></p>     <p align="center"><font size="2" face="Verdana, Arial, Helvetica, sans-serif"><b>EDUARDO ROMERO</b>    <br>   </font><font size="2" face="Verdana, Arial, Helvetica, sans-serif"><i>Ph.D. BioIngenium Research Group, Universidad Nacional de Colombia, Bogot&aacute;, Colombia, <a href="mailto:edromero@unal.edu.co">edromero@unal.edu.co</a></i></font></p>     <p align="center">&nbsp;</p>     ]]></body>
<body><![CDATA[<p align="center"><font size="2" face="Verdana, Arial, Helvetica, sans-serif"><b>Received for review March 2<sup>th</sup>, 2012, accepted September 27<sup>th</sup>, 2012, final version November, 6<sup>th</sup>, 2012</b></font></p>     <p align="center">&nbsp;</p> <hr>     <p><font size="2" face="Verdana, Arial, Helvetica, sans-serif"><b>ABSTRACT: </b>Anatomical variability of patient's brains limits the statistical analyses about presence or absence of a pathology. In this paper, we present an approach for classification of brain Magnetic Resonance (MR) images from healthy and diseased subjects. The approach builds up a saliency map, which extract regions of relative change in three different dimensions: intensity, orientation and edges. The obtained regions of interest are used as suitable patterns for subject classification using support vector machines. The strategy's performance was assessed on a set of 198 MR images extracted from the OASIS database and divided into four groups, reporting an average accuracy rate of 74.54% and an average Equal Error Rate of 0.725.</font></p>     <p><font size="2" face="Verdana, Arial, Helvetica, sans-serif"><b>KEYWORDS:</b> Subject classification, Magnetic Resonance Imaging, Visual Attention models, Saliency maps.</font></p>     <p><font size="2" face="Verdana, Arial, Helvetica, sans-serif"><b>RESUMEN:</b> La variabilidad anat&oacute;mica presente en los cerebros de pacientes limita la realizaci&oacute;n de an&aacute;lisis estad&iacute;sticos acerca de la presencia o ausencia de una patolog&iacute;a. En este art&iacute;culo, presentamos una aproximaci&oacute;n para la clasificaci&oacute;n de im&aacute;genes de Resonancia Magn&eacute;tica (MR) cerebral de sujetos sanos y afectados por una patolog&iacute;a. El enfoque se basa en un mapa de saliencia, el cual extrae regiones de cambio relativo en tres diferentes dimensiones: intensidad, orientaci&oacute;n y bordes. Las regiones de inter&eacute;s obtenidas se utilizan como patrones para la clasificaci&oacute;n de sujetos utilizando m&aacute;quinas de vectores de soporte. El desempe&ntilde;o de la estrategia propuesta fue evaluado en un conjunto de 198 im&aacute;genes de MR extra&iacute;das de la base de datos OASIS y divididas en cuatro grupos, reportando una tasa de precisi&oacute;n promedio de 74.54% y una tasa de error igual (Equal Error Rate) promedio de 0.725.</font></p>     <p><font size="2" face="Verdana, Arial, Helvetica, sans-serif"><b>PALABRAS CLAVE:</b> Clasificaci&oacute;n de sujetos, Im&aacute;genes de Resonancia Magn&eacute;tica, Modelos de Atenci&oacute;n Visual, Mapas de Saliencia.</font></p> <hr>     <p>&nbsp;</p>     <p><font size="3" face="Verdana, Arial, Helvetica, sans-serif"><b>1.  INTRODUCTION</b></font></p>     <p><font size="2" face="Verdana, Arial, Helvetica, sans-serif">In morphometrical analyses of Magnetic Resonance brain images from different groups of subjects, the main goal is to examine and identify anatomical differences, that can be associated with the presence or absence of a pathology. Most common approaches for automatization of these analyses comprise two main processes. First, all images are warped or registered together within a common reference frame or template. Then, statistical quantities or comparisons can be calculated, based on specific measurements of interest. Depending on the measurements, morphometric analyses can be classified in landmark-based &#91;1&#93;, related with specific spatial information; voxel-based &#91;2&#93;, related with intensities or tissue class labels; deformation or tensor-based &#91;3&#93;, related with the deformation fields used to align the subjects; or surface-based &#91;4&#93;, related with 3D reconstruction of boundaries between main tissues.</font></p>     <p><font size="2" face="Verdana, Arial, Helvetica, sans-serif">All these methods assume, or even force, a one-to-one correspondence between subjects, allowing the computation of statistics from measurements of the same anatomical regions across all subjects. However, due to anatomical variability, this assumption is not completely true. In fact, the same anatomical structure may be not be present in all subjects, or may exhibit multiple morphologies across the population. On the other hand, some pathologies may affect multiple anatomical structures or interconnected regions, localized far away from each other. These kinds of patterns are difficult to find and analyze with standard techniques.</font></p>     ]]></body>
<body><![CDATA[<p><font size="2" face="Verdana, Arial, Helvetica, sans-serif">To cope with this issue, different approaches have been proposed, based on subject clustering &#91;5&#93;, multiple atlases &#91;6&#93; or residual error components &#91;7&#93;, among others. One of the most effective proposals so far is called feature-based morphometry (FBM) &#91;8&#93;, which attempts to identify distinctive, localized anatomical patterns whose occurrences in groups are statistically significant. These patterns are characterized using a set of distinctive scale-invariant features, and these local features thus replace the global atlas as the basis for morphometrical analysis. This approach has been used to model anatomical variability in MR volumes and to discover group-related anatomical patterns in volumetric brain images.</font></p>     <p><font size="2" face="Verdana, Arial, Helvetica, sans-serif">This paper presents an approach to model group differences in structural brain MR images, based on visual saliency maps. A state-of-the-art visual saliency method &#91;9&#93; is used to generate saliency maps that highlight particular regions, which can be associated to disease-related patterns that allow further subject classification, in particular Alzheimer's disease. It is important to highlight that the construction of the saliency maps did not include any a priori information regarding the pathology. The visual saliency maps are used to build an image kernel (calculated with two different measures), which is fed to a support vector machine to deliver an adequate differentiation between normal controls (NC) and probable Alzheimer's disease (AD) subjects. To our knowledge, none of the existing methods have addressed the problem of automatic classification of MR volumes using visual saliency regions as features, which turn out to be anatomically consistent with brain regions known to differ between AD and NC groups.</font></p>     <p><font size="2" face="Verdana, Arial, Helvetica, sans-serif">In the next section we first describe the proposed method, followed by experiments using the OASIS dataset &#91;10&#93;. We also compare the results with other previously proposed methods.</font></p>     <p>&nbsp;</p>     <p><font size="3" face="Verdana, Arial, Helvetica, sans-serif"><b>2. CLASSIFICATION OF NEURODEGE-NERATIVE DISEASES</b></font></p>     <p><font size="2" face="Verdana, Arial, Helvetica, sans-serif">Two different kinds of classification systems recently proposed for diagnosis support of neurodegenerative diseases based only on information from structural MR images can be identified. The first one makes use of shape descriptors applied on manually &#91;11,12&#93; or automatically &#91;13,14&#93; segmented anatomical regions, previously known to be affected by the disease, however, the obtained results are subject to the segmentation accuracy and prior information about anatomical regions. The second approach performs statistical analysis of the brain images without including any prior pathological information &#91;15,16,17&#93;, which can potentially discard relevant regions from the classification analysis.</font></p>     <p><font size="2" face="Verdana, Arial, Helvetica, sans-serif">The first step in a classification method for brain images is the inference of those voxels where the morphological structures differ between groups of patients, thus reducing the amount of information available for training the model. This inference is usually established through voxel-by-voxel statistical analysis of the structural MR images. Moreover, given that the morphological changes due to pathological process do not occur at isolated regions &#91;15&#93;, most current approaches group the discriminative voxels in irregular regions, using them to characterize the brain changes. </font></p>     <p><font size="2" face="Verdana, Arial, Helvetica, sans-serif">Fan <i>et al.</i> &#91;15&#93; proposed the COMPARE (Classification Of Morphological Patterns using Adaptive Regional Elements) method for classification of structural MR images, by combining a deformation-based morphometry approximation together with Support Vector Machines (SVM). The tissue probability maps, extracted for each subject using the RAVENS method &#91;18&#93;, are further segmented with a watershed-based algorithm according to a discrimination measure between neighboring voxels. This measure results from the combination of the Pearson correlation measure between the tissue density value at each voxel and its classification label, together with a spatial consistency value. Those voxels with similar values in the discrimination measure are grouped in regions by using a volume increment algorithm. Finally, an SVM model is trained with a feature vector composed of the mean tissue density values per selected regions, leading to discrimination between schizophrenia patients and healthy controls. The reported results show an average precision of around 90%, a high figure which is  very likely the result of the conditions used, i.e. a very homogeneous group since  patients in early stages of the disease were not considered when building the evaluation dataset. This approach has been widely used as a diagnostic tool in other neurodegenerative diseases &#91;17,19,20&#93;, however, some disadvantages include the high computational cost for the region extraction process and the use of proprietary methods for the generation of the tissue probability maps.</font></p>     <p><font size="2" face="Verdana, Arial, Helvetica, sans-serif">On the other hand, statistical parametric mapping (SPM) and voxel-based morphometry (VBM) have currently become standard tools for neuronal degeneration studies. Some recent approaches use a combination of SPM and SVM for pathological classification of brain volumes. Costafreda <i>et al.</i> &#91;16&#93; propose to apply ANOVA (ANalysis Of VAriance) filters to the tissue density maps obtained with SPM to select those regions of maximum difference between depressed patients and healthy controls, which are then used to predict both the diagnostic classification as well as the clinical response to antidepressant medicines. A t-Student test can be applied afterwards to the gray matter density maps to extract specific regions suitable for classification of Alzheimer's disease patients. In a similar approach, Savio <i>et al.</i> &#91;21&#93; uses groups of voxels extracted with VBM for identification of Alzheimer's disease in MR images. Three different descriptors were evaluated: proportion of gray matter, mean and standard deviation of VBM groups, and the intensity values of all voxels segmented as gray matter. Best performance is obtained with statistical measures of the extracted regions.</font></p>     <p>&nbsp;</p>     ]]></body>
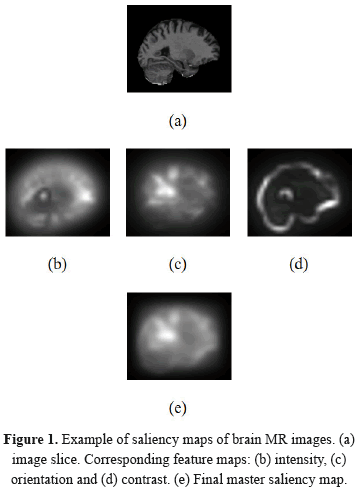
<body><![CDATA[<p><font size="3" face="Verdana, Arial, Helvetica, sans-serif"><b>3.  PROPOSED APPROACH</b></font></p>     <p><font size="2" face="Verdana, Arial, Helvetica, sans-serif">The proposed approach for classification of brain MR images can be roughly divided in two main steps: a learning or training process, which is performed only once, and the classification procedure, which takes place each time a new image arrives to be classified. All training and testing images are processed using a state--of-the-art visual saliency method &#91;9&#93;, to identify salient regions based on common low-level features such as intensity, orientation and edges. Then, a support vector machine (SVM) is trained using an image kernel defined over the visual saliency maps. The model learned is used for further classification of normal and pathological volumes.</font></p>     <p><font size="2" face="Verdana, Arial, Helvetica, sans-serif"><b>3.1.  Visual Saliency Maps</b>    <br>   </font><font size="2" face="Verdana, Arial, Helvetica, sans-serif">Calculation of saliency maps on volumetric MR brain images can be performed by applying a visual attention method on each 2D slice, following the acquisition orientation, given that the in-plane resolution is usually more detailed. Our aim is to model anatomical changes related with functional disturbances that result in local and global morphological alterations. This problem is equivalent to finding preferential information fluxes among a net of nodes belonging to a fully-connected graph and has been successfully solved as the well known PageRank algorithm &#91;22&#93;. On the other hand, radiologists usually analyze images by looking at distinctively regions and comparing them in terms of dissimilarity measures &#91;23&#93;. There exist different approaches to calculate the image saliency in natural images, but none of them has been applied to medical images. The Graph-Based Visual Saliency (GBVS) approach, proposed by Harel <i>et al.</i> &#91;9&#93;, includes a semantic notion of dissimilarity between pixels as well as a straight manner of calculating saliency values as the equilibrium distribution of Markov Chains defined on a scaled version of the original image which is modelled as a fully-connected graph. An analysis on the low-level characteristics was herein performed to adapt the saliency approach to MR images, including edges as one of the relevant features.</font></p>     <p><font size="2" face="Verdana, Arial, Helvetica, sans-serif">Calculation of saliency maps depends on first computing some feature maps. For MR images, the features selected  were intensity, orientation and edges (extracted using the Sobel operator), because they are oriented to give insights about shape distortions. With these, feature maps are calculated at different image scales. Subsequently, a fully-connected graph is defined on each feature map, where edges store information of dissimilarity between nodes (image pixels) plus their closeness (modeled using a Gaussian function with <font face="Symbol">s</font>=15% of image width). Then, activation maps are estimated by constructing a Markov Chain of the graph and calculating its equilibrium distribution as the principal eigenvector of the transition matrix, using the Power Iteration Method. Once the activation maps are computed, the same Markovian approach is applied to normalize each one, and then, per each feature channel all scale maps were summed up and finally all these are combined into the master saliency map. In the combination step, the saliency maps can be weighted by feature to give more or less </font></p>     <p><img src="/img/revistas/dyna/v80n178/v80n178a03eq000.gif"><font size="2" face="Verdana, Arial, Helvetica, sans-serif">&nbsp;</font></p>     <p><font size="2" face="Verdana, Arial, Helvetica, sans-serif">importance to each feature, however, we have chosen to assign the same weight to all feature maps. </font></p>     <p><font size="2" face="Verdana, Arial, Helvetica, sans-serif">As an example, <a href="#fig01">Figure 1</a> presents a slice of the obtained maps per feature (intensity, orientation and contrast) for a given brain MR image, and the corresponding master saliency map obtained for this image. In all saliency maps, values range from 0 (black) to 255 (white), the brighter the pixel, the more salient it is. The size of salient regions is controlled by the <i><font face="Symbol">s</font></i> parameter in the closeness function between image pixels.</font></p>     <p align="center"><font size="2" face="Verdana, Arial, Helvetica, sans-serif"><a name="fig01"></a></font><img src="/img/revistas/dyna/v80n178/v80n178a03fig01.gif"></p>     <p><font size="2" face="Verdana, Arial, Helvetica, sans-serif"><b>3.2. Classification using SVM    ]]></body>
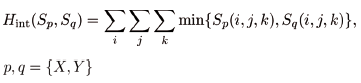
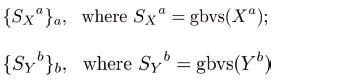
<body><![CDATA[<br>   </b></font><font size="2" face="Verdana, Arial, Helvetica, sans-serif">The SVM is a supervised learning method commonly used for two-class classification problems. It is based on using a nonlinear mapping of each element to a high dimensional feature space, where a linear surface can be placed to separate the elements of the two classes. A kernel function implicitly defines a nonlinear mapping from the input space to a feature space.</font></p>     <p><font size="2" face="Verdana, Arial, Helvetica, sans-serif">In our approach, the two classes were AD (Alzheimer's disease) or NC (normal control), and the elements to be classified correspond to the 3D saliency maps of each training subject, calculated in the previous step by stacking the 2D saliency maps from each individual slice in the volume. Let <i>{X<sup>a</sup>}<sub>a</sub>, a = 1, ... , n</i> be the set of images of the class <i>X</i> and <i>{Y<sup>b</sup>}<sub>b</sub>, b = 1, ... , m</i> the set of images from class <i>Y</i>. The saliency maps per image are obtained by </font></p>     <p><font size="2" face="Verdana, Arial, Helvetica, sans-serif"><img src="/img/revistas/dyna/v80n178/v80n178a03eq001.gif">&nbsp;</font></p>     <p><font size="2" face="Verdana, Arial, Helvetica, sans-serif">&nbsp;Two different precomputed kernels were used for SVM classification, based on two different measures: Jaccard overlapping coefficient and histogram intersection1. For overlapping computations, the saliency maps are binarized using a threshold <i>T<sub>h</sub>=200</i></font></p>     <p><font size="2" face="Verdana, Arial, Helvetica, sans-serif">&nbsp;</font><img src="/img/revistas/dyna/v80n178/v80n178a03eq002.gif"></p>     <p><font size="2" face="Verdana, Arial, Helvetica, sans-serif">,and then are compared with the following formula </font></p>     <p><font size="2" face="Verdana, Arial, Helvetica, sans-serif">&nbsp;</font><img src="/img/revistas/dyna/v80n178/v80n178a03eq003.gif"></p>     <p><font size="2" face="Verdana, Arial, Helvetica, sans-serif">where <i>B<sub>p</sub></i> and <i>B<sub>q</sub></i> are two different binary saliency maps. With histogram intersection, thresholding is not needed, but the original saliency maps are first normalized (to resemble a histogram) and then compared following</font></p>     <p><img src="/img/revistas/dyna/v80n178/v80n178a03eq004.gif"></p>     <p><font size="2" face="Verdana, Arial, Helvetica, sans-serif">With these two measures, precomputed kernel matrices are constructed by one-to-one comparison of training subjects, obtaining values between 0 (no overlapping or intersection) and 1 (complete overlapping or intersection). The precomputed kernels fed a SVM classifier, and an initial cross-validation procedure is performed in order to adjust the value of the penalty parameter <i>C</i>. Finally, with the optimal <i>C</i>, the final classification of test subjects is performed.</font></p>     ]]></body>

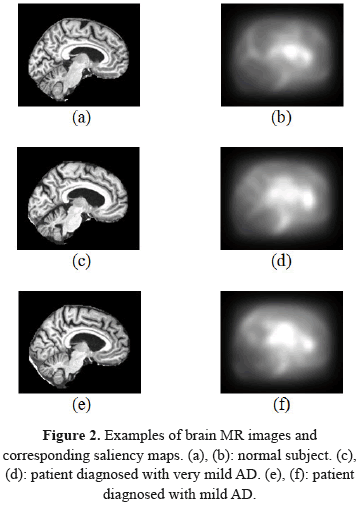
<body><![CDATA[<p>&nbsp;</p>     <p><font size="3" face="Verdana, Arial, Helvetica, sans-serif"><b>4.  PRELIMINARY RESULTS </b></font></p>     <p><font size="2" face="Verdana, Arial, Helvetica, sans-serif">A set of 198 brain MR images from healthy (98) and pathological (100) subjects, extracted from the OASIS (Open Access Series of Imaging Studies) database &#91;10&#93;, were used to preliminary evaluate the performance of the proposed approach. Each subject has been previously analyzed with a Mini-Mental State Examination (MMSE) and a Clinical Dementia Rating (CDR), and diagnosed as normal controls (NC) or with probable Alzheimer's disease (AD) using the scores obtained in the MMSE and CDR tests. The OASIS database provides a number of images per subject, from which we have selected the skull-stripped gain-field corrected atlas-registered image to the 1988 atlas space of Talairach and Tournoux &#91;24&#93;. To help comparison of the proposed approach with other classifiers tested on the same dataset &#91;8, 25&#93;, results are reported in four different divisions: </font></p> <ul>       <li><font size="2" face="Verdana, Arial, Helvetica, sans-serif">Group 1: 86 subjects aged 60-80 years, mild AD      (CDR = 1): 20 AD, 66 NC </font></li>       <li><font size="2" face="Verdana, Arial, Helvetica, sans-serif">Group 2: 126 subjects aged 60-96 years, mild AD (CDR = 1 ): 28 AD, 98 NC </font></li>       <li><font size="2" face="Verdana, Arial, Helvetica, sans-serif">Group 3: 136 subjects aged 60-80 years, mild and very mild AD (CDR = {1,0.5}): 70 AD, 66 NC </font></li>       <li><font size="2" face="Verdana, Arial, Helvetica, sans-serif">Group 4: 198 subjects aged 60-96 years, moderate, mild and very mild AD (CDR = {2,1,0.5}): 100 AD, 98 NC </font></li>     </ul>     <p><font size="2" face="Verdana, Arial, Helvetica, sans-serif">As pointed out by Toews <i>et al.</i> in &#91;8&#93;, analysis of classification performance must take into account the clinical and demographic information of subjects in the dataset, given that is more difficult to discriminate between elderly normal and pathological subjects, or between healthy subjects and patients with very mild AD. The four dataset divisions are proposed to illustrate the influence of these aspects. <a href="#fig02">Figure 2</a> also illustrates these difficulties, by showing a slice of three different volumes: one from a normal subject, another from a patient diagnosed with very mild AD, and the last from a patient diagnosed with mild AD. At the structural images, it is not easy to establish if the differences are due to the disease or to anatomical variability, however, the corresponding slice of the saliency maps (at the right of each structural slice), reveals slightly differentiation patterns that may help the classification.</font></p>     <p align="center"><font size="2" face="Verdana, Arial, Helvetica, sans-serif"><a name="fig02"></a></font><img src="/img/revistas/dyna/v80n178/v80n178a03fig02.gif"></p>     ]]></body>
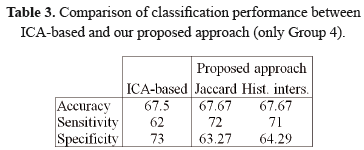
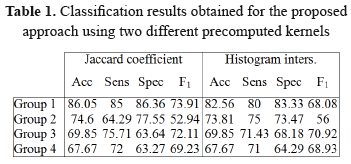
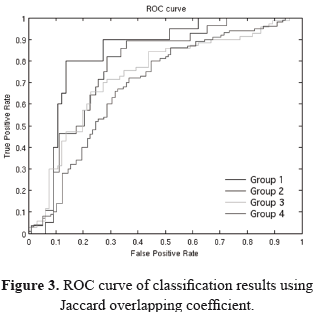
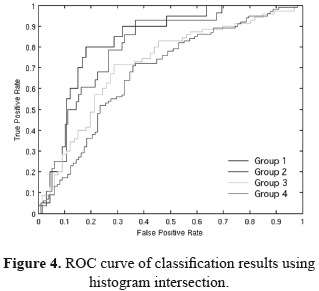
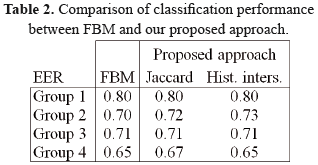
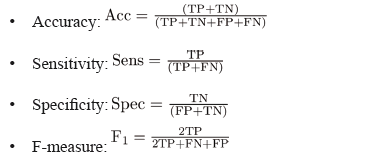
<body><![CDATA[<p><font size="2" face="Verdana, Arial, Helvetica, sans-serif">Classification of each group is performed in a leave-one-out manner, where one subject at a time is left out and then classified using the SVM model trained on the remaining subjects. Classification performance was validated using the following metrics: </font></p>     <p><img src="/img/revistas/dyna/v80n178/v80n178a03eq005.gif"></p>     <p><font size="2" face="Verdana, Arial, Helvetica, sans-serif">where TP stands for true positives (AD individuals correctly classified), TN for true negatives (NC individuals correctly classified), FP for false positives (NC individuals misclassified) and FN for false negatives (AD individuals misclassified). <a href="#tab01">Table 1</a> presents the values obtained for accuracy, sensitivity, specificity and F-measure for each classification group, and <a href="#fig03">Figures 3</a> and <a href="#fig04">4</a> presents the receiver operating characteristic (ROC) curves obtained for each measure.</font></p>     <p align="center"><font size="2" face="Verdana, Arial, Helvetica, sans-serif"><a name="tab01"></a></font><img src="/img/revistas/dyna/v80n178/v80n178a03tab01.gif"></p>     <p align="center"><font size="2" face="Verdana, Arial, Helvetica, sans-serif"><a name="fig03"></a></font><img src="/img/revistas/dyna/v80n178/v80n178a03fig03.gif"></p>     <p align="center"><font size="2" face="Verdana, Arial, Helvetica, sans-serif"><a name="fig04"></a></font><img src="/img/revistas/dyna/v80n178/v80n178a03fig04.gif"></p>     <p><font size="2" face="Verdana, Arial, Helvetica, sans-serif">From these experiments, it can be noted that classification performance is reduced when elderly subjects and/or very mild AD cases are included, as reported also in &#91;8&#93;. In terms of the two measures used in the calculation of precomputed kernels for SVM classification, the Jaccard overlapping coefficient seems to deliver slightly better results than the histogram intersection measure; however, the performance obtained using Jaccard coefficient depends on the chosen threshold value <i>T<sub>h</sub></i>, while in histogram intersection no such parameter is needed.</font></p>     <p><font size="2" face="Verdana, Arial, Helvetica, sans-serif">The proposed approach can be compared with previous works that report classification performance over the OASIS dataset. The first work was the FBM framework proposed by Toews <i>et al.</i> &#91;8&#93;. They report classification results over the 4 different groups using the Equal Error Rate (EER), a measure defined as the classification rate where misclassification rates for AD/NC subjects are equal. <a href="#tab02">Table 2</a> compares the EER values obtained with our two different measures and the values reported in &#91;8&#93; for the same classification groups. It can be noticed that our proposal has the same performance, and even outperforms the FBM framework in the groups that includes elderly subjects. </font></p>     <p align="center"><font size="2" face="Verdana, Arial, Helvetica, sans-serif"><a name="tab02"></a></font><img src="/img/revistas/dyna/v80n178/v80n178a03tab02.gif"></p>     <p><font size="2" face="Verdana, Arial, Helvetica, sans-serif">The second work was an ICA-based automatic classification proposed by Yang <i>et al.</i> &#91;25&#93;, which combines an independent component analysis (ICA) over the brain volumes with an SVM in order to discriminate between AD patients and NC. The comparison was made between 4 groups extracted from the OASIS dataset, separated according to age, where the only one that agrees with the experimental groups proposed here is the Group 4. <a href="#tab03">Table 3</a> presents the accuracy, sensitivity and specificity obtained for our results compared with those reported in &#91;25&#93; for Group 4. It is important to note that specificity and sensitivity in the ICA-based proposal were calculated with formulas different from the standard definition, so the difference is noticeable.</font></p>     ]]></body>
<body><![CDATA[<p align="center"><font size="2" face="Verdana, Arial, Helvetica, sans-serif"><a name="tab03"></a></font><img src="/img/revistas/dyna/v80n178/v80n178a03tab03.gif"></p>     <p>&nbsp;</p>     <p><font size="3" face="Verdana, Arial, Helvetica, sans-serif"><b>5.  CONCLUSION </b></font></p>     <p><font size="2" face="Verdana, Arial, Helvetica, sans-serif">In this paper a strategy for characterization of group differences from brain MR images based on saliency maps was proposed, implemented and evaluated. This strategy provides a subject classification into normal control or Alzheimer disease patients, based on support vector machines, which was compared with the diagnosis previously given by expert radiologists. Saliency maps allow us to identify regions of relative change in intensity, orientation and edges, associated with each class (demented or non-demented), describing basic regional patterns suitable for subject classification. </font></p>     <p><font size="2" face="Verdana, Arial, Helvetica, sans-serif">Two different measures were tested for the construction of the image kernel for SVM classification: the overlap of binarized saliency maps, and the histogram intersection of saliency maps. The threshold <i>T<sub>h</sub>=200</i> used for binarization have been selected after testing with different values: larger values produces smaller binary saliency regions, making it difficult to establish correspondence and overlap between the images; while with smaller values, the obtained saliency regions are bigger, and therefore the particular differences between classes are no longer evident. Using histogram intersection, influence of the thresholding parameter in the obtained results is avoided, without penalizing negatively the classification accuracy.</font></p>     <p><font size="2" face="Verdana, Arial, Helvetica, sans-serif">The proposed approach was evaluated over 198 normal and pathological subjects on the OASIS dataset in terms of standard classification measures, demonstrating promising accuracy results and showing good performance when compared with other methods that report classification results over the same dataset. Future work includes performing an extensive validation with other brain MR image datasets that include patients suffering other AD-related pathologies such as Mild Cognitive Impairment, to test the influence and importance of the selected features in the final saliency map and to include other image features such as other kinds of edge detectors.</font></p>     <p>&nbsp;</p>     <p><font size="3" face="Verdana, Arial, Helvetica, sans-serif"><b>ACKNOWLEDGMENT</b></font></p>     <p><font size="2" face="Verdana, Arial, Helvetica, sans-serif">This work has been supported by project &quot;Visual Attention Models and Sparse Representations for Morphometrical Image Analysis&quot; (number 12108) funded by Universidad Nacional de Colombia through &quot;Apoyo de la DIB a tesis de investigaci&oacute;n en posgrados&quot;; and partially funded by projects &quot;Anotaci&oacute;n Autom&aacute;tica y Recuperaci&oacute;n por Contenido de Im&aacute;genes Radiol&oacute;gicas usando Sem&aacute;ntica Latente&quot; (number 110152128803) and &quot;Sistema para la Recuperaci&oacute;n de Im&aacute;genes M&eacute;dicas utilizando Indexaci&oacute;n Multimodal&quot; (number 110152128767) by Convocatoria Colciencias 521 de 2010.</font></p>     <p>&nbsp;</p>     ]]></body>
<body><![CDATA[<p><font size="3" face="Verdana, Arial, Helvetica, sans-serif"><b>REFERENCES</b></font></p>     <!-- ref --><p><font size="2" face="Verdana, Arial, Helvetica, sans-serif"><b>&#91;1&#93;</b> Dequardo, J.R., Keshavan, M.S., Bookstein, F.L., Bagwell, W.W., Green, W.D.K., Sweeney, J.A., Haas, G.L., Tandon, R., Schooler, N.R. and Pettegrew, J.W., &quot;Landmark-based morphometric analysis of first-episode schizophrenia&quot;. Biol Psychiat, vol. 45, no. 10, pp. 1321-1328, 1999.    &nbsp;&nbsp;&nbsp;&nbsp;&nbsp;&nbsp;&nbsp;&nbsp;[&#160;<a href="javascript:void(0);" onclick="javascript: window.open('/scielo.php?script=sci_nlinks&ref=000084&pid=S0012-7353201300020000300001&lng=','','width=640,height=500,resizable=yes,scrollbars=1,menubar=yes,');">Links</a>&#160;]<!-- end-ref --><!-- ref --><br>   <b>&#91;2&#93;</b> Ashburner, J. and Friston, K.J., &quot;Voxel-based morphometry-the methods&quot;. Neuroimage, vol. 11, (6), pp. 805-821, 2000.    &nbsp;&nbsp;&nbsp;&nbsp;&nbsp;&nbsp;&nbsp;&nbsp;[&#160;<a href="javascript:void(0);" onclick="javascript: window.open('/scielo.php?script=sci_nlinks&ref=000085&pid=S0012-7353201300020000300002&lng=','','width=640,height=500,resizable=yes,scrollbars=1,menubar=yes,');">Links</a>&#160;]<!-- end-ref --><!-- ref --><br>   <b>&#91;3&#93;</b> Ashburner, J., Hutton, C., Frackowiak, R., Johnsrude, I., Price, C. and Friston, K., &quot;Identifying global anatomical differences: deformation-based morphometry&quot;. Hum Brain Mapp, vol. 6, (5-6), pp. 348-357, 1998.    &nbsp;&nbsp;&nbsp;&nbsp;&nbsp;&nbsp;&nbsp;&nbsp;[&#160;<a href="javascript:void(0);" onclick="javascript: window.open('/scielo.php?script=sci_nlinks&ref=000086&pid=S0012-7353201300020000300003&lng=','','width=640,height=500,resizable=yes,scrollbars=1,menubar=yes,');">Links</a>&#160;]<!-- end-ref --><!-- ref --><br>   <b>&#91;4&#93;</b> Pantazis, D., Leahy, R.M., Nichols, T.E. AND Styner, M., &quot;Statistical surface-based morphometry using a nonparametric approach&quot;. Proceedings of ISBI IEEE, 2004, pp. 1283-1286.    &nbsp;&nbsp;&nbsp;&nbsp;&nbsp;&nbsp;&nbsp;&nbsp;[&#160;<a href="javascript:void(0);" onclick="javascript: window.open('/scielo.php?script=sci_nlinks&ref=000087&pid=S0012-7353201300020000300004&lng=','','width=640,height=500,resizable=yes,scrollbars=1,menubar=yes,');">Links</a>&#160;]<!-- end-ref --><!-- ref --><br>   <b>&#91;5&#93;</b> Blezek, D.J. and Miller, J.V., &quot;Atlas stratification&quot;. Med Image Anal, vol. 11, (5), pp. 443-457, 2007.    &nbsp;&nbsp;&nbsp;&nbsp;&nbsp;&nbsp;&nbsp;&nbsp;[&#160;<a href="javascript:void(0);" onclick="javascript: window.open('/scielo.php?script=sci_nlinks&ref=000088&pid=S0012-7353201300020000300005&lng=','','width=640,height=500,resizable=yes,scrollbars=1,menubar=yes,');">Links</a>&#160;]<!-- end-ref --><!-- ref --><br>   <b>&#91;6&#93;</b> Klein, A. and Hirsch, J., &quot;Mindboggle: a scatterbrained approach to automate brain labeling&quot;. NeuroImage, vol. 24, (2), pp. 261-280, 2005.    &nbsp;&nbsp;&nbsp;&nbsp;&nbsp;&nbsp;&nbsp;&nbsp;[&#160;<a href="javascript:void(0);" onclick="javascript: window.open('/scielo.php?script=sci_nlinks&ref=000089&pid=S0012-7353201300020000300006&lng=','','width=640,height=500,resizable=yes,scrollbars=1,menubar=yes,');">Links</a>&#160;]<!-- end-ref --><!-- ref --><br>   <b>&#91;7&#93;</b> Baloch, S., Verma, R. and Davatzikos, C., &quot;An anatomical equivalence class based joint transformation-residual descriptor for morphological analysis&quot;. Proceedings of IPMI. Springer-Verlag, pp. 594-606. 2007.    &nbsp;&nbsp;&nbsp;&nbsp;&nbsp;&nbsp;&nbsp;&nbsp;[&#160;<a href="javascript:void(0);" onclick="javascript: window.open('/scielo.php?script=sci_nlinks&ref=000090&pid=S0012-7353201300020000300007&lng=','','width=640,height=500,resizable=yes,scrollbars=1,menubar=yes,');">Links</a>&#160;]<!-- end-ref --><!-- ref --><br>   <b>&#91;8&#93;</b> Toews, M., Wells III, W., Collins, D.L. and Arbel, T., &quot;Feature-based morphometry: Discovering group-related anatomical patterns&quot;. NeuroImage, vol. 49, (3), pp. 2318-2327, 2010.    &nbsp;&nbsp;&nbsp;&nbsp;&nbsp;&nbsp;&nbsp;&nbsp;[&#160;<a href="javascript:void(0);" onclick="javascript: window.open('/scielo.php?script=sci_nlinks&ref=000091&pid=S0012-7353201300020000300008&lng=','','width=640,height=500,resizable=yes,scrollbars=1,menubar=yes,');">Links</a>&#160;]<!-- end-ref --><!-- ref --><br>   <b>&#91;9&#93;</b> Harel, J., Koch, C. and Perona, P., &quot;Graph-based visual saliency&quot;. Advan Neural Inf, vol. 19, pp. 545, 2007.    &nbsp;&nbsp;&nbsp;&nbsp;&nbsp;&nbsp;&nbsp;&nbsp;[&#160;<a href="javascript:void(0);" onclick="javascript: window.open('/scielo.php?script=sci_nlinks&ref=000092&pid=S0012-7353201300020000300009&lng=','','width=640,height=500,resizable=yes,scrollbars=1,menubar=yes,');">Links</a>&#160;]<!-- end-ref --><!-- ref --><br>   <b>&#91;10&#93;</b> Marcus, D.S., Wang, T.H., Parker, J., Csernansky, J.G., Morris, J.C. and Buckner, R.L., &quot;Open Access Series of Imaging Studies (OASIS): cross-sectional MRI data in young, middle aged, nondemented, and demented older adults&quot;. J Cognitive Neurosci, vol. 19,(9), pp. 1498-1507, 2007.    &nbsp;&nbsp;&nbsp;&nbsp;&nbsp;&nbsp;&nbsp;&nbsp;[&#160;<a href="javascript:void(0);" onclick="javascript: window.open('/scielo.php?script=sci_nlinks&ref=000093&pid=S0012-7353201300020000300010&lng=','','width=640,height=500,resizable=yes,scrollbars=1,menubar=yes,');">Links</a>&#160;]<!-- end-ref --><!-- ref --><br>   <b>&#91;11&#93;</b> Wang, J., De Haan, G., Unay, D., Soldea, O. and Ekin, A., Voxel-based Discriminant Map Classification on Brain Ventricles for Alzheimers Disease. In: Proceedings of SPIE; 2009.    &nbsp;&nbsp;&nbsp;&nbsp;&nbsp;&nbsp;&nbsp;&nbsp;[&#160;<a href="javascript:void(0);" onclick="javascript: window.open('/scielo.php?script=sci_nlinks&ref=000094&pid=S0012-7353201300020000300011&lng=','','width=640,height=500,resizable=yes,scrollbars=1,menubar=yes,');">Links</a>&#160;]<!-- end-ref --><!-- ref --><br>   <b>&#91;12&#93;</b> Hua, X., Leow, A.D., Parikshak, N., Lee, S., Chiang, M.C., Toga, A.W. <i>et al.</i> Tensor-based morphometry as a neuroimaging biomarker for Alzheimer's disease: An MRI study of 676 AD, MCI, and normal subjects. NeuroImage.;47, pp. 1476-1486. 2008    &nbsp;&nbsp;&nbsp;&nbsp;&nbsp;&nbsp;&nbsp;&nbsp;[&#160;<a href="javascript:void(0);" onclick="javascript: window.open('/scielo.php?script=sci_nlinks&ref=000095&pid=S0012-7353201300020000300012&lng=','','width=640,height=500,resizable=yes,scrollbars=1,menubar=yes,');">Links</a>&#160;]<!-- end-ref --><!-- ref --><br>   <b>&#91;13&#93;</b> Gerardin, E., Chetelat, G., Chupin, M., Cuingnet, R., Desgranges, B., Kim, H.S. <i>et al.</i> Multidimensional classification of hippocampal shape features discriminates Alzheimer's disease and mild cognitive impairment from normal aging. NeuroImage.; 47, pp. 1476-1486. 2009.    &nbsp;&nbsp;&nbsp;&nbsp;&nbsp;&nbsp;&nbsp;&nbsp;[&#160;<a href="javascript:void(0);" onclick="javascript: window.open('/scielo.php?script=sci_nlinks&ref=000096&pid=S0012-7353201300020000300013&lng=','','width=640,height=500,resizable=yes,scrollbars=1,menubar=yes,');">Links</a>&#160;]<!-- end-ref --><!-- ref --><br>   <b>&#91;14&#93;</b> Magnin, B., Mesrob, L., Kinkingnhun, S., Plgrini-issac, M., Colliot, O., Sarazin, M. <i>et al.</i> Support vector machine-based classification of Alzheimers disease from whole-brain anatomical MRI. Neuroradiology, 51, pp.73-83. 2009    &nbsp;&nbsp;&nbsp;&nbsp;&nbsp;&nbsp;&nbsp;&nbsp;[&#160;<a href="javascript:void(0);" onclick="javascript: window.open('/scielo.php?script=sci_nlinks&ref=000097&pid=S0012-7353201300020000300014&lng=','','width=640,height=500,resizable=yes,scrollbars=1,menubar=yes,');">Links</a>&#160;]<!-- end-ref --><!-- ref --><br>   <b>&#91;15&#93;</b> Fan, Y., Shen, D., Gur, R.C., Gur, R.E. and Davatzikos, C., Compare: Classification of Morphological Patterns Using Adaptive Regional Elements. IEEE Transactions on Medical Imaging, 26 pp. 93-105. 2007.    &nbsp;&nbsp;&nbsp;&nbsp;&nbsp;&nbsp;&nbsp;&nbsp;[&#160;<a href="javascript:void(0);" onclick="javascript: window.open('/scielo.php?script=sci_nlinks&ref=000098&pid=S0012-7353201300020000300015&lng=','','width=640,height=500,resizable=yes,scrollbars=1,menubar=yes,');">Links</a>&#160;]<!-- end-ref --><!-- ref --><br>   <b>&#91;16&#93;</b> Costafreda, S.G., Chu, C., Ashburner, J. and FU, CH.Y., Prognostic and Diagnostic Potential of the Structural Neuroanatomy of Depression. PLOS One, 4. 2009    &nbsp;&nbsp;&nbsp;&nbsp;&nbsp;&nbsp;&nbsp;&nbsp;[&#160;<a href="javascript:void(0);" onclick="javascript: window.open('/scielo.php?script=sci_nlinks&ref=000099&pid=S0012-7353201300020000300016&lng=','','width=640,height=500,resizable=yes,scrollbars=1,menubar=yes,');">Links</a>&#160;]<!-- end-ref --><!-- ref --><br>   <b>&#91;17&#93;</b> Misra, C., Fan, Y. and Davatzikos, C., Baseline and longitudinal patterns of brain atrophy in MCI patients, and their use in prediction of short-term conversion to AD: Results from ADNI. NeuroImage.;44, pp. 1415-1422. 2009    &nbsp;&nbsp;&nbsp;&nbsp;&nbsp;&nbsp;&nbsp;&nbsp;[&#160;<a href="javascript:void(0);" onclick="javascript: window.open('/scielo.php?script=sci_nlinks&ref=000100&pid=S0012-7353201300020000300017&lng=','','width=640,height=500,resizable=yes,scrollbars=1,menubar=yes,');">Links</a>&#160;]<!-- end-ref --><!-- ref --><br>   <b>&#91;18&#93;</b> Davatzikos, C., Genc, A., Xu, D. and Resnick, S.M., Voxel-Based Morphometry Using the RAVENS Maps: Methods and Validation Using Simulated Longitudinal Atrophy. NeuroImage,14, pp.1361-1369. 2001.    &nbsp;&nbsp;&nbsp;&nbsp;&nbsp;&nbsp;&nbsp;&nbsp;[&#160;<a href="javascript:void(0);" onclick="javascript: window.open('/scielo.php?script=sci_nlinks&ref=000101&pid=S0012-7353201300020000300018&lng=','','width=640,height=500,resizable=yes,scrollbars=1,menubar=yes,');">Links</a>&#160;]<!-- end-ref --><!-- ref --><br>   <b>&#91;19&#93;</b> Davatzikos, C., Fan, Y., Wu, X., Shen, D. and Resnick, S.M., Detection of prodromal Alzheimer's disease via pattern classification of magnetic resonance imaging. Neurobiology of Aging. 2008.    &nbsp;&nbsp;&nbsp;&nbsp;&nbsp;&nbsp;&nbsp;&nbsp;[&#160;<a href="javascript:void(0);" onclick="javascript: window.open('/scielo.php?script=sci_nlinks&ref=000102&pid=S0012-7353201300020000300019&lng=','','width=640,height=500,resizable=yes,scrollbars=1,menubar=yes,');">Links</a>&#160;]<!-- end-ref --><!-- ref --><br>   <b>&#91;20&#93;</b> Fan, Y., Batmanghelich, N., Clark, C.M. and Davatzikos, C., Spatial patterns of brain atrophy in MCI patients, identified via high-dimensional pattern classification, predict subsequent cognitive decline. NeuroImage,39. 2008    &nbsp;&nbsp;&nbsp;&nbsp;&nbsp;&nbsp;&nbsp;&nbsp;[&#160;<a href="javascript:void(0);" onclick="javascript: window.open('/scielo.php?script=sci_nlinks&ref=000103&pid=S0012-7353201300020000300020&lng=','','width=640,height=500,resizable=yes,scrollbars=1,menubar=yes,');">Links</a>&#160;]<!-- end-ref --><!-- ref --><br>   <b>&#91;21&#93;</b> Savio, A., Garc&iacute;a-Sebasti&aacute;n, M., Gra&ntilde;a, M. and Villan&uacute;a, J., Results of an Adaboost Approach on Alzheimers Disease Detection on MRI. In: Proceedings of the 3rd International Work-Conference on The Interplay Between Natural and Artificial Computation: Part II: Bioinspired Applications in Artificial and Natural Computation; 2009.    &nbsp;&nbsp;&nbsp;&nbsp;&nbsp;&nbsp;&nbsp;&nbsp;[&#160;<a href="javascript:void(0);" onclick="javascript: window.open('/scielo.php?script=sci_nlinks&ref=000104&pid=S0012-7353201300020000300021&lng=','','width=640,height=500,resizable=yes,scrollbars=1,menubar=yes,');">Links</a>&#160;]<!-- end-ref --><!-- ref --><br>   <b>&#91;22&#93;</b> Page, L., Brin, S., Motwani, R. and Winograd, T., &quot;The PageRank citation ranking: Bringing order to the web&quot;. 1999.    &nbsp;&nbsp;&nbsp;&nbsp;&nbsp;&nbsp;&nbsp;&nbsp;[&#160;<a href="javascript:void(0);" onclick="javascript: window.open('/scielo.php?script=sci_nlinks&ref=000105&pid=S0012-7353201300020000300022&lng=','','width=640,height=500,resizable=yes,scrollbars=1,menubar=yes,');">Links</a>&#160;]<!-- end-ref --><!-- ref --><br>   <b>&#91;23&#93;</b> Beutel, J., Handbook of Medical Imaging: Physics and Psychophysics. Vol. 1, SPIE Press, 2000.    &nbsp;&nbsp;&nbsp;&nbsp;&nbsp;&nbsp;&nbsp;&nbsp;[&#160;<a href="javascript:void(0);" onclick="javascript: window.open('/scielo.php?script=sci_nlinks&ref=000106&pid=S0012-7353201300020000300023&lng=','','width=640,height=500,resizable=yes,scrollbars=1,menubar=yes,');">Links</a>&#160;]<!-- end-ref --><!-- ref --><br>   <b>&#91;24&#93;</b> Buckner, R.L., Head, D., Parker, J., Fotenos, A.F., Marcus, D., Morris, J.C. and Snyder, A.Z., &quot;A unified approach for morphometric and functional data analysis in young, old, and demented adults using automated atlas-based head size normalization: reliability and validation against manual measurement of total intracranial volume&quot;. NeuroImage, vol. 23, (2), pp. 724-738, 2004.    &nbsp;&nbsp;&nbsp;&nbsp;&nbsp;&nbsp;&nbsp;&nbsp;[&#160;<a href="javascript:void(0);" onclick="javascript: window.open('/scielo.php?script=sci_nlinks&ref=000107&pid=S0012-7353201300020000300024&lng=','','width=640,height=500,resizable=yes,scrollbars=1,menubar=yes,');">Links</a>&#160;]<!-- end-ref --><!-- ref --><br>   <b>&#91;25&#93;</b> Yang, W., Xia, H., Xia, B., Lui, L.M., and Huang, X., &quot;ICA-based feature extraction and automatic classification of AD-related MRI data&quot;. Proceedings of ICNC IEEE, vol. 3, pp. 1261-1265.    &nbsp;&nbsp;&nbsp;&nbsp;&nbsp;&nbsp;&nbsp;&nbsp;[&#160;<a href="javascript:void(0);" onclick="javascript: window.open('/scielo.php?script=sci_nlinks&ref=000108&pid=S0012-7353201300020000300025&lng=','','width=640,height=500,resizable=yes,scrollbars=1,menubar=yes,');">Links</a>&#160;]<!-- end-ref --><br>   </font></p>      ]]></body><back>
<ref-list>
<ref id="B1">
<label>1</label><nlm-citation citation-type="journal">
<person-group person-group-type="author">
<name>
<surname><![CDATA[Dequardo]]></surname>
<given-names><![CDATA[J.R.]]></given-names>
</name>
<name>
<surname><![CDATA[Keshavan]]></surname>
<given-names><![CDATA[M.S.]]></given-names>
</name>
<name>
<surname><![CDATA[Bookstein]]></surname>
<given-names><![CDATA[F.L.]]></given-names>
</name>
<name>
<surname><![CDATA[Bagwell]]></surname>
<given-names><![CDATA[W.W.]]></given-names>
</name>
<name>
<surname><![CDATA[Green]]></surname>
<given-names><![CDATA[W.D.K.]]></given-names>
</name>
<name>
<surname><![CDATA[Sweeney]]></surname>
<given-names><![CDATA[J.A.]]></given-names>
</name>
<name>
<surname><![CDATA[Haas]]></surname>
<given-names><![CDATA[G.L.]]></given-names>
</name>
<name>
<surname><![CDATA[Tandon]]></surname>
<given-names><![CDATA[R.]]></given-names>
</name>
<name>
<surname><![CDATA[Schooler]]></surname>
<given-names><![CDATA[N.R.]]></given-names>
</name>
<name>
<surname><![CDATA[Pettegrew]]></surname>
<given-names><![CDATA[J.W.]]></given-names>
</name>
</person-group>
<article-title xml:lang="en"><![CDATA[Landmark-based morphometric analysis of first-episode schizophrenia]]></article-title>
<source><![CDATA[Biol Psychiat]]></source>
<year>1999</year>
<volume>45</volume>
<numero>10</numero>
<issue>10</issue>
<page-range>1321-1328</page-range></nlm-citation>
</ref>
<ref id="B2">
<label>2</label><nlm-citation citation-type="journal">
<person-group person-group-type="author">
<name>
<surname><![CDATA[Ashburner]]></surname>
<given-names><![CDATA[J.]]></given-names>
</name>
<name>
<surname><![CDATA[Friston]]></surname>
<given-names><![CDATA[K.J.]]></given-names>
</name>
</person-group>
<article-title xml:lang="en"><![CDATA[Voxel-based morphometry-the methods]]></article-title>
<source><![CDATA[Neuroimage]]></source>
<year>2000</year>
<volume>11</volume>
<numero>6</numero>
<issue>6</issue>
<page-range>805-821</page-range></nlm-citation>
</ref>
<ref id="B3">
<label>3</label><nlm-citation citation-type="journal">
<person-group person-group-type="author">
<name>
<surname><![CDATA[Ashburner]]></surname>
<given-names><![CDATA[J.]]></given-names>
</name>
<name>
<surname><![CDATA[Hutton]]></surname>
<given-names><![CDATA[C.]]></given-names>
</name>
<name>
<surname><![CDATA[Frackowiak]]></surname>
<given-names><![CDATA[R.]]></given-names>
</name>
<name>
<surname><![CDATA[Johnsrude]]></surname>
<given-names><![CDATA[I.]]></given-names>
</name>
<name>
<surname><![CDATA[Price]]></surname>
<given-names><![CDATA[C.]]></given-names>
</name>
<name>
<surname><![CDATA[Friston]]></surname>
<given-names><![CDATA[K.]]></given-names>
</name>
</person-group>
<article-title xml:lang="en"><![CDATA[Identifying global anatomical differences: deformation-based morphometry]]></article-title>
<source><![CDATA[Hum Brain Mapp]]></source>
<year>1998</year>
<volume>6</volume>
<numero>5-6</numero>
<issue>5-6</issue>
<page-range>348-357</page-range></nlm-citation>
</ref>
<ref id="B4">
<label>4</label><nlm-citation citation-type="confpro">
<person-group person-group-type="author">
<name>
<surname><![CDATA[Pantazis]]></surname>
<given-names><![CDATA[D.]]></given-names>
</name>
<name>
<surname><![CDATA[Leahy]]></surname>
<given-names><![CDATA[R.M.]]></given-names>
</name>
<name>
<surname><![CDATA[Nichols]]></surname>
<given-names><![CDATA[T.E.]]></given-names>
</name>
<name>
<surname><![CDATA[Styner]]></surname>
<given-names><![CDATA[M.]]></given-names>
</name>
</person-group>
<article-title xml:lang="en"><![CDATA[Statistical surface-based morphometry using a nonparametric approach]]></article-title>
<source><![CDATA[]]></source>
<year></year>
<conf-name><![CDATA[ ISBI IEEE]]></conf-name>
<conf-date>2004</conf-date>
<conf-loc> </conf-loc>
</nlm-citation>
</ref>
<ref id="B5">
<label>5</label><nlm-citation citation-type="journal">
<person-group person-group-type="author">
<name>
<surname><![CDATA[Blezek]]></surname>
<given-names><![CDATA[D.J.]]></given-names>
</name>
<name>
<surname><![CDATA[Miller]]></surname>
<given-names><![CDATA[J.V.]]></given-names>
</name>
</person-group>
<article-title xml:lang="en"><![CDATA[Atlas stratification]]></article-title>
<source><![CDATA[Med Image Anal]]></source>
<year>2007</year>
<volume>11</volume>
<numero>5</numero>
<issue>5</issue>
<page-range>443-457</page-range></nlm-citation>
</ref>
<ref id="B6">
<label>6</label><nlm-citation citation-type="journal">
<person-group person-group-type="author">
<name>
<surname><![CDATA[Klein]]></surname>
<given-names><![CDATA[A.]]></given-names>
</name>
<name>
<surname><![CDATA[Hirsch]]></surname>
<given-names><![CDATA[J.]]></given-names>
</name>
</person-group>
<article-title xml:lang="en"><![CDATA[Mindboggle: a scatterbrained approach to automate brain labeling]]></article-title>
<source><![CDATA[NeuroImage]]></source>
<year>2005</year>
<volume>24</volume>
<numero>2</numero>
<issue>2</issue>
<page-range>261-280</page-range></nlm-citation>
</ref>
<ref id="B7">
<label>7</label><nlm-citation citation-type="confpro">
<person-group person-group-type="author">
<name>
<surname><![CDATA[Baloch]]></surname>
<given-names><![CDATA[S.]]></given-names>
</name>
<name>
<surname><![CDATA[Verma]]></surname>
<given-names><![CDATA[R.]]></given-names>
</name>
<name>
<surname><![CDATA[Davatzikos]]></surname>
<given-names><![CDATA[C.]]></given-names>
</name>
</person-group>
<article-title xml:lang="en"><![CDATA[An anatomical equivalence class based joint transformation-residual descriptor for morphological analysis]]></article-title>
<source><![CDATA[]]></source>
<year>2007</year>
<conf-name><![CDATA[ IPMI]]></conf-name>
<conf-loc> </conf-loc>
<page-range>594-606</page-range><publisher-name><![CDATA[Springer-Verlag]]></publisher-name>
</nlm-citation>
</ref>
<ref id="B8">
<label>8</label><nlm-citation citation-type="journal">
<person-group person-group-type="author">
<name>
<surname><![CDATA[Toews]]></surname>
<given-names><![CDATA[M.]]></given-names>
</name>
<name>
<surname><![CDATA[Wells III]]></surname>
<given-names><![CDATA[W.]]></given-names>
</name>
<name>
<surname><![CDATA[Collins]]></surname>
<given-names><![CDATA[D.L.]]></given-names>
</name>
<name>
<surname><![CDATA[Arbel]]></surname>
<given-names><![CDATA[T.]]></given-names>
</name>
</person-group>
<article-title xml:lang="en"><![CDATA[Feature-based morphometry: Discovering group-related anatomical patterns]]></article-title>
<source><![CDATA[NeuroImage]]></source>
<year>2010</year>
<volume>49</volume>
<numero>3</numero>
<issue>3</issue>
<page-range>2318-2327</page-range></nlm-citation>
</ref>
<ref id="B9">
<label>9</label><nlm-citation citation-type="journal">
<person-group person-group-type="author">
<name>
<surname><![CDATA[Harel]]></surname>
<given-names><![CDATA[J.]]></given-names>
</name>
<name>
<surname><![CDATA[Koch]]></surname>
<given-names><![CDATA[C.]]></given-names>
</name>
<name>
<surname><![CDATA[Perona]]></surname>
<given-names><![CDATA[P.]]></given-names>
</name>
</person-group>
<article-title xml:lang="en"><![CDATA[Graph-based visual saliency]]></article-title>
<source><![CDATA[Advan Neural Inf]]></source>
<year>2007</year>
<volume>19</volume>
<page-range>545</page-range></nlm-citation>
</ref>
<ref id="B10">
<label>10</label><nlm-citation citation-type="journal">
<person-group person-group-type="author">
<name>
<surname><![CDATA[Marcus]]></surname>
<given-names><![CDATA[D.S.]]></given-names>
</name>
<name>
<surname><![CDATA[Wang]]></surname>
<given-names><![CDATA[T.H.]]></given-names>
</name>
<name>
<surname><![CDATA[Parker]]></surname>
<given-names><![CDATA[J.]]></given-names>
</name>
<name>
<surname><![CDATA[Csernansky]]></surname>
<given-names><![CDATA[J.G.]]></given-names>
</name>
<name>
<surname><![CDATA[Morris]]></surname>
<given-names><![CDATA[J.C.]]></given-names>
</name>
<name>
<surname><![CDATA[Buckner]]></surname>
<given-names><![CDATA[R.L.]]></given-names>
</name>
</person-group>
<article-title xml:lang="en"><![CDATA[Open Access Series of Imaging Studies (OASIS): cross-sectional MRI data in young, middle aged, nondemented, and demented older adults]]></article-title>
<source><![CDATA[J Cognitive Neurosci]]></source>
<year>2007</year>
<volume>19</volume>
<numero>9</numero>
<issue>9</issue>
<page-range>1498-1507</page-range></nlm-citation>
</ref>
<ref id="B11">
<label>11</label><nlm-citation citation-type="confpro">
<person-group person-group-type="author">
<name>
<surname><![CDATA[Wang]]></surname>
<given-names><![CDATA[J.]]></given-names>
</name>
<name>
<surname><![CDATA[De Haan]]></surname>
<given-names><![CDATA[G.]]></given-names>
</name>
<name>
<surname><![CDATA[Unay]]></surname>
<given-names><![CDATA[D.]]></given-names>
</name>
<name>
<surname><![CDATA[Soldea]]></surname>
<given-names><![CDATA[O.]]></given-names>
</name>
<name>
<surname><![CDATA[Ekin]]></surname>
<given-names><![CDATA[A.]]></given-names>
</name>
</person-group>
<article-title xml:lang="en"><![CDATA[Voxel-based Discriminant Map Classification on Brain Ventricles for Alzheimers Disease]]></article-title>
<source><![CDATA[]]></source>
<year></year>
<conf-name><![CDATA[ SPIE]]></conf-name>
<conf-date>2009</conf-date>
<conf-loc> </conf-loc>
</nlm-citation>
</ref>
<ref id="B12">
<label>12</label><nlm-citation citation-type="journal">
<person-group person-group-type="author">
<name>
<surname><![CDATA[Hua]]></surname>
<given-names><![CDATA[X.]]></given-names>
</name>
<name>
<surname><![CDATA[Leow]]></surname>
<given-names><![CDATA[A.D.]]></given-names>
</name>
<name>
<surname><![CDATA[Parikshak]]></surname>
<given-names><![CDATA[N.]]></given-names>
</name>
<name>
<surname><![CDATA[Lee]]></surname>
<given-names><![CDATA[S.]]></given-names>
</name>
<name>
<surname><![CDATA[Chiang]]></surname>
<given-names><![CDATA[M.C.]]></given-names>
</name>
<name>
<surname><![CDATA[Toga]]></surname>
<given-names><![CDATA[A.W.]]></given-names>
</name>
</person-group>
<article-title xml:lang="en"><![CDATA[Tensor-based morphometry as a neuroimaging biomarker for Alzheimer's disease: An MRI study of 676 AD, MCI, and normal subjects]]></article-title>
<source><![CDATA[NeuroImage]]></source>
<year>2008</year>
<numero>47</numero>
<issue>47</issue>
<page-range>1476-1486</page-range></nlm-citation>
</ref>
<ref id="B13">
<label>13</label><nlm-citation citation-type="journal">
<person-group person-group-type="author">
<name>
<surname><![CDATA[Gerardin]]></surname>
<given-names><![CDATA[E.]]></given-names>
</name>
<name>
<surname><![CDATA[Chetelat]]></surname>
<given-names><![CDATA[G.]]></given-names>
</name>
<name>
<surname><![CDATA[Chupin]]></surname>
<given-names><![CDATA[M.]]></given-names>
</name>
<name>
<surname><![CDATA[Cuingnet]]></surname>
<given-names><![CDATA[R.]]></given-names>
</name>
<name>
<surname><![CDATA[Desgranges]]></surname>
<given-names><![CDATA[B.]]></given-names>
</name>
<name>
<surname><![CDATA[Kim]]></surname>
<given-names><![CDATA[H.S.]]></given-names>
</name>
</person-group>
<article-title xml:lang="en"><![CDATA[Multidimensional classification of hippocampal shape features discriminates Alzheimer's disease and mild cognitive impairment from normal aging]]></article-title>
<source><![CDATA[NeuroImage]]></source>
<year>2009</year>
<numero>47</numero>
<issue>47</issue>
<page-range>1476-1486</page-range></nlm-citation>
</ref>
<ref id="B14">
<label>14</label><nlm-citation citation-type="journal">
<person-group person-group-type="author">
<name>
<surname><![CDATA[Magnin]]></surname>
<given-names><![CDATA[B.]]></given-names>
</name>
<name>
<surname><![CDATA[Mesrob]]></surname>
<given-names><![CDATA[L.]]></given-names>
</name>
<name>
<surname><![CDATA[Kinkingnhun]]></surname>
<given-names><![CDATA[S.]]></given-names>
</name>
<name>
<surname><![CDATA[Plgrini-issac]]></surname>
<given-names><![CDATA[M.]]></given-names>
</name>
<name>
<surname><![CDATA[Colliot]]></surname>
<given-names><![CDATA[O.]]></given-names>
</name>
<name>
<surname><![CDATA[Sarazin]]></surname>
<given-names><![CDATA[M.]]></given-names>
</name>
</person-group>
<article-title xml:lang="en"><![CDATA[port vector machine-based classification of Alzheimers disease from whole-brain anatomical MRI]]></article-title>
<source><![CDATA[Neuroradiology]]></source>
<year>2009</year>
<numero>51</numero>
<issue>51</issue>
<page-range>73-83</page-range></nlm-citation>
</ref>
<ref id="B15">
<label>15</label><nlm-citation citation-type="journal">
<person-group person-group-type="author">
<name>
<surname><![CDATA[Fan]]></surname>
<given-names><![CDATA[Y.]]></given-names>
</name>
<name>
<surname><![CDATA[Shen]]></surname>
<given-names><![CDATA[D.]]></given-names>
</name>
<name>
<surname><![CDATA[Gur]]></surname>
<given-names><![CDATA[R.C.]]></given-names>
</name>
<name>
<surname><![CDATA[Gur]]></surname>
<given-names><![CDATA[R.E.]]></given-names>
</name>
<name>
<surname><![CDATA[Davatzikos]]></surname>
<given-names><![CDATA[C.]]></given-names>
</name>
</person-group>
<article-title xml:lang="en"><![CDATA[Compare: Classification of Morphological Patterns Using Adaptive Regional Elements]]></article-title>
<source><![CDATA[IEEE Transactions on Medical Imaging]]></source>
<year>2007</year>
<numero>26</numero>
<issue>26</issue>
<page-range>93-105</page-range></nlm-citation>
</ref>
<ref id="B16">
<label>16</label><nlm-citation citation-type="journal">
<person-group person-group-type="author">
<name>
<surname><![CDATA[Costafreda]]></surname>
<given-names><![CDATA[S.G.]]></given-names>
</name>
<name>
<surname><![CDATA[Chu]]></surname>
<given-names><![CDATA[C.]]></given-names>
</name>
<name>
<surname><![CDATA[Ashburner]]></surname>
<given-names><![CDATA[J.]]></given-names>
</name>
<name>
<surname><![CDATA[FU]]></surname>
<given-names><![CDATA[CH.Y.]]></given-names>
</name>
</person-group>
<article-title xml:lang="en"><![CDATA[Prognostic and Diagnostic Potential of the Structural Neuroanatomy of Depression]]></article-title>
<source><![CDATA[PLOS One]]></source>
<year>2009</year>
<numero>4</numero>
<issue>4</issue>
</nlm-citation>
</ref>
<ref id="B17">
<label>17</label><nlm-citation citation-type="journal">
<person-group person-group-type="author">
<name>
<surname><![CDATA[Misra]]></surname>
<given-names><![CDATA[C.]]></given-names>
</name>
<name>
<surname><![CDATA[Fan]]></surname>
<given-names><![CDATA[Y.]]></given-names>
</name>
<name>
<surname><![CDATA[Davatzikos]]></surname>
<given-names><![CDATA[C.]]></given-names>
</name>
</person-group>
<article-title xml:lang="en"><![CDATA[Baseline and longitudinal patterns of brain atrophy in MCI patients, and their use in prediction of short-term conversion to AD: Results from ADNI]]></article-title>
<source><![CDATA[NeuroImage]]></source>
<year>2009</year>
<numero>44</numero>
<issue>44</issue>
<page-range>1415-1422</page-range></nlm-citation>
</ref>
<ref id="B18">
<label>18</label><nlm-citation citation-type="journal">
<person-group person-group-type="author">
<name>
<surname><![CDATA[Davatzikos]]></surname>
<given-names><![CDATA[C.]]></given-names>
</name>
<name>
<surname><![CDATA[Genc]]></surname>
<given-names><![CDATA[A.]]></given-names>
</name>
<name>
<surname><![CDATA[Xu]]></surname>
<given-names><![CDATA[D.]]></given-names>
</name>
<name>
<surname><![CDATA[Resnick]]></surname>
<given-names><![CDATA[S.M.]]></given-names>
</name>
</person-group>
<article-title xml:lang="en"><![CDATA[Voxel-Based Morphometry Using the RAVENS Maps: Methods and Validation Using Simulated Longitudinal Atrophy]]></article-title>
<source><![CDATA[NeuroImage]]></source>
<year>2001</year>
<numero>14</numero>
<issue>14</issue>
<page-range>1361-1369</page-range></nlm-citation>
</ref>
<ref id="B19">
<label>19</label><nlm-citation citation-type="journal">
<person-group person-group-type="author">
<name>
<surname><![CDATA[Davatzikos]]></surname>
<given-names><![CDATA[C.]]></given-names>
</name>
<name>
<surname><![CDATA[Fan]]></surname>
<given-names><![CDATA[Y.]]></given-names>
</name>
<name>
<surname><![CDATA[Wu]]></surname>
<given-names><![CDATA[X.]]></given-names>
</name>
<name>
<surname><![CDATA[Shen]]></surname>
<given-names><![CDATA[D.]]></given-names>
</name>
<name>
<surname><![CDATA[Resnick]]></surname>
<given-names><![CDATA[S.M.]]></given-names>
</name>
</person-group>
<article-title xml:lang="en"><![CDATA[Detection of prodromal Alzheimer's disease via pattern classification of magnetic resonance imaging]]></article-title>
<source><![CDATA[Neurobiology of Aging]]></source>
<year>2008</year>
</nlm-citation>
</ref>
<ref id="B20">
<label>20</label><nlm-citation citation-type="journal">
<person-group person-group-type="author">
<name>
<surname><![CDATA[Fan]]></surname>
<given-names><![CDATA[Y.]]></given-names>
</name>
<name>
<surname><![CDATA[Batmanghelich]]></surname>
<given-names><![CDATA[N.]]></given-names>
</name>
<name>
<surname><![CDATA[Clark]]></surname>
<given-names><![CDATA[C.M.]]></given-names>
</name>
<name>
<surname><![CDATA[Davatzikos]]></surname>
<given-names><![CDATA[C.]]></given-names>
</name>
</person-group>
<article-title xml:lang="en"><![CDATA[Spatial patterns of brain atrophy in MCI patients, identified via high-dimensional pattern classification, predict subsequent cognitive decline]]></article-title>
<source><![CDATA[NeuroImage]]></source>
<year>2008</year>
<numero>39</numero>
<issue>39</issue>
</nlm-citation>
</ref>
<ref id="B21">
<label>21</label><nlm-citation citation-type="confpro">
<person-group person-group-type="author">
<name>
<surname><![CDATA[Savio]]></surname>
<given-names><![CDATA[A.]]></given-names>
</name>
<name>
<surname><![CDATA[García-Sebastián]]></surname>
<given-names><![CDATA[M.]]></given-names>
</name>
<name>
<surname><![CDATA[Graña]]></surname>
<given-names><![CDATA[M.]]></given-names>
</name>
<name>
<surname><![CDATA[Villanúa]]></surname>
<given-names><![CDATA[J.]]></given-names>
</name>
</person-group>
<article-title xml:lang="en"><![CDATA[Results of an Adaboost Approach on Alzheimers Disease Detection on MRI]]></article-title>
<source><![CDATA[]]></source>
<year></year>
<conf-name><![CDATA[3rd International Work-Conference on The Interplay Between Natural and Artificial Computation: Part II: Bioinspired Applications in Artificial and Natural Computation]]></conf-name>
<conf-date>2009</conf-date>
<conf-loc> </conf-loc>
</nlm-citation>
</ref>
<ref id="B22">
<label>22</label><nlm-citation citation-type="">
<person-group person-group-type="author">
<name>
<surname><![CDATA[Page]]></surname>
<given-names><![CDATA[L.]]></given-names>
</name>
<name>
<surname><![CDATA[Brin]]></surname>
<given-names><![CDATA[S.]]></given-names>
</name>
<name>
<surname><![CDATA[Motwani]]></surname>
<given-names><![CDATA[R.]]></given-names>
</name>
<name>
<surname><![CDATA[Winograd]]></surname>
<given-names><![CDATA[T.]]></given-names>
</name>
</person-group>
<source><![CDATA[The PageRank citation ranking: Bringing order to the web]]></source>
<year>1999</year>
</nlm-citation>
</ref>
<ref id="B23">
<label>23</label><nlm-citation citation-type="book">
<person-group person-group-type="author">
<name>
<surname><![CDATA[Beutel]]></surname>
<given-names><![CDATA[J.]]></given-names>
</name>
</person-group>
<source><![CDATA[Handbook of Medical Imaging: Physics and Psychophysics]]></source>
<year>2000</year>
<volume>1</volume>
<publisher-name><![CDATA[SPIE Press]]></publisher-name>
</nlm-citation>
</ref>
<ref id="B24">
<label>24</label><nlm-citation citation-type="journal">
<person-group person-group-type="author">
<name>
<surname><![CDATA[Buckner]]></surname>
<given-names><![CDATA[R.L.]]></given-names>
</name>
<name>
<surname><![CDATA[Head]]></surname>
<given-names><![CDATA[D.]]></given-names>
</name>
<name>
<surname><![CDATA[Parker]]></surname>
<given-names><![CDATA[J.]]></given-names>
</name>
<name>
<surname><![CDATA[Fotenos]]></surname>
<given-names><![CDATA[A.F.]]></given-names>
</name>
<name>
<surname><![CDATA[Marcus]]></surname>
<given-names><![CDATA[D.]]></given-names>
</name>
<name>
<surname><![CDATA[Morris]]></surname>
<given-names><![CDATA[J.C.]]></given-names>
</name>
<name>
<surname><![CDATA[Snyder]]></surname>
<given-names><![CDATA[A.Z.]]></given-names>
</name>
</person-group>
<article-title xml:lang="en"><![CDATA[A unified approach for morphometric and functional data analysis in young, old, and demented adults using automated atlas-based head size normalization: reliability and validation against manual measurement of total intracranial volume]]></article-title>
<source><![CDATA[NeuroImage]]></source>
<year>2004</year>
<volume>23</volume>
<numero>2</numero>
<issue>2</issue>
<page-range>724-738</page-range></nlm-citation>
</ref>
<ref id="B25">
<label>25</label><nlm-citation citation-type="confpro">
<person-group person-group-type="author">
<name>
<surname><![CDATA[Yang]]></surname>
<given-names><![CDATA[W.]]></given-names>
</name>
<name>
<surname><![CDATA[Xia]]></surname>
<given-names><![CDATA[H.]]></given-names>
</name>
<name>
<surname><![CDATA[Xia]]></surname>
<given-names><![CDATA[B.]]></given-names>
</name>
<name>
<surname><![CDATA[Lui]]></surname>
<given-names><![CDATA[L.M.]]></given-names>
</name>
<name>
<surname><![CDATA[Huang]]></surname>
<given-names><![CDATA[X.]]></given-names>
</name>
</person-group>
<article-title xml:lang="en"><![CDATA[ICA-based feature extraction and automatic classification of AD-related MRI data]]></article-title>
<source><![CDATA[]]></source>
<year></year>
<volume>3</volume>
<conf-name><![CDATA[ ICNC IEEE]]></conf-name>
<conf-loc> </conf-loc>
<page-range>1261-1265</page-range></nlm-citation>
</ref>
</ref-list>
</back>
</article>