


 English (pdf)
 Article in xml format
 Article references
 Send this article by e-mail
 Cited by SciELO
  Cited by Google
  Similars in
SciELO
Similars in
SciELO  Similars in Google
 Permalink
1. Introduction
In competitive industries, manufacturers explore strategies to improve product quality, decrease quality variability, increase system reliability, and lower costs [1]. Variability in product quality and performance is a major engineering problem arising from irregularities caused by errors [2].
Quality control (QC) plays a significant role in production processes and supply chain management [3,4]. It inherently enhances performance by verifying the standards of a product or service during its manufacturing process to reduce the probability of introducing defective products into the market.
QC makes it possible to evaluate system efficiency to identify what can be improved and what needs to be corrected. Typically, deviations and errors in product manufacturing arise from other processes that need to be detected and fixed.
Companies seek to prioritize quality improvement actions using methodologies such as quality function deployment (QFD). A QC system of predictive models based on cause-and-effect analyses validated by Monte Carlo simulation (MCS) can predict failures to improve product quality [5]. Therefore, it is necessary to calculate rejection probabilities to control these errors through analytical solutions [6].
Simulation is the process of building a logical-mathematical model of a system or decision process by conducting experiments to understand the system behavior or support decision-making. In addition, another important element in simulation processes is the identification of appropriate data probability distributions. Therefore, the main objective of simulation is to perform experiments with the model and analyze the results to improve decisions.
Decision problems are considered quality control schemes for which statistical procedures are developed, monitored, and compared. The authors of [7] mention that using the MCS method, it is possible to estimate the distribution properties when the process is under control and obtain a complete mapping for decision-making.
In project execution, decision-making is fundamental to the accomplishment of the organization’s objectives. Therefore, an approach to monitor and control projects under uncertainty is proposed in [8], where the use of MCS led to obtain a universe of possible project performances and to establish optimal control charts for decision-makers. In [9], the author states that as decision models surround MCS, it becomes more complex and widely used because the need to organize and share model components to achieve quality control increases.
There are multiple studies and techniques focused on controlling process quality; nevertheless, there is a gap in the development and implementation of flexible frameworks that use simulation to solve complex process and product quality control problems.
Improved simulation performance codes and proper prediction are crucial to increase decision accuracy and analysis quality, but they come at a high computational and monetary cost [10]. Consequently, this article develops a methodological framework for process quality control that integrates MCS to determine how variable product quality can be.
The methodological framework was implemented in a carbonated beverage process. The main contribution of this article is the development of a flexible framework that integrates MCS to solve complex engineering problems in the context of process quality control, thus favoring the prediction of behaviors and the detection and correction of errors within processes. The above, in turn, improves process quality and enhances decision-making processes.
2. Monte Carlo simulation
The main objective of simulation is to replicate the characteristics and behavior of a process to imitate operations through mathematical models. This makes it possible to solve mathematical problems that are complicated and even impossible to solve analytically [11].
MCS is carried out to identify the characteristic behavior related to the problem and to understand and predict its uncertainties, thus increasing decision-making reliability [12]. MCS provides control variables with expected numerical tolerance, given that the methods can also be employed to assess uncertainty in terms of measurement error [13]. To ensure quality and lower uncertainty, the authors of [14] mention that strict control of the parameters is mandatory.
The distortion in the working power curve is the result of the asymmetry in the distribution of analyte measurements. A version of the Westgard-Barry-Hunt-Groth multi-rule Quality Control System (QCS) was developed and subsequently analyzed by MCS in [15]; however, it did not meet the acceptance criteria of the Gaussian distribution of measurements.
In [16], the authors analyze the estimate of the time of the process change by studying the performance of the change point estimator using MCS, given that the delay in the generation of a control chart signal is related to biases. Methods for uncertainty assessment are complex and require measurement expertise and experience; therefore, a MCS methodology to implement and validate new easy-to-use strategies is presented in [17].
Traditional deterministic methods are not based on a full understanding of these inherent uncertainties, which may negatively affect the overall design performance [18]. In the case of coordinate measuring machines (CMMs), uncertainty assessment by MCS integrates various specific uncertainty influences into the process. Therefore, the authors of [19] proposed a method to determine uncertainties for CMM feature measurements, ensuring that it is impossible to control and obtain reliable quality without determining and monitoring the exact specification of the measurement uncertainty. Moreover, according to [20], measurement variability estimates can be analyzed from simulation results.
Diffusion-weighted imaging (DWI) presents problems that require stringent QC schemes to remove low-quality images. Therefore, an MCS-based method for the evaluation of tensor properties was proposed in [21], showing that the estimated bias can be different in magnitude and directional distribution.
In [22], the authors studied the applicability of the Bayesian control method by MCS. They sought to demonstrate the improvement of the multivariate Bayesian control chart, since it is believed that the decrease in false alarm rates is relevant to its economic optimization. Additionally, according to [23], simulation studies and applications in real industry cases enhance parameter assessment and quality control charts when the sets contain outliers.
In [24], the impact of imperfect ranking was evaluated by MCS, identifying which control charts perform best in most of the simulated scenarios, thus predicting the estimated results. Based on the results obtained, the authors of [25] concluded that, thanks to MCS, the intensity profile of the image can be used to determine the thickness of the sample accurately, also analyzing the variables that have a greater impact on them.
In decision-making, information on the behavior of constantly changing systems is essential. Accordingly, a micro-simulation model was proposed in [26], seeking to help decision-makers to consider possible scenarios and responses of the distribution system to different labor events.
For their part, the authors of [27] stated that non-normal data MCS allowed them to estimate the critical value to determine whether the process met the customers’ specifications, based on the extended process capability index. According to [28], MCS enabled them to identify the variables with the greatest impact on QC, evaluate the possible results, and reduce the probability of manufacturing products of lower quality than expected.
Likewise, based on MCS, the authors of [29] quantitatively demonstrated how dispersion can lead to drastic increases in sample size to maintain the desired study power. However, they are not usually considered. In [30], the authors explained that, thanks to MCS, they could demonstrate the necessary dose to rethink the current recommendations on drug stability, achieving a consensus on the subject.
In [31], an applicable model for cable simulation using the MCS method was proposed. The applicability of the model was proven by separating the energy spectra into components so that these proportions achieved an optimal overall understanding of the specifications. Similarly, the authors of [32] showed that the applied prototype system produces accurate and reliable metrics in a real environment in the application of QCS because, thanks to the implementation of MCS, the data interpretation burden of professionals could be reduced.
The adaptive resonance theory (ART) is a topic of great relevance in medicine. Consequently, the implementation of a QCS without modeling was proposed in [33] to analyze the performance of the ART neural network. A simplified Fuzzy ART neural algorithm was employed and subsequently studied by MCS, finding an optimal performance for the QCS throughout the simulation runs.
Comparing stochastic models with traditional models using MCS makes it possible to analyze the quality of processes and the impact on organizational systems [34]. As mentioned in [35], quantitative analysis models should be checked by addressing the factors related to the risk of failure and the sensitivity of the main variables.
The adoption of simulation models by quantitative analyses and real-time measurements improves the quality management support-decision process at the industrial level from tactical and operational perspectives [33]. Furthermore, the combination of MCS with methods such as the robust co-state sequence and the load-holding control mode show that the management strategies are efficient and meet the objectives [36].
Process errors can have an enormous impact in QC due to both biases and inaccuracies. As explained in [37], MCS models make it possible to predict the proportion of risk in response to measurement results at specific bias and inaccuracy values.
The success or failure of a pavement depends more on the accuracy of predictions than on the accuracy relative to traffic. The authors of [38] stated that MCS allowed them to explain the relationship between reliability and safety in the pavement design procedure for any level of variability in material properties and traffic.
3. Methodology
The Monte Carlo Simulation for Process Quality Control Framework (MCS-PQCF) methodology is based on the differential principle (1):
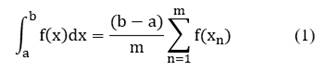
where a and b are the limits, and m is a finite parameter that increases as a function of the desired accuracy, allowing results to be predicted further in time with greater accuracy. Regardless of the tool used, the MCS-PQCF process involves the four essential stages shown in Fig. 1.
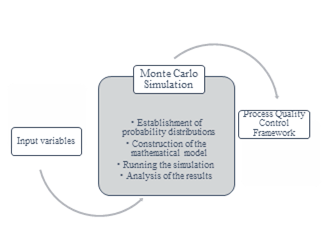
First, the variables of interest in the model that are thought to influence a phenomenon and are fundamental to explaining or predicting the results are defined. These variables are then correlated to understand the linear relationships between them, to assess the strength and direction of the relationships, to detect multicollinearity, and to establish the basis for further analysis. The assumptions of linearity, independence, homoscedasticity, normality and non-collinearity are validated to ensure the validity of the multiple linear regression model.
Next, probability distributions are determined to represent the uncertainty in the model input values, and based on these parameters, the multiple linear regression model is fed into the mathematical model:
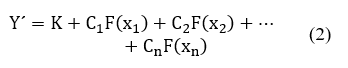
where K is a constant, C1 to Cn are the coefficients of the linear regression model, and x1 to xn are the random variables of previously determined probability distributions.
Then, simulations are run to assess how the variables variability affects the results of the proposed control model by repeatedly generating random values based on the probability distributions. Finally, analysis of the results allows validation of compliance with the MCS-PQCF for more informed decision-making, identification of risks and opportunities, assessment of sensitivity, validation of models, and effective communication of uncertainty to stakeholders.
The following section details the results of the application of the MCS-PQCF methodology. The software used was Microsoft Excel© and the Simulator 5.0 add-in.
4. Results
The quality of final system outputs depends on the intermediate characteristics and design parameters at each stage [39]. There is one quality characteristic that must be maintained to produce carbonated beverages with Brix syrup quality: the degrees Brix.
All variables have a target and can be measured; therefore, they are controllable. The input variable is the degrees Brix of the syrup (%); the process variables are the Carbo-Cooler temperature (°C), filler temperature (°C), filler speed (BPM), and refrigerant suction pressure (PSI); and the output variable of the model for the finished product is the degrees Brix of the beverage (%). The variables are represented by R, x1, x2, x3, and x4, respectively. An analysis of variables was conducted for the input variable, the process variables, and the quality characteristics, aiming to identify the correlation coefficients (Table 1).
Table 1 Correlation matrix.
| Origin variable | Destination variable | Correlation coefficient |
|---|---|---|
| R1 | X | 0 |
| R2 | X | 0.1218 |
| R2 | R1 | 0.1288 |
| R3 | X | -0.2181 |
| R3 | R1 | -0.2650 |
| R3 | R2 | -0.0596 |
| R4 | X | 0.1170 |
| R4 | R1 | -0.1309 |
| R4 | R2 | -0.0735 |
| R4 | R3 | 0.0943 |
| Y | X | 0.4976 |
| Y | R1 | -0.4300 |
| Y | R2 | -0.3383 |
| Y | R3 | 0.0693 |
| Y | R4 | 0.3151 |
Source: The authors.
Table 2 Identification of probability distributions.
| Variable | Distribution types and parameters |
| R | Beta (B): [0.0111; 0.0555; 52.2199; 55.2601] |
| x1 | Triangular - Double (TD): [0.9756; 1.4; 1.2; 0.8667] |
| x2 | Triangular (T): [4.2612; 4.6105; 4.5] |
| x3 | Binomial (Bin): [0.9948; 541] |
| x4 | Pascal (P): [0.981; 43] |
Source: The authors.
The detailed description of the distributions of the variables of interest is the main basis for controlling service and product quality [40]. The probability distributions, parameters, and behaviors of the process variables found for the application of the MCS-PQCF methodology are detailed in Table 2.
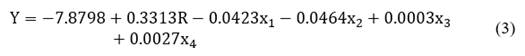
The distributions and parameters assigned to each process variable were replaced in (3), thus obtaining the mathematical model expressed in (4):
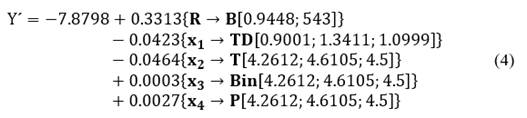
Based on the probability distributions and the mathematical model, 1,000 simulation runs were performed. Fig. 2 displays parameters such as frequency, run frequency accumulation, risk value, and confidence percentage to determine the effectiveness of the output characteristic.
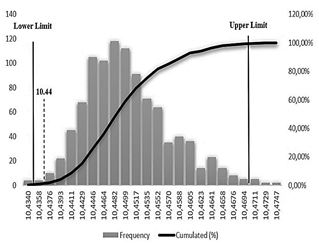
Source: The authors.
Figure 2 Histogram of the simulation results for the degrees Brix of the beverage.
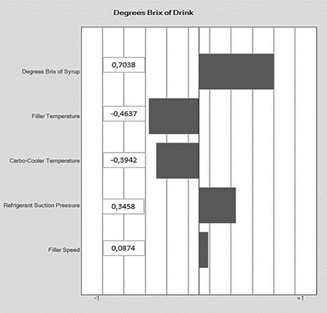
A sensitivity analysis was performed to obtain a satisfactory output prediction for the carbonated beverage process, to establish the uncertainties, limitations, and scope of the model and as means of studying the impact of the variations in one of the independent variables on a dependent variable.
Fig. 3 shows that the variables that most influence the degrees Brix of the beverage are the degrees Brix of the syrup and the suction pressure of the refrigerant. As the degrees Brix of the syrup increase, so do the degrees Brix of the beverage.
It is worth highlighting the importance of all the variables within the simulation model. However, some of them achieve a higher impact on the proposed quality characteristic, thus fulfilling the specifications of all the variables related to the model.
Table 3 Process quality control framework.
| Variable | Monitoring range | Optimum value |
| R | [55.21 ≤ 55.22 ≤ 55.26] | 55.22 |
| X1 | [0.97 ≤ 1 ≤ 1.03] | 1.0 |
| X2 | [2.99 ≤ 3 ≤ 3.01] | 3 |
| X3 | [534 ≤ 540 ≤ 547] | 540 |
| X4 | [43 ≤ 45 ≤ 47] | 45 |
| Y | [10.43 ≤ 10.45 ≤ 10.47] | 10.44 |
Source: The authors.
Finally, the QCS values correspond to the monitoring ranges and the expected value of the process variables (Table 3). It is noted that the optimum values of each variable are within the established monitoring range.
5. Conclusions
Quality control is essential to any process because it makes it possible to map and monitor production actions, thus eliminating errors, failures, or defects. Thanks to the mapping of the results obtained, decision-making is improved by the analysis and sensitivity study of the quality characteristics of the process. Given the study of the variables and probable outcomes, it was possible to determine how the values of an independent characteristic can affect a dependent one.
The MCS methodology achieves probabilistic solutions for equations where deterministic methods are not satisfactory due to a lack of precision in the input data. The MCS-PQCF methodology offers the possibility of performing risk analyses and creating new models of possible outcomes by permuting a range of values, being the probability distribution for any factor with inherent uncertainty. Sensitivity analyses allow industries to forecast the success or failure of their projects using reliable and accurate statistically-obtained data, based on the results of the MCS-PQCF methodology.
The main contribution of this study is the implementation of a lexicographic model using simulation tools. It is, therefore, an engineering procedure that can bring real benefits by introducing new knowledge, skills, and abilities into the field. The topic is relevant to Quality Engineering from an optimization perspective, which is key in the current context of the Fourth Industrial Revolution and AI.
This study is part of an ongoing research whose future work will focus on the application of the tool in other business sectors and the integration of multi-objective optimization tools, different simulation methods, and artificial intelligence. Moreover, additional variables will be incorporated into the model to determine the impact of various quality characteristics on the process.

