


![Validity and reliability of Spanish version of the EQ-i: YV[S] in Colombian children and youth](/img/en/next.gif)


 English (pdf)
 Article in xml format
 Article references
 Send this article by e-mail
 Cited by SciELO
  Cited by Google
  Similars in
SciELO
Similars in
SciELO  Similars in Google
 Permalink
1. Introduction
University sexual harassment is conceived in numerous ways. According to Bosch et al. (2012) and Pérez Guardo (2012), the concept originated in 1974 at Cornell University, as it was analyzed the working experiences of women with men, in order to understand how male behavior operated to deny the value of her contributions. Pérez and Rodríguez (2013) state that, in 1980, the Equal Employment Opportunity Commission of the United States (EEOC) defined sexual harassment as exclusively related to sexual behaviors, establishing two types of harassment: sexual coercion, or quid pro quo harassment, and harassment creating a hostile work environment. In addition, sexual harassment is designed to exercise power over women (Bosch et al., 2012). Nicholson et al. (1992) define sexual harassment in the academic environment as unwanted and unacceptable sexual advances, requests for sexual favors, and physical contact or verbal expressions that interfere with an individual’s work and/or academic performance, as well as attempts to create an intimidating, hostile, or offensive work or academic environment. According to Hirigoyen (2000), sexual harassment includes the use of authority to demand sexual satisfaction or the imposition of unwanted sexual requirements.
Based upon several debates around the concept of sexual harassment in the university environment, Guarderas et al. (2018) define the phenomenon as a verbal (written or oral), gestural or physical practice, sexual in nature, to which the person targeted has not consented and which they do not desire. Sexual harassment constitutes a type of gender violence and its purpose consists of the exercise of power and/or the sexual satisfaction of the aggressor, generating discomfort in and intimidating the person affected. This type of harassment occurs in different spheres of university life and interferes with the conditions in which people work and study in the academic world, creating an intimidating, hostile, or offensive space. Sexual harassment in a university context employs superiority based on institutional hierarchical relationships, but also based on gender inequities, sexual orientation, inequalities due to socio-economic conditions or ethnicity, and other aspects of social subordination (Guarderas et al., 2018; Larrea et al., 2020).
1.1 Assessment Tools for Sexual Harassment in the Academic Environment
The Sexual Experiences Questionnaire (SEQ) is one of the most widely used scales for assessing the incidence and prevalence of sexual harassment in organizations. It has been applied in studies carried out in companies, organizations, and universities, and translated into various languages. It is a self-reporting inventory that includes 17 behaviors grouped into three categories: a) gender harassment; b) unwanted sexual attention; and c) sexual coercion affecting employment benefits (Fitzgerald et al., 1995). This assessment tool contemplates two types of sexual harassment: sexual coercion, or quid pro quo, and behaviors that generate a hostile environment. The tool includes indicators demonstrating a high degree of internal consistency, with a Cronbach alpha of = .89 for the general scale as well as for gender harassment (α = .86), unwanted sexual attention (α = .75), and sexual coercion (α = .87) dimensions. A confirmatory factor analysis (CFA) confirmed the adjustment of the three factors model of the scale, χ 2 = 133.67; GFI = .983 and RMSR = .207 (Fitzgerald et al., 1995).
In colleges and universities in a Spanish-speaking context, there exists the sexual harassment and social interaction of sexual content scale (EASIS-U; Bosch et al., 2012). The scale is comprised of 38 items that describe sexual harassment, organized into four factors: a) sexual coercion (19 items); b) sexual harassment with a verbal component (6 items); c) sexual harassment with a physical component (7 items); and d) social interaction with sexual content in the university environment (6 items). Two studies carried out in Spanish universities have measured the properties of this scale (Ferrer-Pérez & Bosch-Fiol, 2014; Navarro-Guzmán et al., 2016) The internal consistency indicators of the EASIS-U scale’s four dimensions were satisfactory, with α = .96 for sexual blackmail, α = .87 for sexual harassment with a verbal component, α = .85 for sexual harassment with a physical component with 7 items, and α = .77 for the behaviors of social interaction with sexual content. Cronbach’s alpha coefficient in both studies was .95. The study and evaluation to establish the scale’s factor structure was carried out through exploratory factor analysis (EFA), using a principal component analysis with Varimax orthogonal rotation and a 61.82% explained variance (KMO = .953, p < .01). In this validation, a CFA was not used (Navarro-Guzmán et al., 2016).
Taken together, these studies are relevant in the construction of items and dimensions to measure the sexual harassment construct. However, they present at least four limitations in the formulation of factorial validity. First, according to critics, sexual harassment cannot be established solely through an EFA. Second, the use of orthogonal/varimax rotation requires assessing the presence of correlation among factors (Frías-Navarro & Pascual Soler, 2012), an aspect that was not mentioned in the studies. Third, principal components analysis has been used, though this is not an element usually present in an EFA (Costello & Osborne, 2005; Hair et al., 1999). Finally, internal consistency analyses are performed using Cronbach’s alpha index, though this tool does not provide the most accurate results in the measurement of categorical variables (Freiberg et al., 2013).
Consequently, at least three aspects arise for which the contribution of a scale that evaluates sexual harassment in the university environment is relevant. First, it is essential to complement the progressive conceptual advances around sexual harassment in the last decade, in particular, given that certain types of harassment reveal diverse behaviors and actors (Guarderas et al., 2018; Guarderas & Cuvi, 2020; Navarro-Guzmán et al., 2016). Second, many complaints of harassment have been made in the university context in Ecuador in recent years, which show the lack of research in Latin American contexts to address the phenomenon, prevent its naturalization, and enable care for the people involved (Guarderas et al., 2018; Guarderas & Cuvi, 2020; Karami et al., 2021). Finally, criteria must be established to measure the prevalence and types of sexual harassment, to influence public policies in higher education in Ecuador (SENECYT, 2017), and in the development of protocols and programs in different universities (Ranganathan et al., 2021).
Therefore, this research was planned to develop a scale to measure the prevalence of sexual harassment in the university environment in Ecuador. The objective was to provide an instrument with appropriate construct and content validity for evaluating sexual harassment in university spaces in the Spanish-speaking population. The required test must specify the different dimensions of the phenomenon identified in the field of higher education. This measure must consider the entire academic community, that is, teaching and administrative staff, as well as students. The scale was developed and validated with a panel of experts (Guarderas et al., 2018). Subsequently, a pilot sample of 542 people was carried out in five universities in three Ecuadorian cities, and this resulted in improvements in the formulation of questions (Larrea et al., 2020). This paper aims to analyze the construct validity and internal consistency reliability of a sexual harassment measurement scale in higher education institutions (ASIES).
2. Method
The present study is an instrumental or psychometric investigation (Ato et al., 2013) to identify the construct validity based on the relationship between items and factors, as well as the reliability of internal consistency. The sample consisted of 4628 people who study or work in 13 higher education centers located in six provinces of Ecuador. It included students, teachers, and administrative and service personnel legally registered in the institutions. Students enrolled from the third semester onwards; in face-to-face and blended learning modalities were considered. Those in the process of obtaining a degree and non-regular students were excluded. Meanwhile, in the case of teachers, administrative and service personnel, all forms of employment relationships were included; the only exclusion criterion being the absence of the person at the time the survey was applied. Of persons in the sample, 45.4% identify as male and 54.4% as female, while .2% place themselves in other gender categories. In addition, 95.1% describe their sexual preference as heterosexual and 4.9% describe other sexual preferences. Among the population sampled, 81.4% are students, 9% are teachers, and 9.6% are administrative and service personnel. The average number of years studying or working at the institution is 1.64 and 4.57, respectively. In terms of age, 61.4% of students are between 21 and 25 years old, 19.7% are between 18 and 20, and 18.9% are 26 or older. In addition, 41.5% are in the early semesters of their studies, 38.2% are in intermediate semesters, and 20.4% are in their final semesters. Among teachers, administrative, and service personnel, 56.6% are from 36 to 55 years old, 27% are 35 years old or younger, and 16.4% are 56 and older. In sociodemographic terms, 60.9% of the population identifies as middle class, 10.1% as upper-middle to upper class, and 29% in the low to middle-class categories. In ethnic terms, 91.4% identify as mestizo, 4.4% as indigenous, 1.6% as Afro-descendant, .7% as Montubio, and 1.9% as white or other. Of the total population, 29.6% have moved from what had been their home base while 16.5% have to commute to the institution at which they work or study.
For the class of students, astratified sampling (schools/ departments) and by clusters (year of studies to complete a degree) was applied, with proportional distribution by schools and academic levels; and for the levels of teachers and administrative and service personnel, a stratified sampling (schools/departments) and systematic distribution were applied.
The ASIES scale is a confidential, anonymous, and self-reporting instrument, which includes questions regarding sociodemographic aspects, health and personal repercussions, knowledge of protection norms and how the situations happened, and the scale of sexual harassment. The ASIES scale includes questions that measure 21 behaviors indicative of sexual harassment: six verbal behaviors; five non-verbal behaviors; four physical behaviors; six behaviors involving coercion (see Table 1). The answer options are “Never” (0), “Before, but not in the last year” (1), “1-3 times in the last year” (2), “4-10 times in the last year” (3), “More than 10 times in the last year” (4).
The project received approval (P2019-142M) from the Ethics Committee of the Universidad San Francisco de Quito. The research teams shared the link, and respondents read the informed consent document and, after agreeing to participate, opened the digital template to answer survey questions. Incomplete surveys were removed from the digital database and not included in the statistical analysis.
3. Data Analysis
The work was developed in three stages of analysis. The first stage involved a preliminary analysis of the items (see Table 1) to identify the dynamics of the responses among themselves. These analyses were carried out utilizing the arithmetic mean (M ), standard deviation (SD), skewness (g 1), and kurtosis (g 2). The assumption of univariate normality was examined; this occurs when g 1 and g 2 are within the 1.5 range (Ferrando & Anguiano-Carrasco, 2010). The assumption of multivariate normality is evaluated when the values of the Mardia test (1970) do not present statistical significance (p > .05).
Table 1 Descriptive analysis of the items of the ASIES scale and multivariate normality
| Items | M | SD | Skew | Kurtosis |
|---|---|---|---|---|
| 1 | .13 | .49 | 4.68 | 24.86 |
| 2 | .18 | .58 | 3.82 | 15.91 |
| 3 | .08 | .38 | 5.76 | 38.86 |
| 4 | .09 | .42 | 5.44 | 34.40 |
| 5 | .22 | .65 | 3.42 | 12.54 |
| 6 | .34 | .83 | 2.79 | 7.58 |
| 7 | .09 | .42 | 5.65 | 36.49 |
| 8 | .01 | .13 | 13.43 | 206.18 |
| 9 | .02 | .16 | 11.14 | 134.82 |
| 10 | .02 | .18 | 14.34 | 244.32 |
| 11 | .13 | .48 | 4.28 | 21.15 |
| 12 | .03 | .23 | 9.92 | 113.27 |
| 13 | .01 | .11 | 17.73 | 352.93 |
| 14 | .09 | .40 | 5.67 | 37.11 |
| 15 | .02 | .15 | 10.61 | 128.68 |
| 16 | .02 | .16 | 13.84 | 243.86 |
| 17 | .01 | .15 | 14.88 | 259.33 |
| 18 | .01 | .13 | 17.73 | 375.98 |
| 19 | .02 | .16 | 12.62 | 193.65 |
| 20 | .02 | .18 | 12.23 | 185.25 |
| 21 | .02 | .18 | 11.99 | 162.36 |
| Mardia | 2067758.5*** | 6463.3*** |
Note. ***p < .001; M: Mean; SD: Standard Deviation; g 1: Skewness; g 2: Kurtosis; r(ítem-total): item-total correlation analysis.
Construct validity is analyzed based on interrelationships among items (see Table 2), through analysis of the polychoric correlation matrix and the degree of relevance (>.2) or absence of redundancy (<.9), multicollinearity, that occurs among the items. Values outside of these criteria would be eliminated from further analyses. Another procedure involved factor analysis. Once this stage was over, we run an Exploratory Factor Analysis (EFA), dividing the sample and performing the analysis with 701 cases. In the EFA (see Table 3), we used the Kaiser-Meyer-Olkin (KMO) test to determine data suitability for EFA, which is expected to be superior to KMO>.8, and the Bartlett Sphericity Test, in which statistical significance is expected (p < .05). With the preliminary verification, we run the EFA to address the spontaneous configuration of the items in several factors, as well as the explanation of the variance. For this, the Weighted Least Squares (WLS) extraction and the Oblimín rotation were used given the ordinal nature of the items. Regarding the items, these will be part of the factors if their factor loadings (λ) are above λ > .30 (Fabrigar & Wegener, 2011).
Subsequently, we performed a Confirmatory Factor Analysis (CFA) (see Table 4) that was developed with the remaining 3954 cases. Four adjustment models are tested here: a) one-factor; b) four correlated factors; c) a Hierarchical model with four first-order factors and one second-order factor; and d) five correlated factors. In this case, the Unweighted Least Squares with Mean and Adjusted Variance (WLSMV) estimator was used, since this estimator is recommended when there is an absence of multivariate normality as well as for a Likert response scale with 5 or fewer answer options (Li, 2016). In this analysis, we checked the values of absolute fit indices, such as Chi-square (χ 2), the normed Chi-square (χ 2 /df ), and the Standardized Square Mean Residual (SRMR), as well as relative fit indices, such as the Comparative Fit Index (CFI) and the Tucker Lewis Index (TLI), together with a non-centrality-based index as the Root Mean Square Error of Approximation (RMSEA). A proposed model is considered acceptable when the χ 2 values are not significant or the χ 2 /df is less than 4; the CFI and TLI are greater than .90 (preferably greater than .95); SRMR and RMSEA are less than .08 (preferably less than .06); and factor loadings (λ) are greater than .5 (Brown, 2015; Byrne, 2008; Caycho-Rodríguez et al., 2021; Domínguez-Lara, 2018; Dominguez-Lara et al., 2022; Jonason et al., 2020; Moreta-Herrera et al., 2021; 2021; Yang-Wallentin et al., 2010). It should be considered that when a hierarchical model is estimated through CFA, the presence of high inter-factor covariances allows for estimating the presence of a secondorder factor (underlying) that permits a greater generalization of the model to be interpreted (sexual harassment) in the reference sample (Lance et al., 1992).
The third stage of analysis includes the internal consistency reliability analysis (see Table 5), both for the scale factors and the global factor. This property was analyzed with the McDonald’s Omega coefficient (ω) with 95% confidence intervals (McDonald, 1999; Padilla & Divers, 2013; Ventura-León & Caycho-Rodríguez, 2017). The statistical management of the results was carried out with the R Language in version 3.6.6 (R: A language and environment for statistical computing, R Foundation for Statistical Computing, 2019) using the Lavaan, MBESS, foreign, and MNV packages for the various analyses.
4. Results
4.1 Descriptive Analysis
Table 1 shows the results of the means obtained for each of the scale’s 21 items. The results are homogeneous, with a response pattern in the scale’s low scores. In the case of the skewness and kurtosis values, they exceed the acceptance ranges of univariate normality in the distribution (1.5), so this assumption is rejected. In the case of multivariate normality in the distribution of scores, the Mardia tests for g 1 and g 2 reflect statistical significance (p < .05), indicating that, among the items under analysis, this assumption is also rejected. As for the item-total correlation analysis, all items maintain an adequate relationship with the total value representing the construct, so there is no need to remove any item.
Table 2 shows the matrix of polychoric correlations among the 21 items constituting the ASIES scale. The relationships among items fluctuate within the parameters of an absence of multicollinearity (<.90) and are relevant to the construct (>.20). Therefore, adequate construct validity can be established based on the relationship among items. This also suggests that items do not need to be removed to improve future-fit models.
Table 2 Analysis of polychoric inter-item correlations of the ASIES scale
| Items | 1 | 2 | 3 | 4 | 5 | 17 | 6 | 7 | 8 | 9 | 10 | 11 | 12 | 13 | 14 | 15 | 16 | 18 | 19 | 20 | 21 |
| 1 | 1 | ||||||||||||||||||||
| 2 | .61 | 1 | |||||||||||||||||||
| 3 | .65 | .63 | 1 | ||||||||||||||||||
| 4 | .66 | .71 | .74 | 1 | |||||||||||||||||
| 5 | .52 | .70 | .57 | .69 | 1 | ||||||||||||||||
| 17 | .55 | .47 | .66 | .67 | .49 | 1 | |||||||||||||||
| 6 | .52 | .70 | .62 | .63 | .63 | .53 | 1 | ||||||||||||||
| 7 | .54 | .60 | .57 | .66 | .63 | .48 | .65 | 1 | |||||||||||||
| 8 | .40 | .33 | .42 | .42 | .30 | .54 | .37 | .59 | 1 | ||||||||||||
| 9 | .53 | .46 | .53 | .59 | .51 | .62 | .48 | .56 | .66 | 1 | |||||||||||
| 10 | .55 | .39 | .44 | .51 | .53 | .52 | .40 | .48 | .57 | .61 | 1 | ||||||||||
| 11 | .51 | .58 | .59 | .63 | .58 | .56 | .62 | .54 | .39 | .50 | .43 | 1 | |||||||||
| 12 | .40 | .40 | .51 | .56 | .47 | .65 | .44 | .51 | .46 | .46 | .50 | .56 | 1 | ||||||||
| 13 | .50 | .26 | .40 | .44 | .43 | .68 | .49 | .50 | .64 | .41 | .76 | .56 | .67 | 1 | |||||||
| 14 | .51 | .63 | .62 | .64 | .59 | .47 | .65 | .60 | .40 | .57 | .51 | .67 | .51 | .50 | 1 | ||||||
| 15 | .31 | .48 | .37 | .35 | .36 | .36 | .45 | .43 | .35 | .37 | .36 | .44 | .47 | .44 | .50 | 1 | |||||
| 16 | .46 | .51 | .49 | .58 | .46 | .56 | .42 | .50 | .48 | .62 | .52 | .54 | .56 | .59 | .57 | .46 | 1 | ||||
| 18 | .42 | .46 | .59 | .60 | .49 | .68 | .46 | .44 | .46 | .58 | .61 | .57 | .57 | .67 | .58 | .49 | .49 | 1 | |||
| 19 | .59 | .60 | .61 | .66 | .51 | .69 | .53 | .58 | .48 | .60 | .45 | .58 | .49 | .52 | .63 | .41 | .71 | .56 | 1 | ||
| 20 | .55 | .58 | .63 | .63 | .52 | .66 | .50 | .50 | .41 | .57 | .47 | .51 | .49 | .55 | .52 | .47 | .72 | .52 | .74 | 1 | |
| 21 | .51 | .48 | .51 | .51 | .42 | .56 | .45 | .49 | .37 | .60 | .56 | .42 | .47 | .41 | .46 | .38 | .49 | .48 | .64 | .65 | 1 |
Table 3 Exploratory factor analysis of the ASIES scale
| Items | F 1 | F 2 | F 3 | F 4 | F 5 |
|---|---|---|---|---|---|
| 6 | .712 | ||||
| 2 | .658 | ||||
| 5 | .575 | ||||
| 14 | .509 | ||||
| 11 | .509 | ||||
| 7 | .467 | ||||
| 20 | .619 | ||||
| 19 | .587 | ||||
| 16 | .552 | ||||
| 13 | .910 | ||||
| 10 | .348 | ||||
| 17 | .425 | ||||
| 4 | .422 | ||||
| 3 | .404 | ||||
| 9 | .639 | ||||
| 8 | .373 | ||||
| 1 | - | - | - | - | - |
| 12 | - | - | - | - | - |
| 15 | - | - | - | - | - |
| 18 | - | - | - | - | - |
| 21 | - | - | - | - | - |
| E.V. | .126 | .061 | .053 | .047 | .045 |
Note. Extraction: Weighted Least Squares; Rotation: Oblimin. E.V.: Explained variance.
4.2 Exploratory Factor Analysis
Table 3 presents the results of the EFA of the ASIES scale. The suitability of the data to form factors was previously verified with a value of KMO=.878, which suggests that it is suitable; as well as the assumption of Bartlett’s sphericity that evidences the identity matrix with χ 2 = 18286.5; p < .001. This is evidence that performing an EFA is possible. As can be seen in Table 3, the EFA of the ASIES shows the composition of five factors with 16 items with factor loadings greater than λ > .30 (the rest were not considered). This factorial model has an explanation of the variance of 33.2%, with factor 1 being the one that presents the greatest explanation of the variance with 12.6% and factors four and five with 4.7% and 4.5%, respectively.
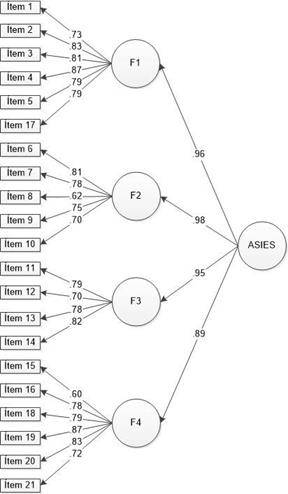
Note. The circles show the latent variables, while the rectangles show the observable variables along with the factor loadings. F1: Verbal harassment; F2: Nonverbal harassment F3: Physical harassment; F3: Blackmail; ASIES: Sexual Harassment in Institutions of Higher Education Scale.
Figure 1 Factorial structure of the ASIES scale according to the model of 4 1st order factors and 1 general 2nd order factor
4.3 Confirmatory Factor Analysis
For the CFA, five adjustment models were tested. Table 4 shows the adjustment models, which present adequate values for the sample under analysis. The models with the best fit for the 21 original items are the model of 4 correlated factors and the hierarchical model of four first-order factors and one second-order factor; while the one-factor and the 16-item five-factor version of the EFA product do not present good adjustment indices. For this study, it is considered that the hierarchical model is the most appropriate for the interpretation of the internal structure of the construct, considering the inter-factor covariances (see Table 5) are high, so it can analyze and explain their variation through an underlying second-order factor that overlaps to interpret the construct (sexual harassment).
Regarding the factor loadings (λ) of the items, Figure 1 shows that the model with four first-order factors and one second-order factor exceeds the critical value of λ > .50, both for the items that make up the first-order factors, as well as for the second-order factor (general factor). This demonstrates the considerable stability of the model and provides a better explanation for the variance. The data presented in the adjustment indices, as well as the factor loadings, are evidence of construct validity for the 4 first-order factors with 1 general secondorder factor model within the sample under analysis.
4.4 Internal Consistency Reliability Analysis
Table 4 shows the reliability analysis of the ASIES scale based on internal consistency employing the ω Coefficient and its 95% confidence intervals. In this case, the Verbal Harassment factor presents an acceptable internal consistency, while the reliability of the remaining factors is low and acceptable only for social research, since they are not undesirable values (García Cadena, 2006). On the other hand, when analyzing the model from the second-order factor (general factor), the internal consistency found is high and acceptable. This suggests that the model has greater precision based on the global scale of the test rather than among its factors.
5. Discussion
This study presents a factorial construct validation of the ASIES scale and internal consistency reliability to evaluate 21 behaviors related to sexual harassment in the university context. Our contribution is fundamental for measuring and calculating the magnitude of sexual harassment (Guarderas et al., 2018; Larrea et al., 2020) in an environment that has not been studied properly, such as the university context. This contribution, unlike most research on the subject, is based on a Spanishspeaking context (Bondestam & Lundqvist, 2020; Henning et al., 2017). In addition, this study incorporates a high number of participants and a diversity of samples focused not only on university students, but university professors and administrative staff (Fedina et al., 2018; Voth Schrag, 2017). This guarantees the representativity of participant selection, using probability sampling, an aspect that has been surveyed in several recent studies (Karami et al., 2021; Ranganathan et al., 2021).
For the validation process, an EFA is used to know the configuration of the scale in factors without the need for a pre-existing theoretical model. With this analysis, it is intended to know the factors that arise, as well as the amount of variance explained (Fabrigar & Wegener, 2011). The EFA yielded a five-factor solution with 16 items that explained the variance by approximately 33%. This model, however, indicates a low explanation of the variance, so it must be tested using CFA along with other models, including the theoretical proposal. Afterward, the CFA procedure is used to demonstrate eventual adjustment to the proposed model. Given the absence of multivariate normality and the ordinal response pattern of the items, the calculations were performed using the robust WLSMV estimator, as recommended in other studies (Beauducel & Yorck Herzberg, 2006; Byrne, 2008; Jöreskog et al., 2001); this reduces measurement error associated with the use of inadequate statistical tests. In the analyses, a model of 4 first-order factors and a second-order factor is confirmed, demonstrating adequate adjustment, which is verified by the values reached in the absolute adjustment indicators (χ 2, χ 2 /df , and SRMR), relative (CFI and TLI) and based on non-centrality (RMSEA), and the λ of the items within the model (Brown, 2015; Byrne, 2008; CaychoRodríguez et al., 2021; Domínguez-Lara, 2018; Jonason et al., 2020; Moreta-Herrera et al., 2021; 2021; YangWallentin et al., 2010). This model is mainly used because the inter-factor covariances are significantly high, which indicates the possible presence of a second underlying factor that contributes to the explanation of the general variance of the scale (Lance et al., 1992) to interpret the latent construct (sexual harassment). This model also agrees with the theoretical proposal of types of sexual harassment, confirming verbal harassment, nonverbal harassment, physical harassment, and coercion dimensions (Fitzgerald et al., 1995; Navarro-Guzmán et al., 2016; Rotundo et al., 2001). This finding suggests that sexual harassment is part of a continuum of various forms of gender-based violence that are occurring in university education (Bondestam & Lundqvist, 2020; Bursik & Gefter, 2011, Rotundo et al., 2001; Voth Schrag, 2017).
Regarding ASIES reliability, the results in internal consistency seem to indicate dissimilar values. On one hand, the global scale shows an acceptable level (VenturaLeón & Caycho-Rodríguez, 2017), with some authors suggesting that it is as high as .80 (Green & Yang, 2015; Viladrich et al., 2017). However, the results by dimensions would question the degree of reliability, since there are values under .60, which occur in the non-verbal harassment and coercion dimensions. Results in the aforementioned dimensions have values associated with a ground effect, which is in line with the limitations when evaluating how to measure and recognize offensive or unacceptable non-verbal gestures or behaviors. On the other hand, it is expected that there will be a low frequency of sexual blackmail and that the scale detects cases in a dimension that, depending on the various legal and academic contexts, can be considered a criminal offense.
Table 4 Confirmatory factor analysis of the ASIES scale with WLSMV estimation
| Model | χ2 | df | χ2/df | CFI | TLI | SRMR | RMSEA |
|---|---|---|---|---|---|---|---|
| One Factor | 474.4*** | 189 | 2.51 | .985 | .984 | .086 | .024 [.022, .026] |
| 4 orthogonal factors | 379.5*** | 183 | 2.21 | .994 | .993 | .077 | .016 [.014, .019] |
| 4 factors + 1 second-order factor | 386.2*** | 185 | 2.21 | .994 | .993 | .079 | .017 [.014, .019] |
| 5 factors (16 items) | 196.5*** | 94 | 2.09 | .990 | .989 | .067 | .020 [.017, .024] |
Note. ***p < .001; χ 2: Chi-square; df: degrees of freedom; χ 2 /df: normed Chi-square; CFI: Comparative Fit Index; TLI: Tucker-Lewis Index; SRMR: Standardized Mean Square Residue; RMSEA: Mean Square Error of Approximation.
Table 5 Internal consistency reliability analysis of the ASIES and inter-factor covariances
| Reliability | Covariances | |||||||
|---|---|---|---|---|---|---|---|---|
| Factor | Items | ω | CI 95% | F1 | F2 | F3 | F4 | ASIES |
| Verbal harassment | 6 | .76 | [.75, .79] | 1 | .95 | .88 | .87 | .96 |
| Nonverbal harassment | 5 | .53 | [.45, .59] | 1 | .96 | .86 | .98 | |
| Physical harassment | 5 | .60 | [.54, .67] | 1 | .87 | .95 | ||
| Blackmail | 5 | .57 | [.46, .68] | 1 | .89 | |||
| ASIES | 21 | .85 | [.83, .87] | 1 |
Note. ω: McDonald’s Omega coefficient; CI 95%: Confidence Intervals.
Despite the above, it has been suggested that addressing the results of a scale based only on the reliability criterion would lead to limiting the ability to understand the complexity of the phenomena studied (Oyanedel et al., 2017), and even more so when compared to a good factorial type fit.
Thus, there is an instrument aimed at measuring a wide range of sexual harassment behaviors in a higher education context, one that has at least four major advantages. First, such behaviors are part of a definition proposal and a theoretical model of university sexual harassment. This avoids subjective opinions or definitions of sexual harassment (Ferrer-Pérez & Bosch-Fiol, 2014; O’Leary-Kelly et al., 2009). Second, the representative samples incorporated include a diversity of participants (Voth Schrag, 2017), not only university students, in a Spanish-speaking context (Bondestam & Lundqvist, 2020). Third, the instrument facilitates the recognition of offensive or unacceptable behaviors, as some studies have suggested (Ranganathan et al., 2021). Finally, the identification of behaviors helps to capture a higher prevalence of sexual harassment (Fedina et al., 2018) and is a more robust measure than one that incorporates dichotomous questions about the presence or absence of the construct. This will facilitate assessing the prevalence of groups guiding prevention and intervention actions according to the different types of harassment raised here. Taken together, these elements contribute to the creation of a specific Spanish-speaking scale measuring the prevalence of university harassment, which is not currently measured, and, in particular, incorporating data from the Ecuadorian population that is traditionally absent in this type of study. The adequate factorial adjustment of the ASIES reported here is similar to that of other measures for evaluating sexual harassment (Navarro, et al, 2016; Fitzgerald et al., 1995; Preciado & Franco, 2013), providing an appropriate tool for assessing sexual harassment from a behavioral perspective.
6. Limitations and Future Studies
This study describes limitations. First, the dimensions of sexual harassment require further studies to confirm the theoretical model. At this point, improvement is needed in ways to assess behaviors such as non-verbal sexual harassment and blackmail, since both types of violence have been greatly naturalized and are thus difficult to recognize (Ranganathan et al., 2021). A second limitation refers to the fact that, although an attempt was made to diversify participants, the vast majority are university students, which may imply that student data do not necessarily coincide with the results of teachers and workers. Studies of these populations are required to validate the construct. Finally, the present study does not incorporate other convergence, discriminant, and stability validity analyses, which should guide future studies using the ASIES scale.
Finally, the approaches to sexual harassment in higher education institutions through the ASIES scale should not lose sight of the need for situated strategies differentiated from the dynamics of coexistence that are presented. Such strategies should consider factors such as the gender of members of university communities and assure that prevention, care, and reparation measures for the affected persons are in tune with institutional regulations and national and international guidelines.

