


 Inglês (pdf)
 Artigo em XML
 Referências do artigo
 Enviar este artigo por email
 Citado por SciELO
  Citado por Google
  Similares em
SciELO
Similares em
SciELO  Similares em Google
 Permalink
INTRODUCTION
A university campus is considered a miniature version of the city, which is characterized by a complex ecological system in search to unite the academic spaces harmoniously and balance all the functionality of investigation spaces with the common services, the university common wellbeing zones and the natural landscaping [1].
As cities, the behavior and elements that constitute a university campus require an efficient service that contributes with administration and environmental management [2].
To cover this problem, today, multiple universities such as Universidad de Pamplona [3], Universidad de los Andes [4], Universidad Pontificia Bolivariana [5], Universidad de Cartagena [6], Universidad del Magdalena [7] and Universidad del Valle [8], have begun to execute initiatives in the development of Smart Campuses, covering several fields, such as, urbanism and intelligent buildings, energy, environment, mobility, educational services, among others.
In the general framework, a Smart Campus is a system that uses technologies to be more competitive and to ensure a more sustainable future, with a symbiotic link of people networks, technology, infrastructure, consumption, energy and spaces [9].
Universidad Militar Nueva Granada, whose mission and vision are addressed to offer quality academic services, integrating within them activities related with teaching, research and the creation of an academic community. In the same way, the integration of services and activities have been established as one of its strategic aspects, facilitating and making its work more efficient, having an infrastructure with the newest technology as a factor of support for an efficient management of resources and processes [10].
In 2009, Universidad Militar Nueva Granada, in accordance with its vision and mission, began the construction of the largest University Campus in Colombia, and the third in Latin America. The magnitude of the Project and the complexity of all aspects related with its development and management, as well as the internal administration, have given evidence of the difficulties related to the administration of spaces, maintenance of installations, control of energy/hydraulic consumption, planning and organization of events, emergency and green buildings management, transportation and mobility, as well as sound levels modeling.
In order to offer solutions in harmony with strategic aspects of the university, this research’s main objective is to release the methodological design that was implemented for the elaboration of a GIS web system that would allow the monitoring, verification and updating of the trees in the institution, as the first case on the application of the development of a smart campus. For that, the description of the processes implemented in the construction of the base map will be done. The base map represents one of the fundamental supplies in the management and monitoring of resources in the institution through the use of technologies. This map will also allow visualizing and constituting the general elements of the campus and will serve as the main source for the development of future applications that will feed the system in other fields in the institution.
1. THEORETICAL FRAMEWORK
The rapid worldwide urban growth [11], because of the inevitable tendency of the modernization and development [12-13], has resulted in important challenges in terms of governing and planning, which gives place to the changes that this activity generates over the economic, social and environmental structure in the territory [14].
The need to confront such challenges in an efficient and sustainable form has required the applications of technologies as a tool for a successful management in urban growth [15]. This synergy between urban management and information and communications technologies (ICT), has given place to the concept of smart city.
During the last century, this concept has been formulated by a great number of researchers from different disciplines and corporations [16], whose specific interests have generated multiple definitions that adapt their focus or investigation, such as information and communication technologies (ICT), the sustainable urban or community development through a learning focus based on knowledge, among others [17-18].
Considering that a consensus on the definition for this term does not actually exist, in this research framework, a local system of innovation supported by technological webs and artificial intelligence will be understood as smart city [19-20]. Its general objective consists of an interconnection and interoperation of systems and subsystems of a city to improve its social wellbeing, economic development and the conservation of the environment [21].
In a similar manner, the concept of smart campus makes reference to a digital strategic center, which fosters an “end to end” learning of an eco-system of knowledge, in which collaborative spaces and centralized information are created [22]. That frames the difference between a smart campus, and one that is not. This is done by the design and the conceptualization of an educational space, and not only by its architectural design, but it becomes into a learning space, which is socio-spatial, based on webs of collaboration that generate sustainable environments [6].
Authors, such as Galeano-Barrera and others [23], have identified a group of seven fundamental pillars, that sets gives the north to a university institution on how to become a smart campus; among them, environment, society, governance, infrastructure and mobility, health and research. These pillars are not necessarily static, reason why, every institution can adapt, reinforce or omit the areas of intelligence applicable to the Smart Campus design based on their needs and capabilities for an efficient transitional process [23].
Nowadays, an institution could not have been conceived as a group of coherent processes which allows the gathering, process, storage and distribution of data without the help of information technologies, specifically information systems and facilitates management and decision making for an internal resources control [24]. The majority of the smart campuses integrate information automated systems such as Transaction Processing Systems (TPS) and Enterprise Resource Planning Systems (ERP) in a Geographical Information System (GIS), where administrative transactions are processed and decision-making is facilitated for the planning of resources [25].
GIS are characterized for being systems that have the possibility of having their database distributed in different servers; and being able to access them via web communication, allowing access to the existing remote information. However, to mix information from different servers, this should have certain characteristics that allow interoperation with compatible formats under common standards [26].
For that, it is necessary to have agreements among owners, producers and users that facilitate the access and exploitation of the geographic information, as well as the application of norms, standards and specifications that regulate and guarantee the information interoperability, being The International Organization of Standardization (ISO) the most important organism in this process [27].
Considering the university campus as a complex system, as presented in Figure 1, the scheme of the main components that serve as a reference to model the context base map of the Nueva Granada Campus of the Universidad Militar, it is important to take into account that the base map is the one containing the fundamental data and serves to construct or reference any other group of thematic data.
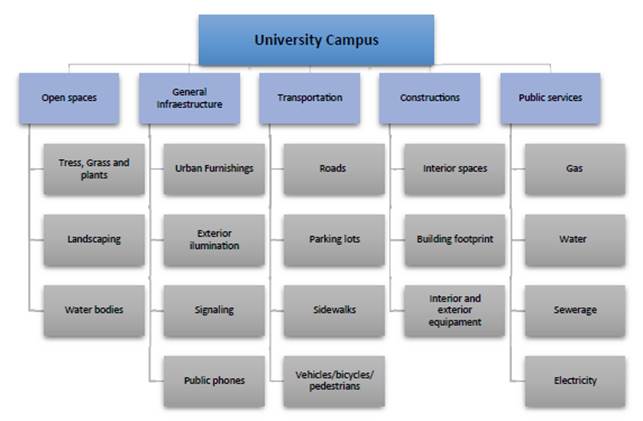
The majority of the information is presented in Figure 1. It is commonly found in the general university campus plans. Nevertheless, in most cases, data is stored in DWG format of a CAD system. For this reason, it is necessary to transform them into SIG system through the extraction of geo-referenced functional layers and the regeneration of geometries of entities that allow the construction of the base map.
ESRI’s Local Government Information Model (LGIM) is a system that allows the development and elaboration of a Smart Campus [28]. It could be defined as a group of tools that adapt to the specific needs of a user, generating a pattern of common order, which allows the use of GIS as an information management tool for decision making to form a user community, use, adapt, and finally create new maps and applications [29].
Considering the non-existence of GIS servers at the Nueva Granada Campus, a model that works from the cloud is proposed, such as Software as a Service (SaaS) or software as the server [30]. This model of implementation corresponds to an application offered through the internet, which is offered by its creator, and can be used by several clients, keeping the privacy of personal data and the personalization of the application [31]. It is characterized to avoid the administration of servers, and to connect the information directly with the applications developed for the intelligent campus, through the use of ArcGIS Online [32]. The geographical portal model allows the access, visualization, consult and collaboration of the applications of the virtual campus among different user groups.
2. MATERIALS AND METHODS
2.1 Area of study
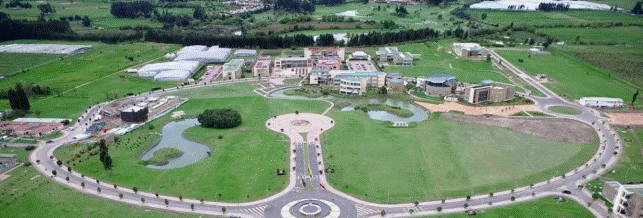
The university campus of Universidad Militar Nueva Granada (UMNG) [Figure 2] is located in the municipality of Cajicá, department of Cundinamarca, Colombia, with a total area of 75.5 hectares, of which 11 % are destined for the construction of urban zones [33].
The physical infrastructure has a large number of urban works, such as, roads, sidewalks, trials, bicycle lanes, parking lots, urban furnishing, buildings, cafeterias, auditoriums, sports spaces, restaurants, greenhouses, collection center, water treatment plants, integration square, laboratories and an acoustic shell [33].
2.2 Materials
Due to the versatility that the software offers in the inter-operational process with other systems, this methodology was developed using ArcGIS. It allows, among other advantages, information integration processes with Computer Aided Design (CAD), Geographic Information System (GIS) and Building Information Modeling (BIM).
The supplies used for the development of this research are:
Data on the infrastructure of the University Campus, given on CAD.
Archives on Excel, with the location information, status, type, family, and other characteristics and properties relevant to the tree inventory to date at the university.
2.3 Methodology
This research was developed dividing the process into two phases: the first one was the creation of a geo-visor elaborated through the publication of the institution’s web map. The second was the creation of the application for the management of trees at the university.
2.3.1.1 Information Preparation
To begin the map construction of reference for UMNG, it was necessary to implement a series of preliminary tasks that allowed organize, extract and modify CAD data to ensure efficiency of later processes and final quality.
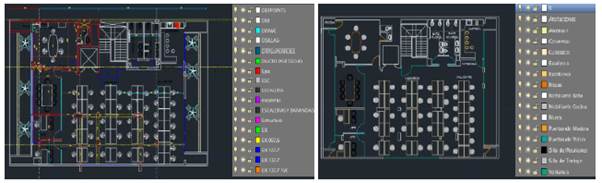
The first task inside this phase consisted on the organization of information. Considering how commonly different layers can be used to represent one element in CAD files, it was necessary to unify and clean data in such way that the final file would have as many layers as its number of elements [Figure 3].
Within this process, it is important to consider that the zero-layer must not contain information and it must not be duplicated. The geometries handled in CAD files are points, polygon, lines and annotations. The last one must be saved in a different layer. For the 3D objects in CAD, the polygonal geometry mesh will be converted to a multi-patch element when being exported to GIS that corresponds to 3D geometry in ArcGIS [34].
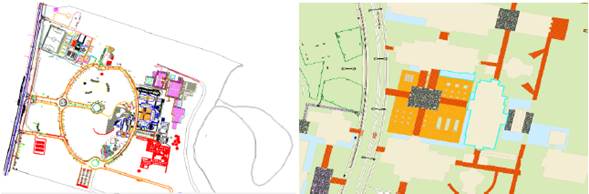
Afterwards, the CAD files were geo-referenced into ArcMap, allowing the location of the information spatially over the area in earth’s surface where it belongs. Once the information was referenced, a selection of the fundamental layers for the construction of the reference map (such as walls, lower walls, windows, doors, columns, exterior spaces and water bodies, including roads) was done. This data was transformed into Shape-file files, corresponding in a spatial format data developed by ESRI, which allows the storage of non-topological geometries, together with attributes associated to them [35]. During this phase, the multiple lines that were completely closed were transformed into a polygon.
For an easy access and administration of information, it was necessary to store it in a Geo-database, or spatial data base, whose structure allows the centralization of a large quantity of alpha-numeric and spatial information in an organized manner [36]. Likewise, its structure allowed at a later time to correct topological errors, based on a definition of rules which specify the spatial relationships between allowed entities, to maintain the spatial integrity of data [37]. As a result, CAD layers were extracted and SIG was integrated, as shown in Figure 4.
2.3.1.2 Publication of a service of vector tiles
Vector tiles are small pieces of data with vector character, which are geo-referenced and they reach a spatial, adjacent and rectangular extension. As the map “raster” tiles, its purpose is to give support for fast map services, which can take advantage of pre-rendering, use of caches and concurrent petitions. Its application is designed for visualization services, where geometric objects are selected, combined, simplified and cut to generate small vector tiles, which can be delivered to client devices and application, getting easily adapted to its resolution with cartographic styles, different in function from user’s needs [38].
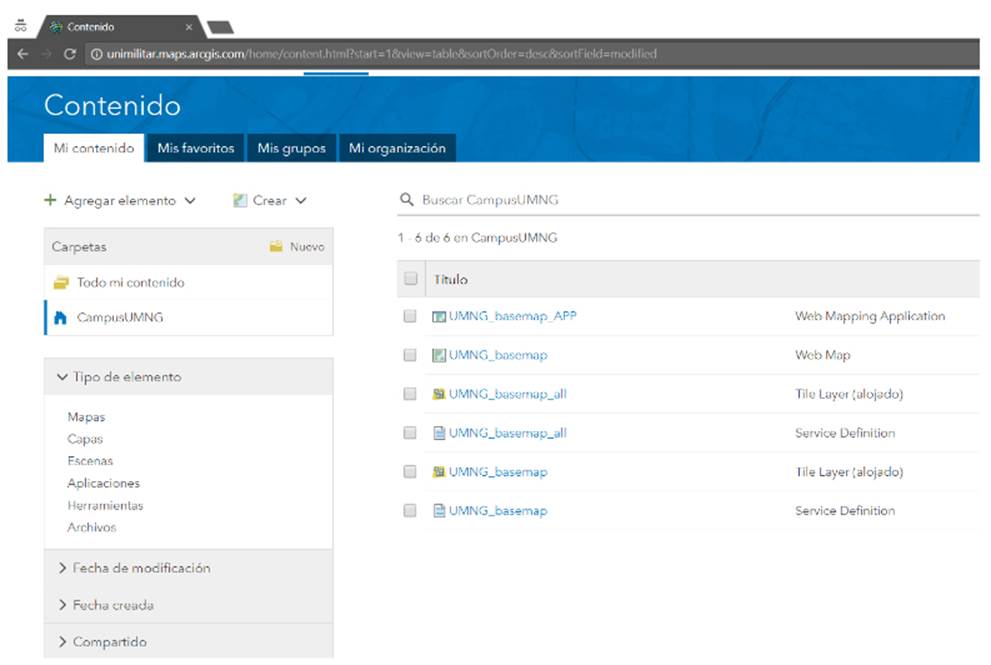
The publication of the service was done through software ArcGIS Desktop. For this, it was necessary to enter via interface into the university’s online ArcGIS account. Thereafter, it was necessary to accomplish the publication as a vector tiles service. Entering the university account contents into the web, it was possible to verify the vector tile layers publishing, which contain the base map information from Nueva Granada Campus [Figure 5].
2.3.1.3 Creation of the Web Map
With the purpose of creating an application that allows UMNG users to identify and spatially locate the institution’s elements, a web map was created through the ArcGIS Online Platform [Figure 6]. For this, a layer of vector tiles was added to the Map Viewer page. Then, it was configured to the application style, the labels, emergent windows that allow an efficient visualization of attributes of spatial elements. Finally, the configuration of different tools that allow the efficient use of the website was added. It is important to point out that the option of a map aspect varies in the account’s configuration function and the size of the web browser’s window.
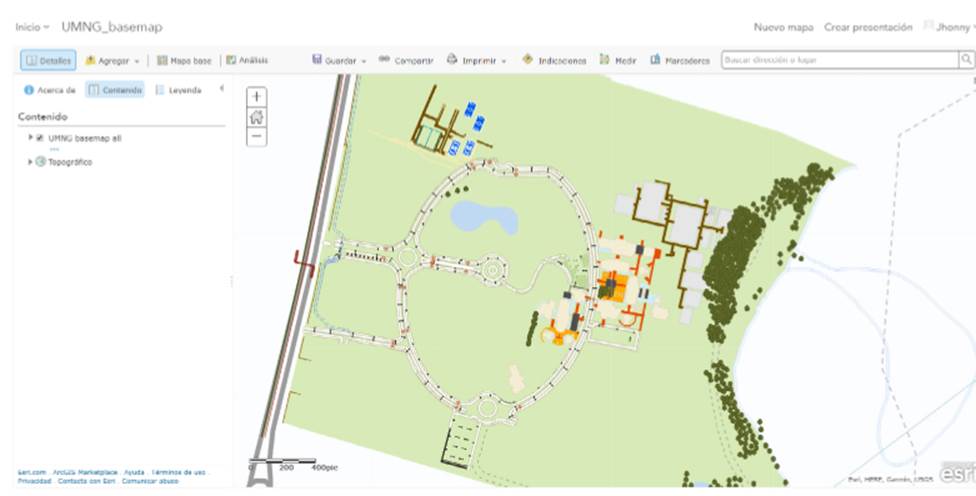
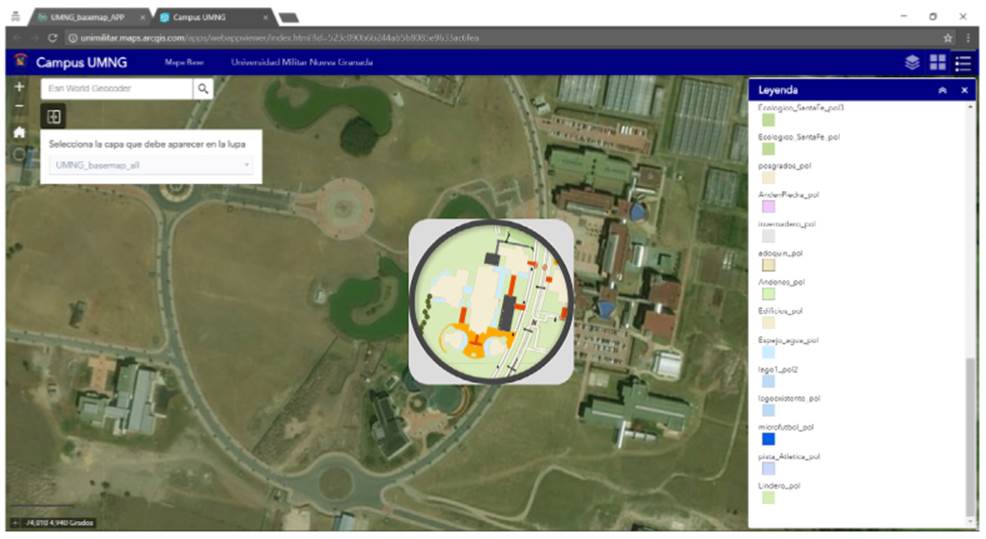
As a result, it was possible to configure an application, in which the user can visualize the information in a 2d model, perform zoom or distance tasks, look for a site by entering name or coordinates, consult, turn layers on or off; and define if a street map, a satellite image or a topographical map will be used as a support for additional orientation of the vector campus information [Figure 7].
2.3.2 WEB Application for the management of trees at the UMNG
After generating the base map for the campus, the implementation of the geographic application was done to assist with the tasks of verification, monitoring, and updating of the tree component in Nueva Granada Campus, as it is now explained.
2.3.2.1 Information preparation
The information related to trees at the UMNG Campus was prepared in an Excel file. To integrate it in the system, a point’s vector layer was created in ArcGIS; and stored in a geo-database, in order to create domains as a method to force data integrity.
The domains are rules stipulated for the field of information, which limits the values that can be stored in the entity table. This way, the field can only store numeric data, text type, dates or unique identifiers according to the rules defined for this entity.
In the design of the data structure, only information that can be registered by the user who does the field monitoring process was included [Table 1]. While coordinates of a point represent the most important geographic characteristic of the entity, these were not included in the format, for the application captures this information automatically.
Table 1. Attributes associated to the tree feature
| Attributes | ||
|---|---|---|
| NO Tree NO | Aspect | Support with drawal |
| Tree ID | Mechanical damage | Clearing |
| Family | Handling Proposal | Phytosanitary control |
| Species | Date | Chipper addition |
| Common name | Validation of reported specie | Phytosanitary damage tree site |
| Diameter Base (cm) | Survivalverification | Observ. Phytosanitary damage tree site |
| Total Height (mt) | Stakeout | Mechanical damage tree site |
| Phytosanitary Status | Pruning | Obser. Mechanical damage tree site |
| N. Location | Chemical fertilization | NO replacement tree |
| Location | Organic fertilization | NO replacement location |
Source: Own elaboration.
2.3.2.2 Publication of the Institutional Geo-visor Layer
Once the preparation phase was finished, the information was published as a layer of entities in the institution geo-visor, following the same procedure as exposed in the previous phase for the publication of a service of vector tiles.
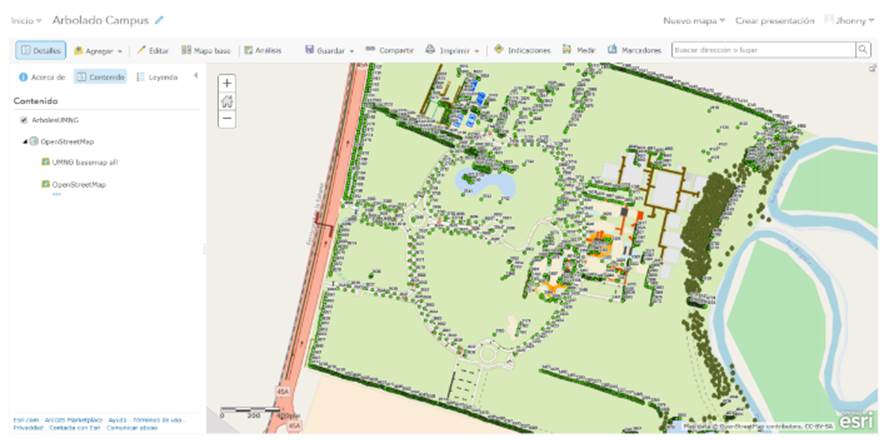
Figure 8 shows a web map with the punctual layers of trees, together with the base information generated for the Nueva Granada Campus, which serves as a spatial thematic reference for the user.
2.3.2.3 Data entry
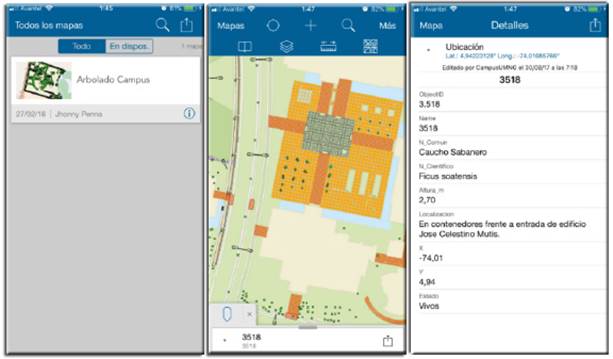
For data entry, the mobile ArcGIS Collector application was used to capture information in the field using web maps [39]. This application, available for Android as well as iOS, allow users to work over any published map on the ArcGIS Online Organization.
The application allows the user to select a tree, object of revision, edit a series of the established fields in the entry format; and take pictures to evidence the state of the individual being revised [Figure 9].
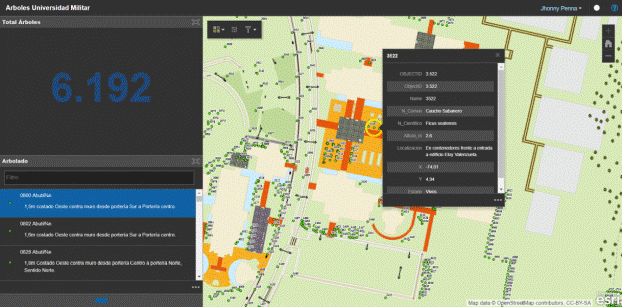
2.3.2.4 Creation of the Control Board
The control dashboards are management tools that serve to diagnose a situation through the visualization of useful information that allows performance measurement using data tools. For the application of the tree in campus at the university, a board was control-created with the Operations Dashboard option, which allows monitors the tracing files of an organization, as well as evaluating the configuration to be monitored in real time within the state of data collection in the field and of daily operations from a dynamic board.
For the management of trees, the university board allows to perform consulting tasks related to the status of the verification process of the number of trees registered and the actual state for each one. In addition, the emergent window allows to visualize the information of a specific entity in a simple and practical manner [Figure 10].
CONCLUSIONS
The generation of the base map and the creation of the application for the monitoring of trees at the Nueva Granada Campus represent one of the first phases of the GIS Smart Campus. Its development offers the institution the possibility of having a system that provides and integrates comprehensive information through a model that avoids data multiplicity; and provides services and applications to consult, visualize and edit information from different access points. It also serves to board different needs for UMNG users, offering opportunities for I+D technology, “Smart Cities”. In general, the system empowers the teaching and learning processes, while also improving the management process as well as the quality of lives for people through sceneries, in which users can interact with their environment.
The application generated in the project’s framework represents only one example of the multiple questions and works that could be developed through a Smart Campus. From the reference information obtained in the elaboration of the base map, the development of 3D models could continue for the process of location inside the university buildings, control administration of classroom access and offices in real time. These processes facilitate student’s learning through applications that allow the use of educational resources that contribute to intellectual development, better people mobility, as well as an optimization of resources.
It is important to point out that the development of the proposed objectives evidences the need of implementing software programs. This would allow the generation of inter-operating processes for the integration of information, which is supplied by different formats, fostering in this way the development of inter-connected systems under a standardized infrastructure.

