


Serviços Personalizados
Journal
Artigo
 texto em
  Espanhol (pdf)
 Artigo em XML
 Referências do artigo
 Enviar este artigo por email
Indicadores
-
 Citado por SciELO
 -
 Acessos
Links relacionados
-
 Citado por Google
 -
 Similares em
SciELO
Similares em
SciELO -
 Similares em Google
Compartilhar

 Permalink
Ingeniería e Investigación
versão impressa ISSN 0120-5609
Ing. Investig. v.30 n.2 Bogotá maio/ago. 2010
Luis Eduardo Gallego Vega1 and Oscar Germán Duarte Velasco2
1 Electrical Engineer. M.Sc., in Electrical Engineering. Ph.D., in Engineering, Universidad Nacional de Colombia, Bogotá, Colombia. Researcher, Grupo de Investigación PAAS, Universidad Nacional de Colomiba, Bogotá, Colombia. Assistant Professor, Department of electrical and electronic engineering, Universidad Nacional de Colombia, Bogotá, Colombia. lgallegov@unal.edu.co2 Electrical Engineer. M. Sc., in Industrial Automation. Ph.D., in Computer Science, Universidad de Granada, España, Universidad Nacional de Colombia, Bogotá, Colombia. Researcher, Grupo de Investigación PAAS, Associate Professor, Department of Electrical and Electronic Engineering, Universidad Nacional de Colombia, Bogotá, Colombia. ogduartev@unal.edu.co
Abstract
This paper presents the results of research about the effect of transmission constraints on both expected electrical energy to be dispatched and power generation companies' bidding strategies in the Colombian electrical power market. The proposed model simulates the national transmission grid and economic dispatch by means of optimal power flows. The proposed methodology allows structural problems in the power market to be analysed due to the exclusive effect of transmission constraints and the mixed effect of bidding strategies and transmission networks. A new set of variables is proposed for quantifying the impact of each generation company on system operating costs and the change in expected dispatched energy. A correlation analysis of these new variables is presented, revealing some interesting linearities in some generation companies' bidding patterns.
Keywords: electrical constraint, bidding price, optimal power flow, bidding strategy, power market.
Received: may 29th 2009 Accepted: jun 20th 2010
Introduction
The electricity generating sector has been facing a set of meaningful reforms during the last 20 years aimed at increasing energy production efficiency and power quality at competitive prices.
Within the new context of deregulated markets, generation companies (GENCOs) must bid a price for their produced electric energy reflecting not only their strategic behaviour, but also their risk perception about the market which might be classified as price risk and quantity risk.
Quantity risk is associated with expected dispatched energy in which electrical network constraints play a vital role. In other words, it is reasonable to think that due to the location of their generating plants in an electrical transmission network, power from some GENCOs might have a better chance of being dispatched mainly caused by trapped load in the electricity generating system or forced generation, situations which might be exploited by GENCOs to distort power market prices.
Facing this problem may traditionally combine different focuses, such as microeconomic theory, large-scale optimisation and game theory; equilibrium theory seems to be one of the most popular among such focuses. The main objective in equilibrium theory is to find a particular condition or equilibrium in which none of the players have incentives to change their selected strategy, given that this change might result in lower payoff (Nash equilibrium, Hobbs 2001). Cournot models are also very popular. Bidding strategies are submitted in terms of quantity in these models (i.e. MWh) which might be treated as large-scale optimisation problems to find equilibrium in a power market having an explicit representation of electrical transmission network constraints. Some of the most important works dealing with this approach might be found in the following: Hobbs, 2000; Daxhelet and Smeers, 2001; Ventosa et al., 2000; Contreras and Klusch, 2004; Hobbs and Pang, 2007.
The so-called supply curve equilibrium models are a more sophisticated version of Cournot models in which bidding strategies are submitted in terms of both quantity (MWh) and price (U$/MWh). This approach was initially developed by Klemperer and Meyer (1989) and reviewed by Green and Newberry (1992). This approach’s most distinguishable characteristic is that, in order to make it mathematically treatable, many authors have considered several variables such as demand, marginal costs and supply curves as being linear functions. Some of the most important works following this approach might be found in the following: Green and Newbery, 1992; Green, 1996; Weber and Overbye, 1999; Anderson and Xu, 2001.
In the case of Colombia, the previous studies have analysed the effect of electrical constraints in a more descriptive way by assessing GENCO bidding behaviour in each operation area of the national transmission system without representing the power flow optimisation problem involved in electrical networks. Jaramillo (2002) and Jaramillo and Sanint (2002) have studied the commercial impact of electrical constraints on the Colombian spot market. These studies have used a classic game-theory approach, having a typical payoff matrix representation for determining a set of optimal bidding strategies. Campuzano and Smith (2002) have analysed the market power for several Colombian GENCOs for reviewing proposed owing limits in generation plant resources in Colombia. The model analysed each operation area in the national transmission system, electrical dispatch being based on a one-bus model in which transmission line capacity limits have been completely neglected.
Unlike previous work, the present research is the first in Colombia to consider the effect of electrical network constraints on Colombian power market energy bidding behaviour based on an explicit modelling of the national transmission system and modelling electrical economic dispatch.
GENCO behaviour is based on real bidding prices exhibited by them during daily Colombianpower market operation. Due to recent confidentiality regarding each generation plant's bidding prices, this analysis has been based on the bidding prices submitted by all Colombian GENCOs from 2001 to 2004 stored in the Colombian power market database (NEON). This information was provided by XM (the independent system operator (ISO) in Colombia) in developing a research project called, "Modelling Colombian power market energy bidding behaviour," supported by the Universidad Nacional de Colombia's Research Division in Bogota.
Methodology for analysing the effect of electrical constraints
This section analyses the effect of electrical network constraints on bidding. The methodology consists of four well-differentiated stages. The first stage modelled the national transmission system and Colombian power system operation. The second stage defined a set of new variables for studying the effect of electrical constraints on bidding strategies. The third stage estimated the exclusive effect of transmission networks by considering uniform bidding profiles for all GENCO considered. This was aimed at detecting the structural characteristics of a market working for a network having electrical constraints, but diminishing the effect of GENCO bidding strategies. The last stage estimated the mixed effect of both transmission network constraints and bidding strategies by means of a set of simulations based on the differentiated bidding profiles of each GENCO which are also based on the real bidding prices submitted by them.
Modelling the national transmission system
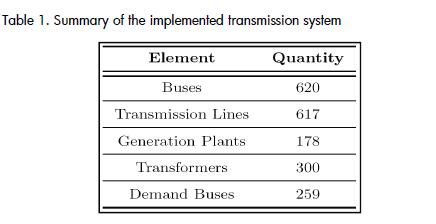
The explicit modelling of the national transmission system was implemented by following the Transmission Expansion Reference Plan 2006-2020 (UPME, 2006) which considered the totality of generation plants and transmission lines. Table 1A presents a summary of the finally implemented system.
Similarly, national demand was associated with 259 buses in which power factors and distribution factors were known. The modelling was carried out using the MATPOWER tool (Murillo and Zimmermann, 2007), which is an adaptive MATLAB-based tool for solving optimal power flows (some system parameters can be changed by following power system matrix representations).
This characteristic led to iteratively simulating many economic dispatch cases by modifying load conditions, bidding prices, power system configuration, etc.
The economic dispatch problem was treated as the solution of optimal power flows applied to the national transmission system (NTS). Optimal power flows were based on the bidding prices submitted by each GENCO for each of their generation plants. DC optimal power flow was adopted (Wood and Allenberg, 1996) in which the operation system cost is minimised subject to transmission line capacity and minimum and maximum generated power for each plant modelled. This model was adopted because it was more robust than the AC model in terms of convergence, efficiency and speed. It should also be noted that this model neglects both active power losses and reactive power flows for voltage support; however, such reactive power flows cannot be traded over wide areas due to high reactive power loss in the transmission lines (Kirschen and Strbac, 2005). In fact, given the current structure of the Colombian power market, reactive power is not tradable, although it might be remunerated as an ancillary service in the future.
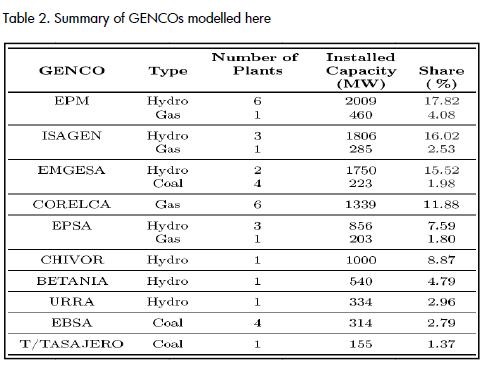
The bidding behaviour of 35 generation plants was modelled, implying 91% of total installed capacity in Colombia. The remaining 9% are minor generating plants which are not obligated to bid in the Colombian power market. These 35 plants are grouped into 10 GENCOs which are a very representative sample of the Colombian market. Table 2 presents a summary of the GENCOs modelled here.
Colombian power system operation is based on the concept of operation areas, determining limits on importing and exporting energy amongst them. This research follows the Colombian ISO area classification (XM S.A.); the Colombian power system is thus divided into six areas as follows: (i) Caribe, (ii) Caribe 2, (iii) Eastern, (iv) South-western, (v) Antioquia-San Carlos (ASC), and (vi) North-eastern area. GENCO participation showed duopoly behaviour inside each operational area.
New proposed variables
This section describes the set of new variables which are going to be considered during analysis using the proposed methodology. These new variables are of two types; the first is related to a GENCO's generated quantity of energy (MWh) resulting from an economic dispatch (real generation hereinafter) whilst the second is related to the impact on the system operation cost when 1 MW less of GENCO installed capacity is available (reduced cost hereinafter).
Estimating the change or delta in either of these variables was most interesting when considering constraint and non-constraint scenarios. This idea led to proposing the following new variables.
Variation in real generation (ΔGr):, consists of subtracting GENCO generated quantities regarding an electrical constrained and unconstrained dispatch scenario. Such variation might be positive or negative leading to opposite meanings. So, a positive(negative) variation which might be interpreted as being a window(cap) in generation, respectively, implies that, by considering electrical network constraints and bidding strategies, its dispatched energy increases(decreases) by contrast with an unconstrained scenario.
For instance, if ΔCr for GENCO EPM is 300MW (-300MW) at hour 19, this means that, due to both network constraints and bidding strategies, this GENCO generates 300MW more(less) compared to its generation in an unconstrained scenario (infinite transmission line capacity). In this regard, such quantity represents an opportunity(cap) for this GENCO because it must technically generate 300MW more(less) of what is economically necessary.
Variation in reduced cost (ΔCr): consists of subtracting GENCOs reduced cost regarding an electrical constrained and unconstrained dispatch scenario. Again, this variation might be positive or negative leading to opposite meanings.
So, a positive(negative) variation or increases(decrease) of the impact on system operation cost implies that, by considering electrical network constraints and bidding strategies, the value at which system cost increases per unavailable MW is greater(less) than that value obtained in an unconstrained scenario.
For instance, if ΔCr for GENCO EPM is 100$/MW (-100$/MW) at hour 19, this means that, due to both network constraints and bidding strategies, this GENCO, by reducing its generation by 1 MW, increases (decreases) its impact on system operation cost by $100 more(less) than the value at which this GENCO would have an impact on system operation cost in an unconstrained scenario. In this regard, this value implies that this GENCO technically has the chance to increase, to a more(less) degree, the system cost of what it could increase it in just an economic sense.
Ratio between reduced cost variation (ΔCr) and real generation variation (ΔGr): this new ratio (Rcg) indicates how much the impact of a GENCO on system cost varies per MW. Its dispatched energy also varies by contrast with an unconstrained scenario. Rcg is defined as follows:
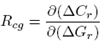
The meaning of the sign for this ratio should now be clear because a positive(negative) sign implies a direct(inverse) relationship between real generation and reduced cost variations.
For instance, a GENCO having an Rcg value of 10$/MW implies that its impact on system cost increases(decreases) by $10 when its real generation also increases(decreases) by 1MW by contrast with an unconstrained scenario (direct relationship).
On the contrary, a GENCO having an Rcg value of -10$/MW implies that its impact on system cost increases(decreases) by $10 when its real generation decreases(increases) by 1MW by contrast with an unconstrained scenario (inverse relationship).
Exclusive effect of transmission networks uniform bidding strategies
The quantity to be dispatched is generally a function of many technical and economic factors. However, in terms of optimal power flows, real generation (Gr) depends on electrical and operational constraints, bidding prices and demand, as follows:
Gr=f (constraints, bidding prices, demand)
Uniform bidding profiles are used to mitigate the effect of GENCOs' commercial strategies. The exclusive effect of transmission line capacity limits might be assessed. This analysis was carried out in several stages as follows:
1. Optimal power flows were simulated to emulate hourly economic dispatch in the Colombian power system. These power flows were based on both uniform bidding profiles (equal bidding prices) and progressive increase in power demand from 3GW to 8GW (20MW steps). The main idea behind such progressive increase was to observe electrical constraints behaviour as the network was becoming "congested", considering real transmission capacity limits in each transmission line in the Colombian power system (617 transmission lines approximately). Real generations and reduced costs for every generation plant were thus obtained for each power demand level.
2. The procedure described in section 1 was repeated, but infinite transmission line capacity was considered.
3. A subtraction between constrained and unconstrained scenario was made for real generation and reduced costs at each particular power demand levels.
4. An aggregated analysis for each operation area (inter-area analysis) was carried out to estimate the behaviour of both real generation and reduced cost variations as a function of power demand. It was thus possible to observe the progressive effect of power congestion on the previously mentioned variables.
5. A disaggregated analysis for each GENCO inside operation areas (intra-area analysis) was made for observing the proposed variables' behaviour.
Inter-area analysis
Figure 1 shows the behaviour of average ΔGr for each operational area as a function of power demand.
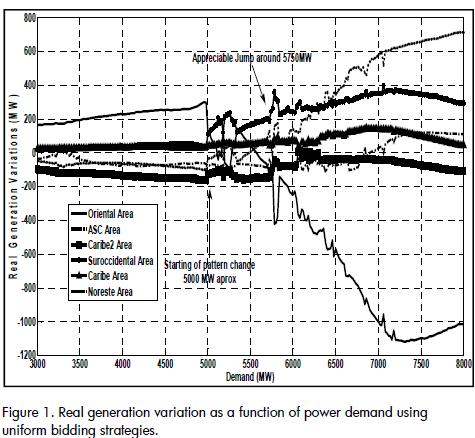
Figure 1 shows that real generation variations exhibited stable behaviour up to 5GW power demand. However, when power demand rose above 5GW some appreciable changes appeared as generation "caps" and "windows".
The Eastern area particularly behaved as a generation cap starting from 5.3 GW having an approximated -0.8MW per MW demanded slope while the ASC area increased its real generation variation in a sustained way (generation window) coinciding with the decrease in the Eastern area. This particular situation might represent a dominant position in the power market for GENCOs located in the ASC area. It should thus be stressed that this condition was caused exclusively by the electrical network configuration and its transmission capacity limits, given that none of the GENCOs were submitting bidding prices following any bidding strategy (uniform bidding profiles).
On the other hand, the Caribe and North-eastern areas showed relatively constant behaviour as demand increased, while the South-western area tended to behave as a generation window.
Intra-area analysis
This section presents a disaggregated analysis, observing GENCO behaviour in each operational areas.
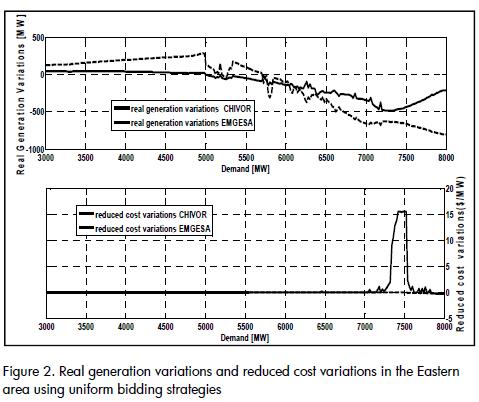
1. Eastern area Figure 2 shows the results for the Eastern area. It can be observed that EMGESA experienced the generation cap in the Eastern area with greater severity. Reduced cost variations began to be appreciable for high power demand values, as expected (from 7.2 GW); however, these variations were only appreciable for EMGESA and were relatively small.
2. The ASC area Results for the ASC area are shown in Figure 3 Regarding reduced cost variations, these values started being appreciable from 6.5 GW. GENCO behaviour was very similar for ISAGEN and EPM, having an increasing trend during peak demand hours.
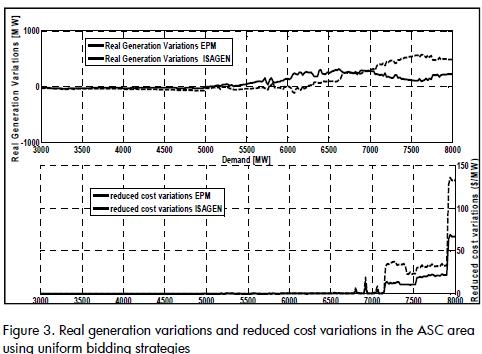
This impact on system operation costs reached $220 values when both GENCOs were considered aggregated. However, EPM was the GENCO having the highest impact on system cost. Regarding real generation variations, some generation windows were appreciable starting from 5 GW.
Regarding real generation variations, some generation windows were appreciable starting from 5 GW. In the 5 to 6.5GW range, GENCO ISAGEN presented greater growth in this generation window; however, beyond 6.5GW, GENCO EPM exhibited greater growth. This inflection point around 6.5 GW coincided with the appearance of positive values for reduced cost variations
3.North-eastern area Results for the North-eastern area are shown in Figure 4 This area is mainly composed of thermal plants which seemed to experience a generation window over 6.7 GW power demand.
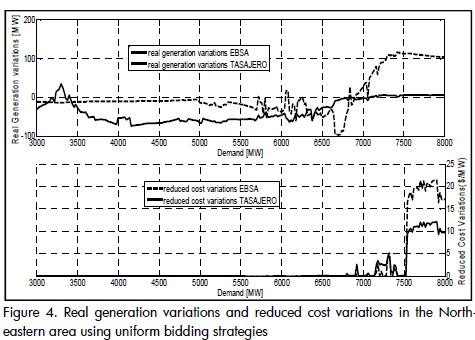
GENCO EBSA particularly experienced this window, whilst GENCO TERMOTASAJERO did not seem to experience any variation in its real generation. On the other hand, reduced cost variations exhibited a similar pattern for both GENCOS, having a sudden growth around 7.5 GW of up to $20/MW.
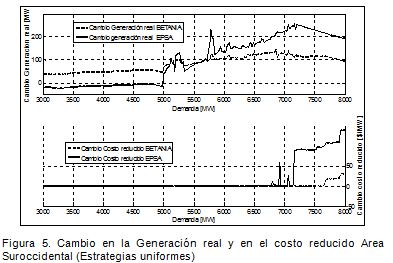
4. South-western area Figure 5. gives the results for the South-western area. This area has great hydro generation capacity. Regarding real generation variations, this area tended to behave as a generation window, which was more evident in GENCO EPSA. Similarly, reduced cost variations started being appreciable from 7.1 GW, this being also more evident in GENCO EPSA (up to $140/MW).
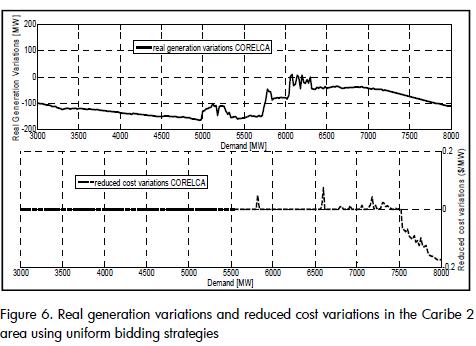
5. Caribe2 area: Results for Caribe2 area are shown in Figure 6 This area represents the main thermal resource in Colombia. This area tended to behave as a generation cap having a -100 MW value during base demand hours. However, this generation cap tended to fade as power demand increased. Regarding reduced cost variations, this variable might give negative but too small values (0.1$/MW).
Mixed effect of both transmission networks and strategic interaction among GENCOs differentiated bidding strategies.
Unlike the last section, this section analyses the mixed effect of transmission networks and bidding strategies. This analysis was based on bidding price patterns found in Gallego (1) (2008) and Gallego (2) (2008) which were obtained from applying different pattern recognition techniques on the real bidding prices submitted by each generation plant. They describe the most representative bidding behaviour regarding each of their technological generation portfolios.
It should be clarified that each bidding function exhibited by the GENCOs modelled here was classified as a specific bidding pattern. Consequently, in the proposed methodology, GENCO bid patterns exhibited during the analysis period (i.e. bidding prices for a particular GENCO on a particular day) corresponds to a bidding pattern obtained from the real bidding prices used on the same particular day.
The proposed methodology followed the following steps:
- Optimal power flows were simulated to emulate hourly economic dispatch in the Colombian power system. These power flows were based on differentiated bidding profiles for each GENCO which were represented by the exhibited bidding patterns from February 2001 to December 2004. Power demand was represented by real power demand values during the period being analysed. The real capacity limits for each one transmission line were considered as well as the active power generation limits for each modelled plant.
Real generation and reduced costs for every generation plant in the Colombian system were thus obtained for each day and each hour during the period being analysed.
- The procedure described in section 1 was repeated, but considering infinite transmission line capacity.
- A subtraction was made between constrained and unconstrained scenarios for real generation and reduced costs at each particular generating plant and for each day and hour during the period being analysed.
- An aggregated analysis for each operational area (inter-area analysis) was carried out to estimate the behaviour of both real generation and reduced cost variations as a function of daily power demand in Colombia.
- A disaggregated analysis for each GENCO inside operational areas (intra-area analysis) was made for observing the behaviour of the proposed variables as a function of the hour of the day, which is also a proxy variable of daily power demand behaviour in Colombia.
Inter-area analysis
Figures 7 and 8 show the differentiated behaviour of average values for variables ΔGr and ΔCr in each operational area on an hourly basis, respectively.
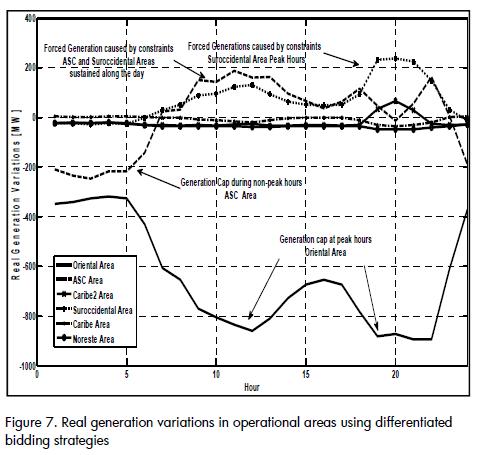
Regarding the average values for ΔGr in Figure 7,, a trend towards behaving as a generation cap was experienced by the Eastern area which was more severe during peak demand hours. Similarly, the ASC area behaved as a generation cap during the first hours of the day, but later became a generation window by following a very similar pattern to the daily power demand. This sustained behaviour as a generation window was also shared by the South-western area presenting the highest values for the system during peak hours. On the other hand, the remaining areas do not seem to have experienced appreciable variations in real generation except for the Caribe2 area which represented the highest thermal capacity resources in Colombia and tended to behave as a generation window during peak hours.
An approximated coordination of real generation variations among different areas might be observed (i.e. certain correlation between the appearance of both caps and windows in real generation might be observed in the different areas, suggesting that when some areas behave as generation caps, the rest behave as generation windows). Table 3 presents a correlation matrix of real generation variations to quantify this inter-areas coordination.
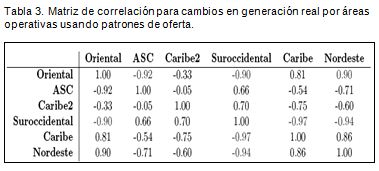
Table 3 resulta muy interesante observar los altos niveles de correlaciónshows the high negative correlation factors between the Eastern area and ASC and South-western areas, showing that GENCOs have knowledge of electrical network constraints and exploit such structural conditions in the Colombian power market throughout their bidding strategies. A very similar analysis might be inferred for the South-western Area compared to the North-eastern and Caribe areas there was almost perfect correlation (-0.97).
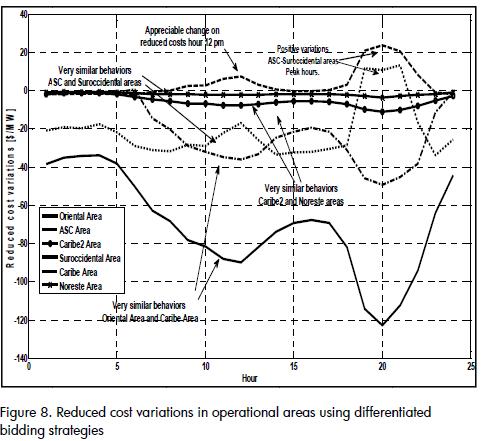
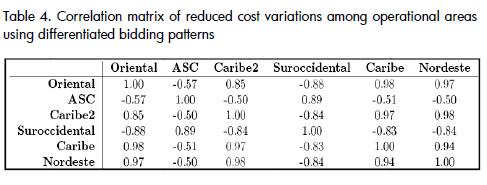
On the other hand, regarding average values for reduced cost variations shown in Figure 8,, great similarity among several areas can be clearly observed throughout the day. In fact, it is possible to detect a couple of areas moving in coordination (i.e. the Eastern and Caribe areas, along with ASC and South-western areas, had very similar behaviour). Nevertheless, one of the most interesting results in this simulation was that, most of the time, reduced cost variations presented negative values.
This situation suggested global mitigation of the effect that GENCOs have on system operation cost as a consequence of mutual competition through their bidding strategies.
Correlation analysis confirmed the great similarity between the above-mentioned couple of areas; these results are shown in Table 4 However, a very interesting negative correlation between reduced cost variations in the Eastern and South-western areas was appreciable, corresponding to the highlighted negative values in Table 4.
Intra-areas analysis
This section presents a disaggregated analysis for each operational area and each GENCO considered in this study. However, unlike intra-areas analysis using uniform bidding strategies, the analysis for differentiated strategies was slightly different. The main reason for achieving a different analysis was motivated by the high correlation values between both reduced cost variation and real generation variation for the same GENCO. Such high correlation values are shown in Figure 9 for the Eastern area which is a repeated situation for most of the modelled GENCOs in all operational areas.
Given this interesting situation, different correlation values could be estimated between reduced cost variations and real generation variations for each GENCO. These results are shown in Table 5.
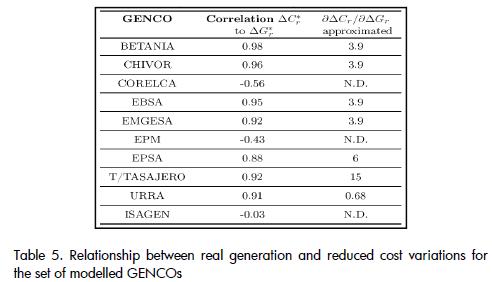
From the results in Table 5, most GENCOs presented greater than 90% correlation values, except for the ASC area (EPM and ISAGEN) and CORELCA GENCO. Regarding this majority, the results suggested that this relationship might be highly linear, implying that the Rcg ratio had invariable behaviour. Such linear behaviour is shown in Figure 10 by fitting data from both real generation variations and reduced cost variations to linear regression.
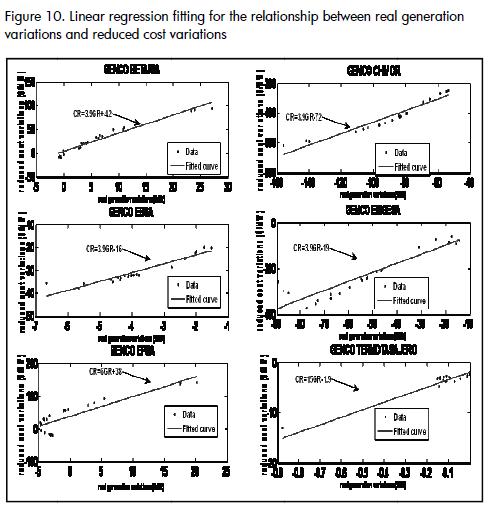
As a result of the linear regression fitting, the slopes of these lines might be interpreted as being the Rcg ratio. The values for this variable for each GENCO are shown in Table 5. However, it should be remembered that the sign of this Rcg ratio determined the type of relationship (direct or inverse) between these variations.
In particular, for the GENCOs located in the South-western area (BETANIA-EPSA), variations in reduced cost and real generation were always positive, implying that increases in generation windows corresponded to increments in impact on the system's operation cost (positive reduced costs).
On the contrary, the rest of the GENCOs in (Figure 10) always had negative variables, in spite of their positive values for the Rcg ratio, such value implying a completely different idea, given that increases in generation caps corresponded to decreases in impact on system operation cost (Figure 10),
Conclusions
This paper has thus presented a methodology for analysing the effect of transmission constraints on bidding strategies. This study's main contribution consists of an explicit representation of transmission network constraints and a methodology for analysing the effect of bidding strategies on expected real generation during power system operation. However, it should be stressed that the proposed methodologies are equally extendable to and valid for power markets having distinct particularities to the Colombian case.
The explicit implementation of the Colombian transmission system in a totally flexible and configurable simulation tool is a meaningful contribution towards simulating the Colombian power market.
Such implementation also allows using this tool as an experimental lab where some iterative and systematic simulations might be carried out with total control over demand profiles, bidding strategies and even power system configuration.
With the new set of proposed variables, the effect of electrical constraints becomes a measurable and comparative variable which, in many previous works, has been simplified, due to the complexities involved in a large-scale power system. These new variables allow quantifying how much GENCOs are needed in an electrically-constrained power system from two different approaches: dispatched energy quantities (generation caps or generation windows) and impact on system operation cost (mitigation or increased impact). These proposed variables might be used as a tool for measuring market power due to structural characteristics (electrical constraints on transmission lines) as well as the strategic bidding behaviour of GENCOs (bidding prices). The proposed methodology also allows the question about the size of the impact on system cost per each non-available MW to be resolved, which might be a very useful tool in Colombian power system planning.
The proposed methodology, using uniform bidding profiles, allows estimating the exclusive effect of transmission constraints, identifying possible structural problems in the power market. It is also possible to differentially model GENCOs inside their operational areas by establishing both generation windows and generation caps. Likewise, the proposal of progressively increasing national power demand allows estimating threshold demand values in which the effect of electrical constraints become appreciable. Some power demand values acting as thresholds particularly reveal great changes in real generation and reduced cost variations. This information is very useful for GENCOs because it allows determining how future increases in power demand will affect the one-bus model validity as an efficient payment mechanism (spot price). A multi-bus or local marginal pricing scheme might even be implemented from certain power demand values, more coherently reflecting the cost of marginal supply power demand.
On the other hand, the proposed differentiated strategies methodology allows mapping each GENCO's bidding strategies and the new set of variables allowing the impact of their strategies to be quantified regarding how much they are needed to supply national power demand. Even more so, compared to conventional market power indices, the obtained mappings are a better tool for representing dominant positions by considering transmission network constraints.
Given the results obtained in inter-area analysis coordinated behaviour was appreciable between operational areas, which might be confirmed in the calculated correlation matrices for generation caps and generation windows. Similar behaviour was appreciable in terms of reduced cost variations.
One of the most interesting results in the Colombian case was that strategic interaction among GENCOs (through bidding prices) has significantly mitigated the individual effect of GENCOs on system operation cost. This conclusion is based on the negative sign obtained for the reduced cost variations for most GENCOs modelled here, implying a global gain in ensuring increasing competition in the power market. However, it should be noticed that, even though such mitigation is appreciable, a considerable differentiation in each GENCO's reduced costs is also palpable.
Campuzano, C., Determinación de poder de mercado para los generadores en el sector eléctrico colombiano., Tesis de Maestría Universidad Nacional de Colombia Sede Medellín, 2002. [ Links ]
Contreras, J., M. Klusch., Numerical solutions to nash-cournot equilibria in coupled constraint electricity markets., IEEE Transactions on Power Systems, Vol. 19(1), 2004, pp. 195-206. [ Links ]
Daxhelet, O., Y. Smeers., Variational Inequality Models of Restructured Electricity Systems. Vol. Complementarity: Applications., Algorithms and Extensions, Kluwer Academic Publishers, 2001. [ Links ]
Gallego, L., Duarte, O., Modeling of bidding prices using soft computing techniques., Transmission and Distribution Conference and Exposition: Latin America, IEEE/PES, 2008, pp.1-7, [ Links ]
Gallego, L.; Duarte, O.; Delgadillo, A., Strategic bidding in Colombian electricity market using a multi-agent learning approach., Transmission and Distribution Conference and Exposition: Latin America, 2008 IEEE/PES, 13-15 Aug., 2008, pp.1-7. [ Links ]
Gallego, L. E., Modelamiento del comportamiento de la oferta de la energía eléctrica en el mercado colombiano., PhD thesis, Universidad Nacional de Colombia, 2008. [ Links ]
Green, R., Increasing competition in the british electricity spot market., Journal of Industrial Economics XLIV(2), 2001, pp. 205-216. [ Links ]
Green, R., Competition in generation: The economic foundations., Proceedings of the IEEE, 88(2), 2000. [ Links ]
Green, R., D Newbery., Competition in the british electricity spot market., Journal of Political Economy, 100(5), 1999, pp. 929-953. [ Links ]
Hobbs, B., Linear complementarity models of nash-cournot competition in bilateral and poolco power markets., IEEE Transactions on Power Systems, 16(2), 2001, pp. 194-202. [ Links ]
Hobbs, B., C., Metzler, J. S., Pang., Calculating equilibria in imperfectly competitive power markets: An mpec approach., IEEE Transactions on Power Systems 15, 2000, pp. 638-645. [ Links ]
Hobbs, B., J., Pang., Nash-cournot equilibria in electric power markets with piecewise linear demand functions and joint constraints., operations Research 55, 2007, pp. 13-127. [ Links ]
Jaramillo, A., La bolsa de energía eléctrica a la luz de la teoría de juegos., BSC thesis Maestría, Universidad Nacional de Colombia Sede Medellin, Facultad de Ciencias Humanas, 2002. [ Links ]
Jaramillo, A., E., Sanint., Las restricciones en el mercado eléctrico colombiano., Revista Energética, No 25, 2002, pp. 9-18. [ Links ]
Kirschen, D., Goran S., Fundamentals of Power System Economics., Wiley, 2005. [ Links ]
Murillo, C., R. Zimmermann., Matpower 3.2., 2007. http://www.pserc.cornell.edu [ Links ]
UPME., Plan de Expansión de Referencia Generación - Transmisión, 2006- 2020., Unidad de Planeación Minero Energética, 2006. [ Links ]
Ventosa, M., M., Rivier., A. Ramos., An mcp approach for hydrothermal coordination in deregulated power markets, in IEEE - PES Summer Meeting., Seattle, 2000. [ Links ]
Weber, J., T, Overbye., A two-level optimization problem for analysis of market bidding strategies., in Proceedings of the IEEE Power Engineering Society Summer Meeting'., Alberta, Canada, 1999. [ Links ]
Xu, H., E. J., Nash equilibria in electricity markets, Technical report, Australian Graduate School of Management., The University of New South Wales, Sydney, NSW 2052, Australia, 2001. [ Links ]

