


Serviços Personalizados
Journal
Artigo
 Inglês (pdf)
 Artigo em XML
 Referências do artigo
 Enviar este artigo por email
Indicadores
-
 Citado por SciELO
 -
 Acessos
Links relacionados
-
 Citado por Google
 -
 Similares em
SciELO
Similares em
SciELO -
 Similares em Google
Compartilhar

 Permalink
DYNA
versão impressa ISSN 0012-7353versão On-line ISSN 2346-2183
Dyna rev.fac.nac.minas v.78 n.170 Medellín dez. 2011
COMPARISON OF FREQUENCY RESPONSE AND NEURAL NETWORK TECHNIQUES FOR SYSTEM IDENTIFICATION OF AN ACTIVELY CONTROLLED STRUCTURE
COMPARACIÓN ENTRE TÉCNICAS DE RESPUESTA EN FRECUENCIA Y REDES NEURONALES PARA LA IDENTIFICACIÓN DE UNA ESTRUCTURA CON CONTROL ACTIVO
DANIEL GÓMEZ PIZANO
Magister en Ingeniería Civil , Universidad del Valle, Grupo de Investigación G-7, Cali, Colombia. dgomezp@univalle.edu.co
Received for review January 21th, 2011, accepted March 14th, 2011, final version April, 13th, 2011
ABSTRACT: System identification methodsare generally used to obtain the dynamic properties of structural systems. The dynamic properties are used for various purposes, such as model updating, structural health monitoring, and control synthesis. This paper presents the identification of an actively controlled structure with an active mass damper based on input-outputrelationships.The input signals include accelerations in the base of the structure and control force inputs while the output signals are the accelerations of the structure due to the inputs. In this paper, the system identification using frequency response functions iscompared with non-linear relationships obtained by using artificial neural networks (ANN) for bothasingle-input, single-output, and multiple-inputsingle-output (MISO) system. The results indicate that for the MISO structural system,the ANN technique providesa more accurate identification than identifications obtained with frequency responsemethods.
KEYWORDS: Structural dynamics and control, system identification, frequency response, artificial neural networks, MISOsystem
RESUMEN: La identificación de sistemas es un método que puede ser utilizado para obtener las propiedades dinámicas de un sistema estructural integrado por sensores, actuadores yun algoritmo de control, sometido a diferentes tipos de excitación. Estas propiedades dinámicas son utilizadas en varios propósitos, tales como: Actualización de modelos, Monitoreo de salud estructural y Sistemas de control. En este artículo se presenta la identificación de una estructura con un sistema de control activo colocado en la parte superior por medio de la relación entre las señales de entrada (movimiento en la base y fuerza de control) y la señal de salida (respuesta de la estructura). Para esto se utiliza la respuesta en frecuencia con funciones de transferencia y se compara con las relaciones no lineales obtenidas mediante Redes Neuronales Artificiales (RNA) de una entrada-una salida (SISO) y de múltiples entradas-una salida (MISO). Finalmente, se demuestra que la identificación del sistema estructural MISO con RNA presenta una mejor aproximación al sistema real que las obtenidas con la matriz de transferencia conformada a partir de funciones de transferencia.
PALABRAS CLAVE: Dinámica y control estructural, identificación de sistemas dinámicos,respuesta en frecuencia,redes neuronales artificiales,sistema MISO
1. INTRODUCTION
Excessive vibration produced by dynamic loads in civil structures can often cause discomfort to occupants and damage in structural and non-structural elements. Hence,when designing modern buildings,care should be taken such that the dynamic responseis always less thanthat which willcompromise the structural integrity of the buildingand also, there should be care given such that no discomfort is producedfor the building occupants.Moreover, considering the fact that more than 70% of Colombia's population livesin intermediate and high seismic threat zones,as defined by the Colombian Building Code for Earthquake-Resistant Design and Construction (Normas Colombianas de Diseño y Construcción Sismo Resistente NSR-10), it is necessary to guarantee that the structures will not suffer severe damage nor collapse due to such dynamic excitations[1].
In recent years, a wide variety of alternatives forreducing thedynamicresponse of structures have been proposed. Many of these alternatives, which include active, passive, hybrid, and semi-active control systems, have been implemented in flexible structures (skyscrapers, and cable-stayedbridges) in countries such as Japan and the USA. Unfortunately, in Latin American countries such as Colombia, there is still hesitancy within the engineering community regarding the implementation of these systems dueto a general lack of information and the high costs often associated with their implementation [2,3].
The effectiveness ofa control system depends in a great measure on the adequate identification of the plant to be controlled. The plant model can be defined withhigher order differential equations, state space representations, algebraic equations in the Laplace domain, and input-output relations [4]. System identification is a methodology used for buildingmathematical models of dynamic systems based on measurements of the system's inputs and outputs [5]. As the mathematical models obtained with system identification techniquesemulate the original system, they are often used forthe simulation, prediction, and detection of failures in chemical, physical, mechanical, biological, or economic processes [6].
2. DESCRIPTION OF THE DYNAMIC PROBLEM
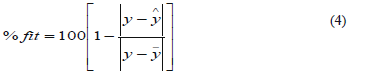
Civilstructures are subject to base excitation due to seismic activity. This type of load can be considered to be a pseudo-random signal with a broad frequency content that will excite structures of different dynamic characteristics. A single-story, steel-frame structure1.0 m high, 0.6 m long, and 0.3m wide was designed and built for laboratory testing on a shaking table. The structure has dynamical properties similar to those corresponding to the first mode of a representative full scale structure.An active mass damper driven by an electromagnetic actuator was installed on top of the laboratory structure to control the relative response of the system subjected to a random displacement of the base (Fig. 1). High precision accelerometers were installed at the base of the structure, at the story level of the structure, and on the active mass. The relative acceleration (the difference between the signal from the accelerometer on the structure and that at the base of the structure)was usedas the feedback signal and output measurement.
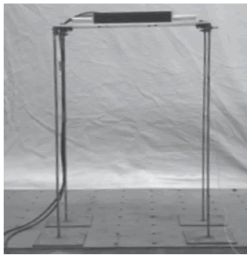
Figure 1. Structure with active mass damper control system (AMD)
Initially, system identification was necessary in the frequency range of interest in order to have an accurate plant model that could then be used to synthesize controllers. Due to the fact the actively controlled structure is simultaneouslyexcited by the base acceleration ÿbandthe control force fc produced by the active mass of the actuator, the structural response to both of these excitations must be considered.
A block diagram of the experimental setup is shown in Fig. 2. As shown, the plant (i.e.,the structure without the control system)has two inputs (control force fc and base acceleration ÿb) and one output (the relative acceleration of the structure ÿ)and hence is amultiple-input, single-output(MISO) system. This system can be decomposed into two single-input, single-output (SISO) systems. In this article, the system relating the base excitation ÿband the relative response of the structure ÿis denoted by G ÿ ÿb, and the system relating the relative response of structure ÿ and the control signalu is denoted by G ÿu.
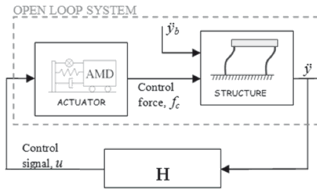
Figure 2. Block diagram of closed-loop and open-loop system
2.1 Structure subject to excitation on the base without control system
The effect of the excitation on the base of a conventional structure is illustrated in Fig. 3 in which the excitation is represented as an input signal, the structure as a stable dynamical system, and the response in the form of displacement, velocity, or acceleration,depending on the type of sensors used.
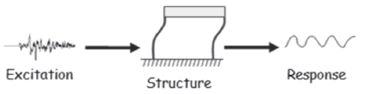
Figure 3. Seismic excitationand typical structural response [6]
Consideringthe structure as a one degree-of-freedom system, and applying the principle of dynamic equilibrium, the second order differential equation that describes the movement of the system is obtained as follows:

In Eq. 1,ms, cs, and ks are the properties of mass, viscous damping, and stiffness of the structure. The relative acceleration, velocity, and displacement of the structure with respect to the base acceleration ( ÿb) are denoted by ÿ, ý, and y, respectively.
2.2 Actively controlled structure subject to base excitation
An active mass damper control systems (AMD) is implementedonthe structures in order to reduceitsresponse to the base excitation.The AMD consists of a mass at the top of the structure that can be moved horizontally and hence counteract the movement of the structure produced by the base excitation (see Fig. 4). In this study, the AMD consists of an electromagneticlineal servomotor that was placed at the story level of the structure.
To determine the equations of motions of the structure and AMD, a two degree-of-freedom system is modeled as shown in Fig. 5.
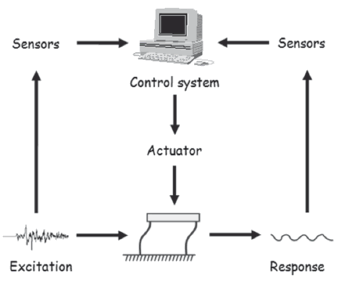
Figure 4. Seismic excitation andstructural response with active control system [6]
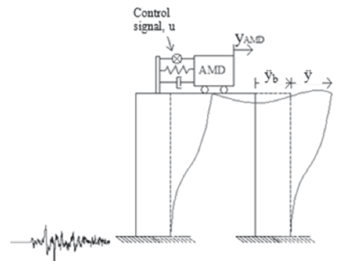
Figure 5. TwoDOF system under base excitation with active control system AMD
Equations of dynamic equilibrium were formulated for both the AMD and the structure as given in the following equations:
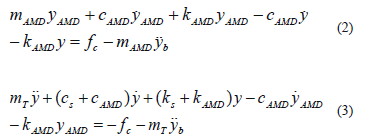
where mAMD is the active mass, and cAMD andkAMD are the equivalent damping and stiffness of the actuator. The acceleration, velocity, and relative displacement of the actuator with respect to the structureare denoted with ,
,  , and
, and , respectively. The control force generated by the lineal actuator over the structure is defined as fc .These equations describe the dynamics of the closed-loop system, including the control force fc produced by the AMD.
For the synthesis and implementation of the controllers, the feedback system shown in the block diagram in Fig. 2 is defined. This feedback system includes the actuator, the structure, and the controller H located in a disturbance rejection scheme.
3. DYNAMIC SYSTEM IDENTIFICATION
Civil structures such as bridges, dams, and buildings can be modeled as dynamic systems [4,7]. To simulate these systems, different excitations and the corresponding structural responses need to be measured and then formulated into input-output relations.
More specifically, the block diagram used is illustrated in Fig.6.It contains the blocks representing actuator dynamics and open-loop structure dynamics. Signal u defines the AMD control signal and corresponds to the signal sent from the processor to the actuator. Base excitation is denoted with ÿbandis known as the disturbance that affects theplant. The output is the relative structural response ÿ.
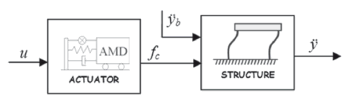
Figure 6. Block diagram of open-loop system
In 1996, Dyke [8] demonstrated the effect of the interaction between the control device and the structure on the system response by comparing the behavior of the AMD device when independent from the structure.In 1999, Dyke and Jansen [9] demonstrated that these transfer functions have an interaction that modifies the response and concluded that the open-loop system has to be identified with the device mounted on the structure to include the interaction effect.The latter was verified by Gómez et al. [10] byidentifying the different components of the control system (actuator, sensor, and structure) separately, and simulating the transfer functions in series. Therefore, to account for the interaction effect, the identification is done from the control signal u to the acceleration output. In this relationship, the force that the actuator exerts on the structure is included.
The system identification was carried out following the steps shown in Fig.7, and the input-output relationships were determined using frequency response functions and non-linear parametric methods. Transfer functionswere obtained from the frequency response by solving a least squares problem in the Laplace domain. The non-linear parametric methods were implemented using ARX and OE models represented by artificial neural networks (ANNs).
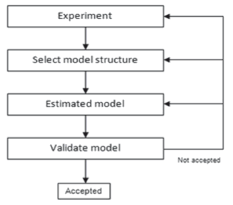
Figure 7. Steps in system identification [11]
Comparison and validation of results werecarried out in two ways: through their frequency responses from Bode diagrams and in the time domain through output variation according to Eq.4 implemented by Ljung [12] in theMATLAB System Identification Toolbox, where ý is the simulated output, ý is the experimental output, and y is the data mean.
In order to determine the relationship between the base excitation and the relative acceleration of the structure, the AMD wasmounted on the structure but the mass was locked into position so as to avoidrelative motion. The system that relates the relative response of the structure ÿ and the base excitation ÿb is G ÿÿb(see Fig. 8).
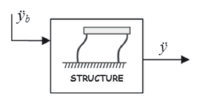
Figure 8. Block diagram of open-loop system with base excitation inputG ÿ ÿb
The base input was a linear sine sweep between 0.1 and 5 Hz with a duration of 240 seconds to reduce transient effects(See Fig.9). Anti-alias low-pass filters with 100 Hz cut-off frequencies were used and further filtering was performed with digitallow-pass filters with cutoff frequenciesof 10 Hz.

Figure 9. Filtered input and output signals
On the other hand, the dynamics of the structure including the lineal actuator was determined by the relation from the voltage signal sent to the AMD to the relative accelerationof the structure (output). In this case, the base of the structure was fixed, as shown in Fig. 10.
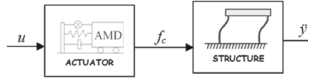
Figure 10. Block diagram of open-loop system with control signal inputG ÿu
Asine sweepbetween 0.1 and 10 Hz with aconstant amplitude of 0.5V and a duration of 240 seconds was sent to the AMD. In addition to anti-alias filters, digital low-pass filter with cut-off frequenciesof20 Hzwere applied to the signals (see Fig. 11).
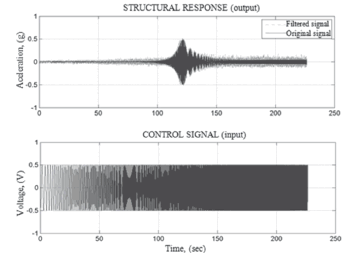
Figure 11. Filtered input and output signals
3.1 Identification through frequency response
3.1.1 Transfer function frombase excitationto structure
Astable,minimum phase, second-order transfer function was fitted to the frequency response functions (see Fig.12), using Matlab's vspectcommand with 16384 point Hanning windows in and an overlap of 50%. A natural frequency of 17.99 rad/s and damping ratio of 0.72% were identified for the structure, both valuesin agreement with results from free vibration tests.
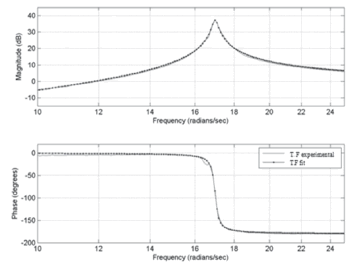
Figure 12. Transfer function fit of G ÿ ÿb
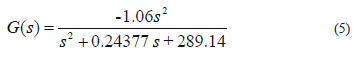
Equation 5 represents the open loop transfer function and ithas an 84% fit with respect to the experimental data.
For the validation of the transfer function, the structure was subject to a component of the 1999 earthquake in Armenia, Colombia. Base accelerations and the relative response of the structure were measured (see Fig. 13) and compared with the simulated output. A fit of 64% between the experimentaland simulated responseswas obtained.
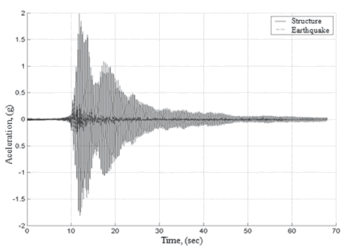
Figure 13. Base excitation andstructural response
3.1.2 Transfer function from control signal to structure
Astable transfer function of minimum phase was determined using the filtered signals corresponding to the control of the AMD and the response of the structure.This model implicitly contains the dynamics of the actuator and the structure; and hence it was identifiedasa fourth order system with the tffit function [13] as can be observed in the Bode diagram in Fig. 14.
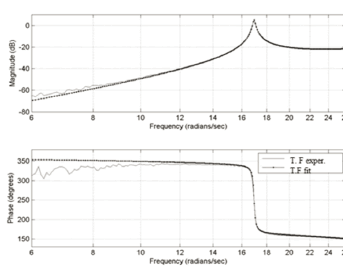
Figure 14. Transfer function fit ofG ÿu
Theresulting fourth order transfer function is given inEq.6 and has 4 poles, 2of which correspond to the mode of the structure with a frequency of 17.00 rad/s and a damping ratio of 0.72%. The other two poles have a frequency of 55.21 rad/s and a damping ratio of 47.17% and correspond to the dynamics of the structure/actuatorinteraction.
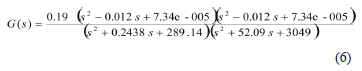
The time response of the transfer function has a fit of 63% with the experimental data used for the identification.A validation of the model usingan inverse sweep with initial frequency of 31.42 rad/sand final frequency of 0.63 rad/s gives a fit of 61.27%.
3.2 Identification usingneuronal networks
Neuronal networks have the capacity to approximate non-linear functions with non-linear relations among their variables [14].Multi-layerperceptron (MLP) networks are used for identification and validation and were implemented in the models NNARX and NNOE, as shown in Fig. 15. The difference in these topologies is the input data usedfor the neuronal network.Previous studies in this topic are Chen et al. [15], Adeli andJiang [16], and Carden andBrownjohn [17].In the NNARX model, the prediction of the output ý is obtained from the experimental data,consistingofbothinput u and output y. For the NNOE model, the output of the neuronal network is fedback and, with the corresponding delays, used as input forthe networkalong with the excitation signal u.This feedback makes NNOE model solelydependent on the experimental input data u.
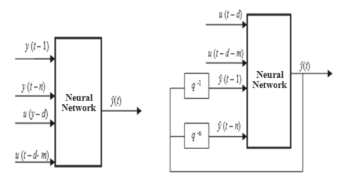
Figure 15. Artificial neural network: a) NNARX, b) NNOE[6]
3.2.1 Transfer function frombase excitationto structure
For the identification of the plant, a twohidden-layer network with 12neurons in each layer was used. Tangent sigmoidal activationfunctions were used for the neurons in the hidden layers and linear activation functions were used in theoutput layer. A resilient back-propagationalgorithm, ideal for large networks,was used for training the network. For the NNOE and NNARX models, 10output delays and 10input delays were used to predict one step, and hence the models are defined as NNOE(10,10,1) and NNARX(10,10,1).The sine sweep shown in Fig. 9 was used as the input for training. The responses of the NNOE and NNARX models have fits of 88% and 99%, respectively with respect to the experimental data.
For the validation of neuronal networks, the 1999 Armenia Earthquake ground motion was used, obtaining a fit of 79% for the NNOE network and 98% for the NNARX.
3.2.2 Transfer function from control signal to structure
Anetwork with two hidden layers, eachof12neurons with tangent sigmoidal activation functions, and an output layer with a linear activation function was used for the identification of the plant. The network was trainedusing aresilient back-propagationalgorithm. For this case, the NNOE and NNARX models have 12 delays in the output and 12 delays in the input to predict one step, and hence the models are defined as NNOE(12,12,1) and NNARX(12,12,1).The sine sweep shown in Fig.11 was usedfor the training. The fit of the response of theNNOE model with respect to the experimental response is 89.22% and for the NNARX it is98.45%.
An inverse sine sweep from 31.4 rad/s to 0.63 rad/s in 240 seconds was used for thevalidation of the neuronal networks. The result of the validation for the NNOE and NNARX models is a fit of 76.67%and 97.09%, respectively.
4. IDENTIFICATION OF MULTIPLE INPUT AND ONE OUTPUT (MISO)SYSTEM
Two additional tests were carried out to compare the effectiveness of the identification with two inputs and one output. The structure was excited with simultaneous base and AMD motionand the open-loop system with two inputs and one output was identified (Fig. 6).
The experimental responses are compared with the identified and simulated responses ofMISO systems formed by transfer functions and neuronal networks.
The signals used for the simulation of the response to simultaneous inputs are shown in Table 1. A representative case of the structural response to the Armenia earthquake base excitation and a simultaneous sine sweep input to the AMD is shown in Fig. 16.
Table 1. Experimental signal types
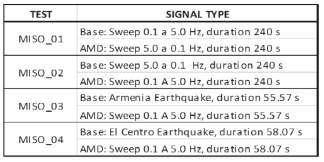
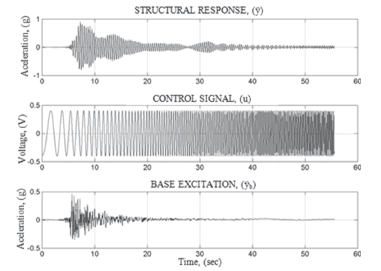
Figure 16. Trial signals MISO_03
4.1 Validation of transfer matrix.
The transfer matrix G defined in Eq.7 is composed of two SISO transfer functions, namely, the transfer function between simulator and relative response of the structure (G ÿ ÿb) and the transfer function between the control signal and the relative response of the structure(G ÿu). The block diagram of the two SISO transfer functions in parallel with linear addition of their outputs is shown in Fig. 17.

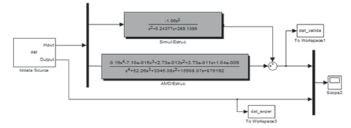
Figure 17. Block diagram of two-transfer-function MISO system
The transfer functions used in Fig.17 are those obtained with the frequencyresponse method as explained in Sections3.1.1 and 3.1.2. The validation of the response for one of the tests in Table 1 is shown in Fig. 18.
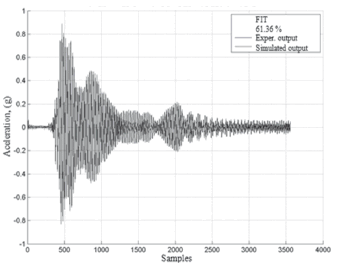
Figure 18. Response of the MISO system for testingMISO_03
4.2 Validation of two SISO neuronal networks
The four types of excitation shown in Table 1 were used for the validation of the MISO system conformed of the neuronal networks given in Sections 3.2.1 and 3.2.2.TheNNOE(10,10,1) neuronal network was used to simulate the relationship between the simulator and the NNOE (12,12,1) neuronal network was used to simulate the relation between the control signal and the structure (See Fig.19).
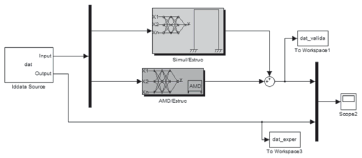
Figure 19. Block diagram of two-neural-network MISO system
The validation of the response for the MISO_03 test is shown in Fig.20. Overlap of NNARX networks was not consideredas this topology usesthe measured output instead of the output of the predictor vector, thus providing better results.
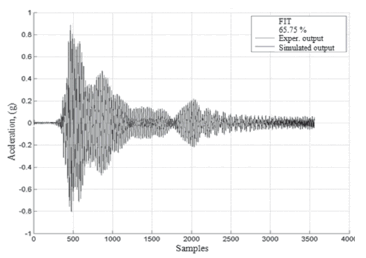
Figure 20. Response of the MISO system for testingMISO_03
4.3 Identification and validation of theMISO NNOE neuronal network
A network consisting of two layers of tangent sigmoidal activation functionsand an output layer with linear activation function was trained with a resilient back-propagation algorithm for the identification of the two-input, one-output system.The NNOE model has 10delays in the output and 20delays in the input. The first 10delays in the input are related tothe base excitation and the other 10correspond to the control signal. Hence, the model is defined as a NNOE(20,10,1) for one step prediction (seeFig.21).
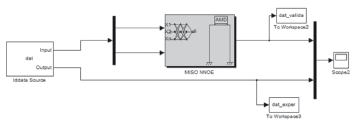
Figure 21. Block diagram of MISO system built from NNOE neural networks
Data from the MISO_01 testwas used for the identification of the model with two inputs and one output. The corresponding validation of the response of theNNOE model was done with the MISO_03 testdata. The comparison between the simulated and experimental data is shown in Fig.22.
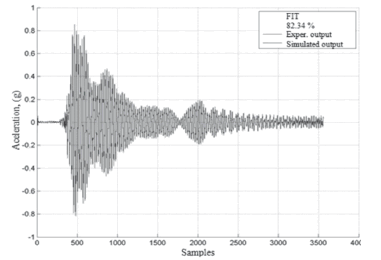
Figure 22. Response of the MISO system for testing MISO_03
4.4 Identification and validation of the MISO NNARX neuronal network
The neuronal network giveninSection 4.3 was used for the identification of the two-input, one-output system. However, the estimated output was not used as feedback and instead, the experimental output was used directly as a network input (see Fig.23).
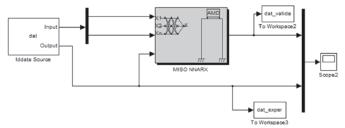
Figure 23. Block diagram of MISO system built from NNARX Neural Networks
Data from the MISO_01 test was used for the identification of the two-input, one-output model and data from the MISO_03 testwas used for the corresponding validation of theNNARX model response. The comparison between simulated and experimental data is shown in Fig.24.
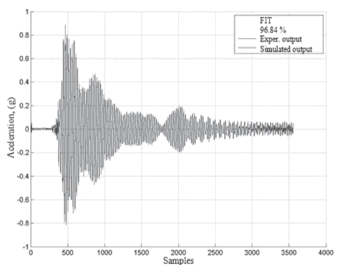
Figure 24. Response of the MISO system for testingMISO_03
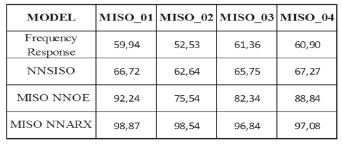
The MISO NNARX system produces a better fit than the MISO NNOE since the later does not feedback the predictedoutput. The fit percentages of the MISO models for the four tests are summarized in Table 2.
Table 2. Summary of fit percentages obtained with MISO models
5. CONCLUSIONS
The structural system (structure, sensors, actuator, and control algorithm)was identified using both SISO and MISO frequency response techniques and artificial neuronal networks.Two input signals (base excitation and AMD) acting simultaneouslyand an output signal (relative response of the structure) were considered in this work. Two SISO relations that make up the dynamic system were initially identified separately using frequency response andANN.Better fits to experimental datawere obtained forneural networks thanfor transfer functions, as the laterare linear, time invariant,and only account for the steady-state response. This aspect becomes more significant as damping decreasesdue to the effect of the transient response, and hence, special attention was paid to the experimental procedureto minimize the transient effects. The ANN, on the contrary, has the capacity of learning non-linear relations, such asactuator/structureinteraction.
Additionaltests were performed with both excitations acting simultaneously to compare the effectiveness of SISO and MISO relations in modeling system dynamics. Even though two SISO neuronal networks produced a better fit than the transfer matrix, neither model was considered acceptable as the corresponding fits were inferior to70%(see Table 2).Therefore a neuronal model based on a unique network capable of learning the dynamic properties of MISO systems was proposed. Two neuronal topologies (NNOE and NNARX) were created and compared with the two models consisting of SISO relations. The MISOmodels produce results superior to those obtained with SISO models with an average fitof 85% for the NNOE and 98%for the NNARX. However, as a NNARX topology would not be practical in real time applications, theMIMO NNOE neuronal network was chosen for the design, simulation, and implementation of the real time control system, which will be described in a future article.
ACKNOWLEDGMENTS
The author acknowledges the funding of Universidad del Valle and COLCIENCIAS through the project: Research and Technological Development of the Structural Monitoring and Control System to Reduce Vibrations Produced by Human/StructureInteraction(Investigación y desarrollo tecnológico de un sistema demonitoreo y control estructural para reducir las vibraciones producidas por la interacción humano/estructura)contract #003-2007.
REFERENCES
[1] Valencia, A., Ramírez, J.M., Gómez, D. y Thomson, P., Aplicación interactiva para la educación en dinámica estructural, Revista Dyna, No. 165, pp. 72-83, 2011. [ Links ]
[2] Gómez, D., Marulanda, J. y Thomson, P., Sistemas de control para la protección de estructuras civiles sometidas a cargas dinámicas, Revista Dyna, No. 155, pp. 77-89, 2008. [ Links ]
[3] Thomson, P., Sistemas de control estructural. Memorias del Primer Encuentro del Acero en Colombia, Cartagena, 2001. [ Links ]
[4] Erdogan, H. and Gülal, E.,Identification of dynamic systems using Multiple Input-Single Output (MISO)models, Nonlinear Analysis: real world applications, No. 10, pp.1183-1196, 2009. [ Links ]
[5] Quiroga,J., Cartes, D. and Edrington, C., Neural network based system identification of a PMSM under load fluctuation, Revista Dyna, No. 160, pp. 273-282, 2009. [ Links ]
[6] Gómez, D., Redes neuronales para la identificación y control de la respuesta estructural empleando un amortiguador de masa activa (AMD). Tesis de Maestría en Ingeniería Civil, Universidad del Valle, Cali, Colombia, 2010. [ Links ]
[7] Velez, W. and Gómez, D., Thomson, P., Ajuste de modelos de elementos finitos,Revista Dyna, No. 158, pp. 177-189, 2009. [ Links ]
[8] Dyke, S., Acceleration feedback control strategies for active and semi-active control systems: modeling, algorithm development, and experimental verification. Doctoral Thesis, Department of Civil Engineering and Geological Sciences, Notre Dame, Indiana, July 1996. [ Links ]
[9] Dyke, S., and Jansen, L., Implications of control-structure interaction in scaled structural control system testing. International Conference on Control Applications, Hawai'i, 1999. [ Links ]
[10] Gómez, D., Moncayo, H. y Thomson, P., Aspectos del modelamiento de estructuras para la implementación de sistemas de control activo. III Congreso Colombiano de Ingeniería Sísmica, Santiago de Cali, 2005. [ Links ]
[11] Norgaard, M., Ravn, O., Poulsen, M. and Hansen, L., Neural networks for modelling and Control of Dynamic Systems, Springer-Verlag, UK, 2000. [ Links ]
[12] Ljung, L., System Identification Toolbox: for use with Matlab, The Mathworks, MATLAB,2005. [ Links ]
[13] Thomson, P., TFFIT Personal Function, Algoritmo no publicado. Universidad del Valle, 2010. [ Links ]
[14] Ramasamy, S., Deshpande, P., Tambe, S. and Kulkarni, B., Neural networks for the identification of MSF desalination plants, Desalination, No. 101, pp.185-193, 1995. [ Links ]
[15] Chen, H. M., Qi, G. Z., Yang, J.C. and Amini, F., Neural network for structural dynamic identification, Journal of Engineering Mechanics, No.121, pp. 1377-1381, 1995. [ Links ]
[16] Adeli, H, and Jiang, X., Dynamic fuzzy wavelet neural network model for structural system identication, Journal of Structural Engineering (ASCE), 132(1), pp. 102-111, 2006. [ Links ]
[17] Carden, E. P. and Brownjohn, J. M., Fuzzy clustering of stability diagrams for vibration-based structural health monitoring, Computer-Aided Civil and Infrastructure Engineering,23(5),pp. 360-372, 2008. [ Links ]

