


Services on Demand
Journal
Article
 English (pdf)
 Article in xml format
 Article references
 Send this article by e-mail
Indicators
-
 Cited by SciELO
 -
 Access statistics
Related links
-
 Cited by Google
 -
 Similars in
SciELO
Similars in
SciELO -
 Similars in Google
Share

 Permalink
DYNA
Print version ISSN 0012-7353
Dyna rev.fac.nac.minas vol.83 no.197 Medellín May/June 2016
https://doi.org/10.15446/dyna.v83n197.44917
DOI: http://dx.doi.org/10.15446/dyna.v83n197.44917
Robust sample size for weibull demonstration test plan
Tamaño de muestra robusta para planes de demostración weibull
Manuel R. Piña-Monarrez a, Miriam L. Ramos-López b, Alejandro Alvarado-Iniesta c & Rey D. Molina-Arredondo d
Industrial and Manufacturing Dep. of the IIT Institute, Universidad Autónoma de Ciudad Juárez, Chihuahua, México. a manuel.pina@uacj.mx, b al127816@alumnos.uacj.mx, c alejandro.alvarado@uacj.mx, d rey.molina@uacj.mx
Received: August 13th, 2014. Received in revised form: September 07th, 2015. Accepted: March 11th, 2016.
This work is licensed under a Creative Commons Attribution-NonCommercial-NoDerivatives 4.0 International License.
Abstract
The efficiency of a Weibull demonstration test plan is completely determined by the total experimental time (Ta), which depends on the unknown sample size (n) and on the Weibull shape parameter (b). Thus, once b was selected, Ta depends only on n. Unfortunately, because n was estimated by the parametrical binomial approach, then if the confidence level C was higher than 0.63, n, and as consequence Ta, was overestimated, (For C<0.63, they were underestimated). On the other hand, in this paper, because the intersection between n and b, for which Ta was unique, was found with n depending only on R(t), then the estimation of Ta was optimal. On the other hand, since once b was selected, h was completely determined, then b and h were used to incorporate the expected failure times of the operational level in an accelerated life test analysis (ALT). Numerical applications are given.
Keywords: Weibull demonstration test plan, Success run testing, Lipson equality, Accelerated life testing.
Resumen
La eficiencia de un plan de demostración Weibull está completamente determinada por el tiempo total de experimentación (Ta) el cual depende del tamaño de muestra desconocido (n) y del parámetro de forma Weibull (b). De esa forma, una vez que b fue seleccionada, Ta depende sólo de n. Desafortunadamente, debido a que n es estimada a través del método binomial paramétrico, entonces si el nivel de confianza C es mayor de 0.63, n y como consecuencia Ta, son sobre-estimados (para C<0.63, estos son subestimados). Por otro lado, en este artículo, debido a que la intersección entre n y b, para la cual Ta es única, se encontró con n dependiendo sólo de R(t), entonces la estimación de Ta es óptima. Por otro lado, dado que una vez que b fue seleccionada, h está completamente determinada, entonces b y h fueron utilizadas para incorporar los tiempos de falla esperados del nivel operacional en un análisis de prueba de vida acelerada (ALT). Aplicaciones numéricas son dadas.
Palabras Clave: Planes de demostración Weibull, Rachas exitosas, Desigualdad de lipson, Pruebas de vida acelerada.
1. Introduction
In reliability engineering, because of its flexibility the Weibull distribution is one of the most commonly used probability density functions to model the behavior of a product or process trough the time [6]. Moreover, since the lower reliability index could be seen as an index of stability (quality through the time), the Weibull demonstration test plans are performed without failures in order to determine whether the product fulfills its designed reliability R(t). On the other hand, to perform the test plan, we must know; R(t), the designed life time (td), the operational environmental, the desired confidence level (C) and the Weibull shape parameter b. Regardless of this knowledge, given that the test plan is completely determined by the total experimental time Ta, and because for a known b , Ta depends only on the sample size n, then the efficiency of the test plan depends on the accuracy with which n is estimated. In practice, the parametrical binomial approach, considering a constant failure rate p ([2] chapter 9, [5] and section 2.2), is used to estimate n. Unfortunately, if C higher than 0.63, n is overestimated, and as a consequence Ta is overestimated too. To solve this problem, and based on the fact that for constant b, Ta is directly related to the Weibull scale parameter h, then based on the addressed relations among h, n, R(t) and b, and on the found intersection between n and b for which Ta is unique, in this paper a method to estimate n in closed form, but independent of b, is given. Moreover, because n was found to be depending only on the known R(t) index, the estimated Ta is completely representative of the designed test plan.
On the other hand, in order to show how to proceed under time or lab restrictions, by using the above estimated n, the Lipson equality is applied to perform a tradeoff between n and the experimental time Ti for which Ta is constant. Finally, because n is directly related with R(t), in section 5.1, we show how it could be used in the median rank approach to incorporate the expected lifetimes of the operational level if an accelerated life test analysis (ALT) has to be used. The paper structure is as follows. Section 2 addresses the problem statement. Section 3 presents the proposed method. Section 4 offers the application and comparison between the proposed method and the binomial approach. Section 5 outlines the steps to incorporate the failure times of the operational level into the ALT analysis. Section 6 presents the conclusions. Finally, the paper ends with the references in section 7.
2. Problem statement
Since a Weibull demonstration test plan is performed without failures, the Weibull parameters b and h could not be estimated. Thus, the efficiency of the test plan depends completely on the accuracy on which Ta is estimated. But, because Ta for constant b depends only on n, then the efficiency of the test plan now only depends on the accuracy with which n is estimated. Regardless of this, since n is estimated by the parametrical binomial approach considering a constant failure rate p, and a confidence interval C, then when C higher than 0.63 is selected, n is overestimated and for C lower than 0.63 n is underestimated. The overestimation (or underestimation) of n directly implies that Ta is overestimated (or underestimated) also. Observe that this means that the test plan fails to demonstrate whether the product fulfills its designed R(t) index. On the other hand, although in practice, b is selected from a historical data set (or engineering knowledge), because its value depends on the material characteristics [18], and on the variability of the manufacturing process [13], here the analysis is presented in two parts. The first is conducted to address the effect that the uncertainty of b has on Ta, and the second is conducted to statistically identify the disadvantages that the use of the binomial approach has on the estimation of n. To do this, let us first present the b analysis.
2.1. Shape parameter analysis
Since for non-failures Weibull analysis Ta is cumulated as
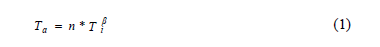
Where Ti is the unite experimental time, which is selected as the designed time (Ti = td), the value of b has a big impact on Ta, [see [12] and [15] sec. 2.3] and because in the Weibull demonstration test plan there is no failures information to estimate b, and due to the fact that its estimation depends on the variability of the manufacturing process [13], in practice b is selected from tabulated data sets. Moreover, because of the Weibull closure property (b has to be constant), once the b value is selected it has to be considered constant in the analysis [16]. On the other hand, regardless which value of b we had selected, once it was assigned, the efficiency of the test plan depends on the scale parameter h. Thus, we are now interested in how to estimate Ta in function of h. However, because there are no failures, the lower expected limit of  has to be used. That is, that the lower limit of h, here called (hL), has to be estimated. According to [10] and [11], hL is given by
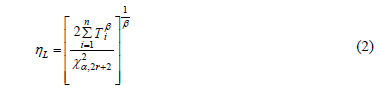
Where a is the significant level and r is the number of observed failures. On the other hand, since equation (2) for zero failures, with C representing the desired confidence level and Ti equal to td, is given by
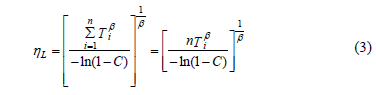
Then by selecting  in (3), the relation between hL and Ta is given by

Clearly from (4), Ta is in function of b, which in practice is selected from a data set (or engineering knowledge). Now, let us focus on the uncertainty of n.
2.2. Binomial approach analysis
Given that the Weibull demonstration test plan, the parametric binomial approach used to determine n (see [2] and [5] chapter 9) is based on the binomial distribution given by
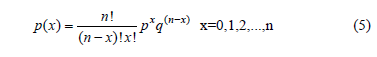
which, instead of considering the time and the risk function to determine n, considers a constant failure rate p and a confidence level C to model the uncertainty on R(t), then n is not optimal. Given this, first let us analyze how the estimation of n is formulated. In doing so, we can see that because no failures are allowed (x=0), the lower confidence of R(t) has to be used. Thus, C based on the fact that if n items are tested and k=1, , n of them fails, C is given by
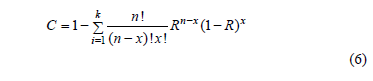
In (6), R represents the lower confidence of R(t). In (6), R is used instead of R(t) because the binomial approach does not consider the time variable t. Therefore, equation (6) with zero failures  is given by

Finally, by rearranging terms, n is given by

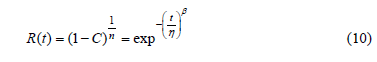
Function (8) is known as success run testing [5]. Second, suppose that our customers are asking us to demonstrate using C=0.90, if their product fulfills R(t)=0.96 for td=1500hrs. In addition suppose, that from historical data, we know that b=2.5. Thus, by using (8), we have to test without failures n=57pcs for 1500hrs each. Thus, observe from (1) that Ta=57*1500^2.5=4967101142 and from (4) that h=7558.59718. With this information, since we now know b and h, then by using these parameters in the Weibull reliability function given by

We note that the demonstrated R(t), for td=1500hrs, is R(t)=0.9826, instead of the planned R(t)=0.96. Thus, because R(t) and b are known, we conclude that the C value used in (8) overestimated n, and that, as a consequence, Ta defined in (1) was overestimated too.
In contrast, observe that for C=0.50, n=17pcs, Ta=1481416130 and h=4658.7652, with R(t)=0.9428. That is to say that for C=0.50, n was underestimated. Thus, a C value between 0.5 and 0.9 for which n is optimal exists. In the next section, this value is statistically addressed and generalized to any desired R(t) and b value.
3. Proposed method
Given that the goal of the proposed method is to remain practical, first let us show how the binomial approach, the Lipson equality, and the Weibull reliability function are related. In doing so, we can first see that because Ta completely determines R(t), the analysis is based on Ta. Second, we can see that for constant b, Ta depends only on n. Finally, note that regardless how b, and n were estimated, once their values were selected, a tradeoff between n and Ti for which Ta remains constant could be made by applying the Lipson equality (see [5]) as follows. The Lipson equality is formulated by replacing R given in (7) with the Weibull reliability function defined in (9). After the replacement, the equality is given by
From (10), by taking logarithms and by rearranging terms, the sample size n in the Lipson equality is given by

In (11), L represents one life of the product L= td. Function (11) is known as Lipson equality (or extended life approach) and it relates the binomial approach and the Weibull reliability function. Finally, from (11), it is clear that it works regardless of how n and b were selected. Thus, in the same way as Ta, its efficiency depends on how n is estimated.
On the other hand, in order to estimate Ta accurately, by substituting (8) in (2), hL is found to be depending only on R(t) and b as in (12).

Then based on (12), and by selecting n as in (13).

the relation between Ta and hL as in (4), is given by

From (14), Ti is given by

And clearly, since there no failures are allowed, then we can select  , thus h is given by

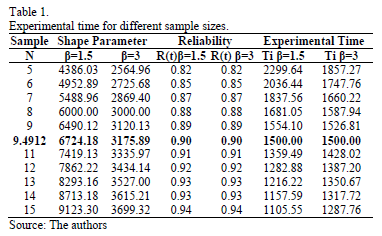
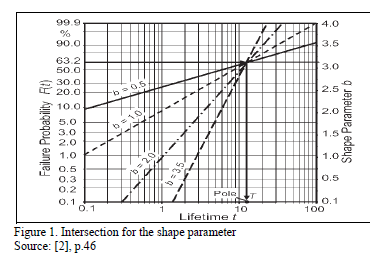
From (16), since is known, and n is directly related to R(t) as in (13),  now depends only on the selected b value. On the other hand, observe that n in (13) is estimated regardless of the value of b. Seeing this numerically, suppose we are determining hL defined in (12) by a designed time td=1500hrs, and suppose we desire to demonstrate a reliability of R(t)=0.90. Furthermore, suppose that from historical data (or engineering knowledge), we know that b ranges from 1.5≤ b ≤3. Then by testing different n values for b=1.5 and b=3, as in Table 1, we found that Ti shifts its behavior from higher to lower, implying that an intersection for which Ti is equal to both b values exists. And because, this intersection corresponds exactly to the n value defined in (13), and it does not depend on b, we conclude that by estimating n using (13), the proposed method is robust under the uncertainty that b has over Ta. In particular, we can see from Table 1 and Fig. 1 that for n is as in (13) and R(t) is as expected for both values of b, and that hL is as in (12).
That is, data in this intersection holds with equations (12) to (16). The steps to apply the proposed method are as follows.
3.1. Steps of the proposed methodIn order to demonstrate whether a product fulfills its designed reliability, the following steps were taken.
- Determine the reliability level R(t) index to be demonstrated, the operational environmental to be tested and the design time td.
- Determine the value of b to be used. A base line product, engineering knowledge or historical data could be used to select the most suitable b value.
- By using (13) with the R(t) level of step 1, determine the sample size n to be tested without failures during the td lifetime each.
- If there are experimental or time restrictions, perform the desired tradeoff between n and td, using (11) with C=0.63212.
- Test each specimen by td lifetime and, if neither of them fails, go to step 6. If one of them fails, go to step 7.
- By using (12) or (16), estimate the expected hL value. And by using hL, td and the selected b value in (9), determines the demonstrated R(t) value, and draw your conclusions.
- Correct and reinforce the design (or process) and go to step 1.
- If you are performing an accelerated life testing, and the normal operational conditions could not be applied to the experiment, follows the steps given in section 5.1.
4. An application
As an application, first consider the data in section 2.2, (R(t)=0.96, C=0.90 and C=0.50, td=1500hrs and b=2.5), With this information obtained by using (13) in step3, we have to test n=24.49≈25pcs for 1500hrs each. And by using (1) or (14) with b=2.5, Ta=2134685635hrs and by using (12) or (16), hL=5391.797. Thus, by applying (9) the demonstrated reliability, is R(t)=0.96 as was planned.
On the other hand, suppose that because of the lab capacity, we can run each test for no more than 3000hrs; (L=2lifes), then by using (11) with C=0.63212, we have to run n=4.33≈5pcs without failures for 3000hrs each, and from (1) or from (14)  and from (12) or (16) hL=5710.96hrs, and by using hL in (9), the demonstrated reliability, as planned, is R(t)=0.96.
Finally, since n in (13) depends only on R(t), and because R(t) is used in the response variable of the median rank approach, in the next section, n is used to incorporate the expected normal operational lifetimes into an accelerated life time analysis.
5. Weibull accelerated life test planning
In Weibull accelerated life test analysis (ALT) for constant and interval valued variables, the shape parameter b is considered constant in the analysis due to the Weibull closure property [16]. Thus, the reliability index R(t) depends only on h ([4], [7] and [9]), which in ALT is estimated as a linear function of the covariates by using a life/stress models  [1], [3], [7] and [10], as follows
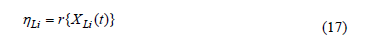
Here, it is important to note that in (17) for constant over time stress variables is parametrized as
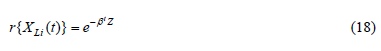
Where b is a vector of regression coefficients to be estimated and Z is a vector of the effect of the related stress variable (e.g. in Arrhenius Z=1/T where T is the temperature in Kelvin degrees). Thus, by using the Weibull density function given by
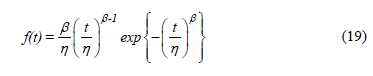
the Weibull/life/stress parameters are estimated by substituting h in (19) with the corresponding model defined in (17) or (18). For example suppose that the stress variable is the temperature, then the Arrhenius model is used. The Arrhenius model is given by

Thus, the Weibull/Arrhenius model is given by
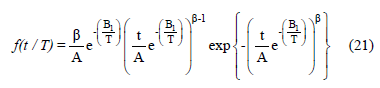
in (21) the Weibull/Arrhenius parameters are estimated in joint form by using the maximum likelihood method.
On the other hand, observe that the lifetime data is collected by using an experiment design (DOE) (see Table 2), and that for each replicated level, we estimate its corresponding Weibull parameters.
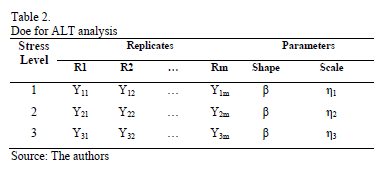
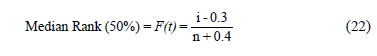
Thus, since, as in (16), n in the DOE determines the accuracy with which h is estimated, in order to show how n could be used to incorporate the expected failure times in an ALT analysis, first note that because under multiple linear regression, the Weibull parameters of each replicate level of the DOE are estimated by the median rank, approximation given by
where, i represents the ordered rank statistic and F(t) is the empirical estimation of the cumulative probability function [F(t)=1 - R(t)], then (22) highly depends on n too. Second, observe that because (22) was constructed based on an area given by  (for details see [8]), where b represents the amplitude (width) of the (n-1) intervals given by
  which for high percentiles (p>0.85) tends to be R(t)
  (e.g. for
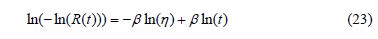
 ), then because n in (13) depends only on R(t) and since R(t) is generally higher than 0.85, then the use of (13) in (22) is useful. On the other hand, by taking the linear form of (9) as
The expected times of the operational level can be estimated and incorporated to the ALT analysis as in the next section.
5.1. Application to ALT analysis.
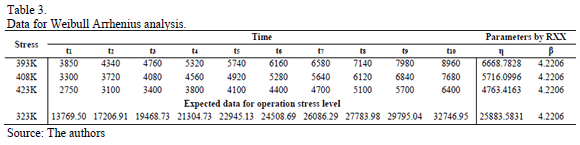
As an application, let us use data given in Table 3. Data was published by [17]. Suppose the normal operational temperature level is 323K and the design time is td=15000hrs. The analysis to incorporate the expected lifetimes of the 323K level into the analysis is as follows.
- For each ALT level, by applying (13) with the desired R(t) level, determine the number of replicates to be tested. Here R(t)=0.90 was used, thus n=10pcs.
- Perform the experiment, and for each replicated level, estimate the Weibull parameters b and h (here b should be constant).
- Using the estimated n and b value in (16), estimate the corresponding hL value. (here it is hL =101/4.2206 (15000)=25883.58312hrs).
- Using (22) with n given by (13), estimate the expected R(ti) value for each of the order statistics. Then by using these R(ti) values, the b and the hL values in (23), solve (23) to ln(t) and then determine the expected failure times of the operational level to each order statistic. (In our case, the expected failure times appear in the last row of Table 3).
- By using the incorporated expected times, and the experimented accelerated lifetimes, perform the estimation of the Weibull/Life-stress parameters. Here, the analysis, by using the ALTA routine and (21), yield to b=4.3779, B=2308.4884 and A=19.8667.
- Finally, by using the parameters of step 5, determine the desired reliability indexes.
To conclude, observe that the data in Table 3, for td=15000, R(t) is of R(t)=0.90 as was expected. In particular, note that without incorporating the operational times, the estimated R(t) for the operational level is of 323K, instead of the designed R(t)=0.90, would be R(t)=68.33%.
6. Conclusions
In Weibull demonstration test plans, the binomial approach for confidence levels higher (lower) than 0.63212, overestimate (sub-estimate) R(t); thus, C should not be selected lower than 0.63212, and if it is selected higher, it should be selected close to 0.63212, say 0.7. In the proposed method, given that n depends only on R(t) which is always known, the designed and the demonstrated R(t) value always holds. On the other hand, observe that because data is gathered by using an experiment design where each row represents a different form to run the process, then the b parameter does not remain constant and as a consequence, the multivariate approach using the Taguchi method as in [14], should be used. Given that in the estimation process, the value of b depends on the variance of the logarithm of the failure times, which depends on the control of environmental factors (see [13] and [14]), its value must be selected from a data set that covers the variability of the manufacturing process in its interval.
Although, the proposed method allows practitioners to incorporate the expected operational times to the ALT analysis, it is important to note that their efficiency corresponds to the efficiency of the median rank approach and on the assumption of a constant b. Finally, it is important to note that although it may seem that n could be used to incorporate the expected times in the ALT analyses where the Weibull closure property does not hold (b is not constant), as is the case of ALT analysis with several variables, more research is required.
References
[1] Bagdonaviĉius, V. and Nikulin, M., Accelerated life models, modeling and statistical analysis, Ed. Chapman and Hall/CRC, Boca Ratón, FL, USA, 2002. [ Links ]
[2] Bertsche, B., Reliability and automotive and mechanical engineering, 1ra. ed., Stuttgart, Springer-Verlag Berling Heidelber, 2008. DOI: 10.1007/978-3-540-34282-3. [ Links ]
[3] Cox, D.R. and Oakes, D., Analysis of survival data, 1st Ed, Chapman and Hall, Boca Ratón, FL, USA, 1984. [ Links ]
[4] Escobar, L.A. and Meeker, W.Q., A Review of accelerated test models. Statistical Science, 21(4), pp. 552-577, 2006. DOI: 10.1214/088342306000000321. [ Links ]
[5] Kleyner, A.V., Reliability demonstration: Theory and application. Reliability and Maintainability Symposium (RAMS). Las Vegas, USA, Tutorials CD, 2008. [ Links ]
[6] Manotas, E., Yañez, S., Lopera, C. y Jaramillo, M., Estudio del efecto de la dependencia en la estimación de la confiabilidad de un sistema con dos modos de falla concurrentes. DYNA. 75(154), pp. 29-38, 2007. [ Links ]
[7] Meeker W.Q. and Escobar L.A., Statistical methods for reliability data, New York, John Wiley & Sons, USA, 2014. [ Links ]
[8] Mischke, C.R., A distribution-independent plotting rule for ordered failures, Journal of Mechanical Design, 104(3), pp. 593-597, 1979. DOI: 10.1115/1.3256391. [ Links ]
[9] Nelson, W.B., Accelerated testing statistical models, test plans and data analysis, John Wiley & Sons, New York, USA, 2004. [ Links ]
[10] Nelson, W.B. Applied life data analysis, John Wiley & Sons, New York, USA, 1985. [ Links ]
[11] Nelson, W.B., Weibull analysis of reliability data with few or no failures, Journal of Quality Technology, 17(3), pp. 140-146, 1985. [ Links ]
[12] Nicholls, D. and Lein, P., Weibayes testing: What is the impact if assumed beta is incorrect?, Reliability and Maintainability Symposium (RAMS), Fort Worth, Texas, Tutorials CD, 2009. [ Links ]
[13] Piña-Monarrez M.R., Avila-Chavez C. and Marquez-Luevano C.D., Weibull accelerated life testing analysis whit several variables using multiple linear regression, DYNA, 82(191), pp. 156-162, 2015. DOI: 10.15446/dyna.v82n191.43533. [ Links ]
[14] Piña-Monarrez, M.R. and Ortiz-Yañez J.F., Weibull and lognormal Taguchi analysis using multiple linear regression. Reliability Engineering and System safety. 144, pp. 244-253, 2015. DOI: 10.1016/j.ress.2015.08.004 [ Links ]
[15] Rinne, H., The Weibull distribution a handbook, CRC press, Boca Ratón, FL, USA, 2009. [ Links ]
[16] Tobias, P. and Trindade, D., Applied reliability. Chapman and Hall/CRC, Boca Ratón, FL, USA, 2012 [ Links ]
[17] Vassiliou, P. and Metas, A., Understanding accelerated life-testing analysis, Reliability and Maintainability Symposium (RAMS), Tutorials CD, Seattle, WA, USA, 2002. [ Links ]
[18] Weibull, W., A statistical theory of the strength of materials. Stockholm: Generalstabens litografiska anstalts förlag. 1939. [ Links ]
M.R. Piña-Monarrez, is a researcher-professor in the Industrial and Manufacturing Department at the Autonomous University of Ciudad Juarez, Mexico. He completed his PhD. in Science in Industrial Engineering in 2006 at the Technological Institute of Ciudad Juarez, Mexico. He had conducted research on system design methods including robust design, design of experiments, linear regression, reliability and multivariate process control. He is member of the National Research System (SNI-1), of the National Council of Science and Technology (CONACYT) in Mexico. ORCID: 0000-0002-2243-3400.
M.L. Ramos-López, is a PhD. student on the doctoral program in science and engineering (DOCI), at the Autonomous University of Ciudad Juarez, Mexico. She completed her MSc. degree in Industrial Engineering in 2012 at the Universidad Autónoma de Ciudad Juarez, Mexico. Her research is based on accelerated life time and weibull analysis. ORCID: 0000-0001-8614-1311.
A. Alvarado-Iniesta, is a researcher professor in the Industrial and Manufacturing Department at Universidad Autónoma de Ciudad Juárez, Chihuahua, Mexico. He completed his PhD. in Industrial Engineering in 2011 at New Mexico State University, Las Cruces, NM, USA. His research interests focus on Operations Research. He is member of the National Research System (SNI-1), of the National Council of Science and Technology (CONACYT) in Mexico. ORCID: 0000-0002-3349-4823
R.D. Molina-Arredondo, is a researcher-professor in the Industrial and Manufacturing Department at the Autonomous University of Ciudad Juarez, Mexico. He completed his PhD. in Science in Industrial Engineering in 2009 at the Technological Institute of Ciudad Juarez. He had conducted research on reliability and robust design. ORCID: 0000-0001-8482-4186.

