Serviços Personalizados
Journal
Artigo
Indicadores
-
 Citado por SciELO
 -
 Acessos
Links relacionados
-
 Citado por Google
 -
 Similares em
SciELO
 -
 Similares em Google
Compartilhar
DYNA
versão impressa ISSN 0012-7353
Dyna rev.fac.nac.minas vol.83 no.197 Medellín maio/jun. 2016
https://doi.org/10.15446/dyna.v83n197.50919
DOI: http://dx.doi.org/10.15446/dyna.v83n197.50919
Symbolic modeling of the Pareto-Optimal sets of two unity gain cells
Modelado simbólico del conjunto Óptimo de Pareto de dos celdas de ganancia unitaria
Said Polanco-Martagón a, José Ruiz-Ascencio b & Miguel Aurelio Duarte-Villaseñor c
a Departamento en Tecnologías de la Información, Universidad Politécnica de Victoria, Cd. Victoria, México, spolancom@upv.edu.mx
b Laboratorio de Inteligencia Artificial, Centro Nacional de Investigación y Desarrollo Tecnológico (CENIDET), Cuernavaca, México, josera@cenidet.edu.mx
c Cátedra CONACYT, Instituto Tecnológico de Tijuana, Tijuana, México, miguel.duarte@tectijuana.edu.mx
Received: May 29th, de 2015. Received in revised form: November 20th, 2015. Accepted: December 16th, 2015
This work is licensed under a Creative Commons Attribution-NonCommercial-NoDerivatives 4.0 International License.
Abstract
A method to data-mine results of an analog circuit sizing in order to extract knowledge that can be immediately used by designers or students of analog integrated circuit design is presented. The symbolic models, which have been generated using multi-objective genetic programming, are human-interpretable mathematical models. The procedure presented involves two steps: the generation of samples of Pareto-optimal performance sizes of two unity gain cells using the NSGA-II genetic algorithm; and the generation of models of each of the objectives sized by symbolic regression via genetic programming. The functionality of the method to describe circuits is shown in three cases: two current followers and one voltage follower.
Keywords: Symbolic Models, Symbolic Regression, Genetic Programming, White-box models, Multi-objective Optimization, Analog Circuit Sizing, Analog Circuit Design.
Resumen
En este trabajo es presentado un método para extraer datos acerca de los resultados de un dimensionamiento de circuitos analógicos para extraer características que puede ser inmediatamente utilizado por diseñadores o estudiantes de diseño de circuitos integrados analógicos. Los modelos simbólicos que han sido generados utilizando Programación Genética Multi-Objetivo son modelos matemáticos humano interpretables. El procedimiento presentado abarca dos etapas: la generación de muestras del frente de Pareto de las dimensiones con desempeño óptimo de dos celdas de ganancia unitaria mediante el algoritmo genético NSGA-II; y la generación de modelos de cada uno de los objetivos del dimensionamiento utilizando regresión simbólica vía programación genética. La funcionalidad del método se muestra al describir tres casos: dos seguidores de corriente y un seguidor de voltaje.
Palabras clave: Modelado Simbólico, Regresión Simbólica, Programación Genética, Modelos trasparentes, Optimización Multi-Objetivo, Dimensionamiento de circuitos analógicos, Diseño de Circuitos Analógicos.
1. Introduction
Analog integrated circuit (IC) design using Metal Oxide Semiconductor Field-Effect-Transistors (MOSFETs) imposes challenges in sizing and selecting the right circuit topology, because of the huge plethora of feasible active devices [1-4]. The sizing problem is about finding the optimal width and length (W, L) values of the MOSFETs, to guarantee optimal performance of active filters, oscillators, sensors and so on [5-8]. The problem of choosing the right circuit topology is known as circuit synthesis [2,3,9] and it is accompanied by a sizing procedure. The selected topology must accomplish a specific function where optimal behavior is achieved through the appropriate sizing (W, L) of MOSFETs. Thus, sizing is the main problem encountered when trying to meet target requirements, such as wider bandwidth, lower power consumption and gain, all at the same time. However, some of these objectives are in conflict with each other, thus, a multi-objective optimization is required [10]. The sizing problem for analog integrated Circuit is more complex than for digital IC due to the very large quantity of performance parameters, and the complex correlation between them.
The basic cells for designing analog ICs are known as Unity Gain Cells (UGC) [9]: Voltage Follower (VF), Current Follower (CF), Voltage Mirror (VM) and Current Mirror (CM). Among these basic cells VFs and CFs have had much interest in the recent technical literature because of their use, as an alternative to other more complex building blocks in the design of analog circuits such as: universal biquad filters, sinusoidal oscillators, impedance converters, precision rectifiers, chaotic oscillators, and so on [5-8,11].
The selection of optimal sizes of MOSFETs is a key factor in achieving higher analog IC performance. Therefore, the understanding of circuits that a designer could have is the main ingredient for improving those circuits and thus the circuit design will be more effective. However, the highly nonlinear behavior and complexity of analog IC makes it difficult to obtain insight in a method.
Data-driven modeling (DDM) can help to create models that capture the behavior of analog ICs and also to increase a designer's knowledge of analog ICs. However, the models created using some DDM techniques do not show the functional relationships between input and output parameters.
Human-interpretable mathematical models can be deployed to capture the optimal performance behavior and to find the MOSFET sizes behind it. Symbolic analysis and symbolic modeling can be used to derive human-interpretable mathematical models of analog IC behavior. Symbolic analysis of analog ICs addresses the generation of symbolic expressions for the parameters that describe the performance of linear and nonlinear circuits [11]. Thus, symbolic analysis is a systematic approach to obtaining an understanding of analog blocks in an analytic form. Symbolic analysis techniques offer a complementary way to analyze analog ICs. The results of symbolic analysis are mathematical forms that explicitly describe the functionality of the circuit as a symbolic expression of the design variables. Designers use them to gain insight into the behavior of the circuit. However, their main weaknesses are: 1) limited to linear or weak nonlinear circuits; 2) large and complex models; 3) require a great deal of experience from the analog IC design expert [11].
Symbolic modeling has similar goals to symbolic analysis, but a different core approach to solving the problem. Symbolic modeling or symbolic regression is defined as the use of simulation data to generate interpretable mathematical expressions for circuit applications [12]. It extracts mathematical expressions from SPICE simulation data by means of genetic programming (GP). Since SPICE simulations readily handle nonlinear circuits [13], its simulation results may be leveraged for design purposes by means of symbolic modeling.
Other methods of DDM use a data set obtained from a statistical sampling of the global behavior of the analog IC [12,13]. These models are used instead of the circuit simulator in different stages of analog design. However, due to their global nature they do not answer questions such as: What are the relevant factors in the optimal gain? What are the relevant factors in the optimal bandwidth? How do the trade-offs affect these factors? Answering these kinds of questions is of utmost importance so as to enrich the experience of an analog circuit designer.
A promising approach to explore these trade-offs is the use of the Pareto front of optimally sized solutions of analog IC [14]. The Pareto optimal greatly reduces the design space, keeping the best configurations of the circuit and the best trade-offs possible among the multiple objectives employed. Thus, the Pareto front provides answers to the questions posed above.
The objective of this paper is to show a two-step methodology for the extraction of human-interpretable mathematical models of the feasible solutions of two Unity Gain Cells: a Voltage Follower and a Current Follower. The first step (section II), the optimal selection of design variables to maximize design objectives is formulated as a multi-objective optimization problem. The second step, Genetic Programming (GP) is used to create human-interpretable models starting from the feasible solution sets obtained from the first step. In Section III a brief introduction to the Symbolic Regression by Genetic Programming theory, and the general scheme of the MultiGene Genetic Programming (MGGP) method used for this work is given. In Section IV the details of the methodology proposed are presented. The experimental results of the methodology proposed to obtain symbolic models of two UGCs are presented in Section V. A brief discussion of the results is provided in Section VI. Finally, in Section VII the conclusions are presented.
2. Background
Data-driven models are built using observed and captured properties of a system, exhibited under different conditions or over time, and expressed in numerical form. The task of empirical modeling, or data modeling, lies in using a limited number of observations of system variables (data) to infer relationships among these variables.
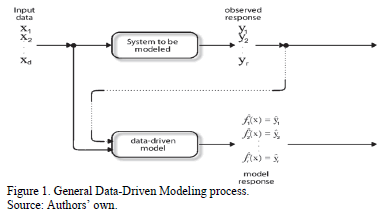
The task of modeling is to identify input variables driving the response variables and formulate the exact relationship in the form of an accurate model. Fig. 1 depicts a schematic view of the general process of data-driven modeling. A system model is the system under study; it can be a real or simulated process. In Fig. 1  is a set of input variables,
  is a set of response variables, and DDM is a collection of relationships that model the observed responses:
  .
.
The models obtained through the use of data-driven techniques can be classified according to their transparency; i.e., their ease in transmitting relationships between input and output variables. The first category, "black box" models, corresponds to those techniques from which information about relationships between inputs and outputs cannot easily be obtained. Some of the drawbacks of black-box models are: 1) lack of significant variables determination, 2) difficult to invert, 3) fundamental structure difficult to interpret, 4) lack of adaptability to new changes and 5) difficulty of
incorporating expert knowledge. This makes it impossible to answer simple questions about the underlying system, e.g.: What are the ranges of input variables that cause a response to take certain values, and not necessarily the optimal values? Some black-box model techniques include Neural Networks [15-18], support vector machines [19], and kriging [20]. To gain insight into an implicit black-box model, and facilitate its interpretation and manipulation, it is possible to create explicit models from the black-box inputs and outputs parameters. This process is called meta-modeling.
The second category is "gray-box" models; these correspond to those techniques where some insight into the relations between input and output variables can be extracted from the model obtained. Gray box modeling techniques include latent variable regression [21] and nonlinear sensitivity analysis [22]. The most important criteria for these modeling techniques are prediction ability, model building time, scalability, and model simulation time.
However, in contrast to the prediction error minimization method, the problem of knowledge extraction aims to obtain insight from a data set regardless of the complexity of the model obtained. Ideally, a functional relationship of some variables to other variables is sought. The third category is "white-box" model or "glass-box model", this technique can provide insight into relationships between input-output variables. This category includes Symbolic Regression via Genetic Programming (SRGP) which is a technique to automatically generate symbolic models that provide functional relations from given data [23]. As a consequence, SRGP has been successfully used for extracting white box models from samples of the full design space of an analog IC [13,24,25].
3. Symbolic regression by genetic programming
Genetic Programming is a bio-inspired method used in the field of machine learning [26]. An introduction and review of the GP literature is provided by [27]. The main difference between Genetic Algorithms (GA) and GP is the representation of individuals. In the GA individuals are expressed as linear strings of fixed length (chromosome) through all evolution steps; whereas in GP, individuals are expressed as nonlinear objects with different sizes and shapes, normally these nonlinear objects are expression trees. Thus, motivated by the evolutionary process observed in nature, computer programs are evolved to solve a given task. This process is done by randomly generating an initial population of trees and then, by using operations such as crossover and mutation, a new population of offspring is created [26]. A new parent population is selected from the initial and offspring populations, based on how good these trees perform for the given task. The best offspring resulting from this process is the solution of the problem. GP is implemented as per the following five steps:
- Generate an initial population of individuals formed as expression trees, consisting of the functions (arithmetic, basic mathematical and Boolean functions) and terminals (constants and inputs variables) of the problem.
- The fitness of each individual in a population is measured through a criterion such as the mean squared error.
- Likewise, the complexity of the individual is measured through a criterion such as the sum of all nodes in the tree.
- Better parents are usually selected through a tournament involving comparison of two parents at a time and thereafter, short listing the winner for further competition with the hope that it has a better chance of producing better offspring. The concept of what is "best" may be multi-objective, this means that there are two or more criteria used for selecting "good individuals" for further propagation. Often these criteria are prediction error and model complexity.
- New offspring are generated by changing the parents through three genetic operations: reproduction, crossover and mutation. After finishing the first cycle of the five steps listed, steps 2 to 5 are iterated. After some condition is reached, the evolutionary process is stopped. This gives rise to a set of solutions ranging from less complex individuals but with high error, to those highly complex individuals that have minimum error.
When GP is used to create empirical mathematical models of data acquired from a process or system, it is commonly referred to as symbolic regression [28]. SRGP is an iterative search technique, that looks for appropriate expressions of the response variable in a space of all valid formulae containing some of the given input variables and some predefined functional operators, like summation, multiplication, division, exponentiation, sine, and so on.
The task of symbolic regression can be stated as follows. Given a set of  ; where
  is a
is a  dimensional input
 is a corresponding output value,
  is a set of user-specified functions,
  is the universe of all mathematical expressions formed from
  , the task of symbolic regression is to determine a function
  , which provides a small prediction error. The resulting function
  is later used to predict the output for a new given input. The quality of
  is determined by how well it maps the given inputs to their corresponding outputs. An advantage of symbolic regression in contrast to classical regression analysis, is that GP automatically evolves the structure and the parameters of the mathematical model.
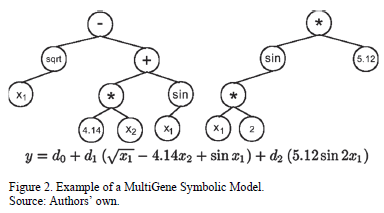
In contrast to the classical GP, in MultiGene Genetic Programming (MGGP) each symbolic model (expression tree) in the GP population is made from several trees instead of one [28,29]. All of the genes have specific optimal weights and the summation of the weighted genes plus a bias term form the final formula. The mathematical form of the multigene representation is shown in (1) [28].

Where  is the predicted output,
  is the value of the
  gene and is a function of one or more of the input variables,
  is the
  weighting coefficient,
  is the number of genes and
  is a set term. For example, a multigene model that predicts an output variable
  using input variables
  and
and  is shown in Fig. 2.
The software GPTIPS [29] is used in the current study to perform MGGP, which produces the symbolic modeling of the optimal sizes W and L of a VF and a CF whose data sets are collected in Section 5. GPTIPS is a SRGP code which was written based on Multigene Symbolic Regression to be used with MATLAB®. This software has the ability of avoiding most bloat problems by imposing restrictions on the maximum value of parameters such as the maximum number of genes, the maximum depth of trees and genes, the maximum number of nodes per tree, and so on.
4. Methodology
The methodology used is comprised of two steps: Pareto Front Generation and obtaining the white box model by using MGGP.
4.1. Pareto front generation
The basic cells for designing analog integrated circuits are several, such as OPAMP, OTA, CC, and so on; but [9] highlights the UGCs: VF, CF, VM and CM. The interconnection of UGCs generates more complex ICs, such as the Current Feedback Operational Amplifier (CFOA). These kinds of ICs have been sized with different optimization methodologies such as the Evolutionary Algorithms [9,10,30,31], with the aim of generating optimal behavior through the evaluation of multiple objectives [32-34] (performance parameters). Evolutionary Algorithms generate populations of feasible solutions, which approximate the Optimal Pareto set [35]. However, in the optimization of analog ICs, much of the time the best solutions include extreme performance requirements such as ultra-low power, low voltage and high frequency. Therefore, the set of optimal solutions is located in some region of the periphery of the feasible solutions.
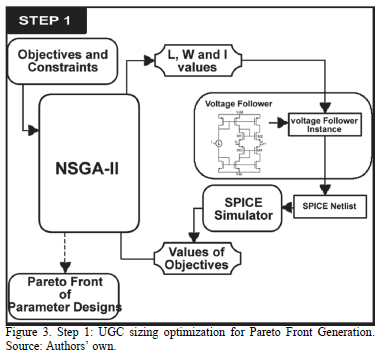
Multi-objective optimization is a convenient tool to exploit the feasible and optimal solutions in situations where two or more objectives are in conflict and have to be maximized or minimized at the same time. Thus, the first step of the methodology is to identify the optimal I, W and L sizes of two UCGs, a VF and a CF, maximizing the unity gain and bandwidth of such circuits. This is carried out using the process depicted in Fig. 3 [14].
The optimization stage is performed by applying the NSGA- II algorithm [14, 32, 36, 37], to minimize a problem of the form:

where function  is the decision vector and
  is the number of variables;
  , where
  is the decision space for the variables.
All objective functions  and
and  are performance constraints. Very often, since the objectives in (2) contradict each other, no point
  minimizes the objectives simultaneously. The best trade-offs among the objectives can be defined in terms of the Pareto optimal [36,37].
The NSGA-II Algorithm is based on Pareto ranking. Firstly, two populations  are generated, each one of size
  . The NSGA-II procedure in each generation consists of rebuilding the current
  population
  from the two original population fronts [36]. In the next step, new offspring
  are created from the current population
  (previously ranked and ordered by sub-front number), in order to choose from a population of size
  ,
, solutions belonging to the first sub-front. In addition, the last sub-front could be greater than necessary, and the measure
  is used to preserve diversity by the selection of the solutions that are far from the rest [38]. To build new generations, we use multi-point crossover and single point mutation as genetic operators. The optimization loop is iteratively applied until some stopping criterion is met, e.g., a certain number of iterations are executed or a sufficient convergence to the Pareto front with appropriate diversity is achieved [37,39].
In this case, each variable  represents the Width (W) or Length (L) of the MOSFETs, or the bias current (I). Those values are integer-multiples of a minimum value allowed by the fabrication process. The objectives
  are the circuit performances which are unity gain and high bandwidth, that are extracted from the output of the SPICE simulation. The output of the first step is a set of points of the Pareto front, as is shown in Fig. 3.
4.2. White box model generation
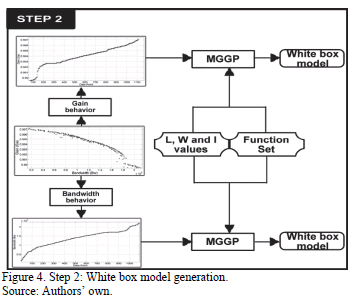
A set of samples of the Pareto front can provide information to answer questions on feasibility and performance trends. The proposed approach includes a second step: white box model generation. For this paper the models are of gain and bandwidth performances of the sizes W and L of the UGCs. These are obtained by using symbolic modeling through MGGP. Fig. 4 depicts the process of construction of the white box models of feasible performance solutions of the UGCs.
The aim of symbolic modeling is to use simulation data to generate interpretable mathematical expressions that relate the circuit performances to the design variables [13]. Thus, those mathematical expressions replace complex systems whose performance evaluation is computationally expensive. Moreover, the symbolic models obtained can provide insight into the underlying system, unlike other modeling methods like kriging, neural networks or support vector machines.
Generating a white box model by symbolic regression usually involves three steps:
- Design of experiments. It encompasses the selection of sample vectors to build the model. A wide variety of techniques are available, ranging from the classical Monte Carlo sampling, to latin hypercube sampling [40]. Basically, it tries to achieve a more uniform coverage of the search space with the minimum number of samples.
- Accurate evaluation. SPICE simulations are used to evaluate the performances for the sample circuits selected in step 1. This is the most computationally expensive step.
- Model construction. This part concerns building the symbolic model using the data sets obtained in step 2. For the model to be easily understood, low complexity is essential.
Experimental design is not used in step 2. The sample vectors to build the symbolic model correspond to the samples of the Pareto front obtained in step 1 (Fig 3). In this case, the Pareto optimal front has relatively few samples representing the best configurations in the design space. Multi-objective optimization algorithms use different strategies to ensure a good convergence to the ideal Pareto front and a good diversity of solutions within that front; e.g., ranking of solutions and maximization of the crowding distance of non-dominated solutions are used in NSGA-II [36]. Therefore, Multi-objective algorithms play the role of experimental design, i.e. the NSGA-II algorithm gets the sampling set to perform the white box modeling instead of using statistical sampling.
5. Experiments and Results
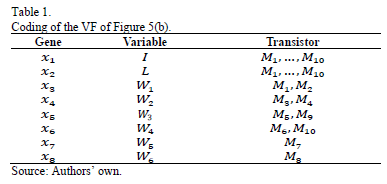
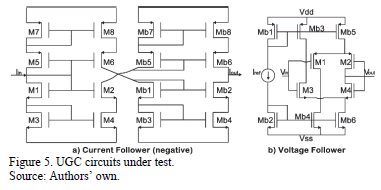
The optimization system has been programmed in standard C, and evolves the Widths (W), Lengths (L) and current bias (I) for each transistor of the UGC. Results are provided by TopSPICE as a listing of output data and are used for evaluating the individuals. The UGCs are coded using eight design variables for the VF and two or three for the CF, as can be seen in Table 1 and Table 2 respectively. For illustrative purposes, two conflicting objectives are shown in Fig. 4; but any number of objectives may be used. The UGCs used are shown in Fig. 5.
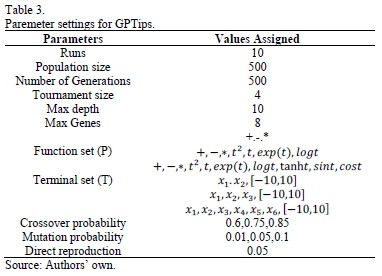
To perform symbolic modeling using GPTIPS, the parameters shown in Table 3 are used. Parameter settings play a major role in implementing the MGGP efficiently. The majority of parameters were selected based on the most frequently cited values in the literature [2,3,9,29,31]. The function set may include a broad selection of primitives so as to evolve a variety of nonlinear models. Of the three functional sets in Table 3, it chooses the smallest. Although the larger sets give slightly more accurate models, their complexity makes them too obscure for practical use. The values of population size and number of generations depend on the complexity of the data. In addition, the number of genes and the maximum depth of a gene influences the size and the number of models to be searched for in the global space.
The evaluation criteria for symbolic models are model precision and model complexity. Model precision is the adjustment for training and test data, using the Root Mean Square Error (RMSE) as an adjustment measure, as in (3), where  is the value of the
  data sample predicted by the symbolic model,
  is the actual value of the
  data sample and
  is the number of training samples. Model complexity was evaluated as the sum of all nodes in the genes. Using this method we selected symbolic models that were sufficiently accurate and highly interpretable.

5.1. Current Follower
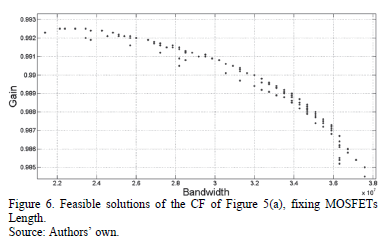
The first example of using this methodology is the modeling of the Pareto Optimal Front (POF) of a CF shown in Fig. 5(a). It has L fixed at  , so there are only two variables to model,
  and
and  ; MOSFET
  and
and  , respectively. These feasible solutions are depicted in Fig 6.
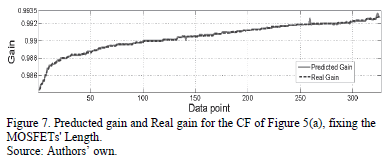
Once the feasible solutions are obtained, each performance parameter is modeled separately using the MGGP method, as described in Section IV. The symbolic model obtained for the unitary gain of the CF of Fig. 5(a) is shown in (4), where  and
and  . Its approximation behavior is depicted in Fig. 7 where the predicted gain is the value obtained from the symbolic model (4) using the test data; its RMSE is
  .
.

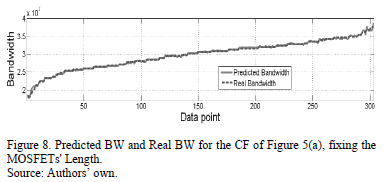
The symbolic model obtained for the bandwidth of the feasible solutions for the CF (Fig. 5(a)) is shown in (5).
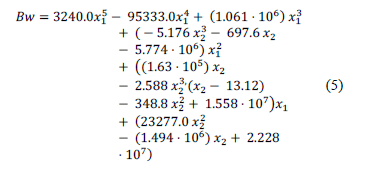
Fig. 8 shows the results of the symbolic model and the SPICE simulation using test data.
The second example is the modeling of the POF of the same CF, but in this case, one variable was added to the optimization process. The modeling variables are  and
and .
.  can take values of
  and
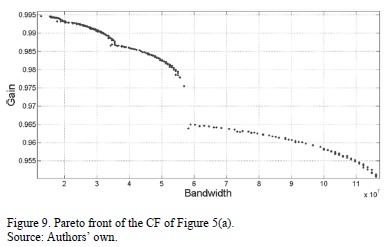
and  . The feasible solutions are depicted in Fig. 9. The feasible solutions from Fig. 6 are part of this set.
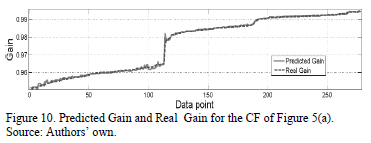
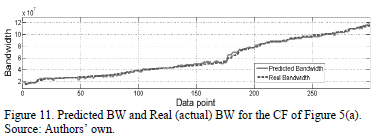
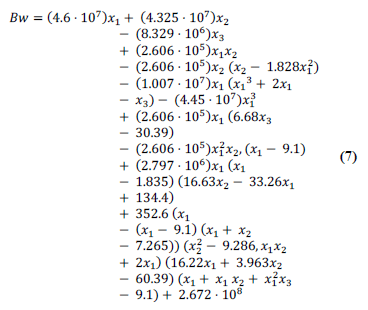
Following the steps in Section IV, feasible design parameter solutions for the CF (Fig. 5(a)) are first obtained, and then each performance parameter of the optimization process is modeled with GPTIPS. These produce symbolic models of the gain and CF bandwidth. The symbolic model obtained for the current follower bandwidth is expression (6). The approximation behavior is depicted in Fig. 10; the predicted gain is the value obtained from the symbolic model (6) and the actual gain is the value obtained from the test data (SPICE). The symbolic model obtained for the bandwidth of the feasible solutions for the CF is shown in (7). Fig. 11 shows the behavior of the obtained symbolic model (7) versus the real data obtained using the test data (SPICE).

5.2. Voltage Follower
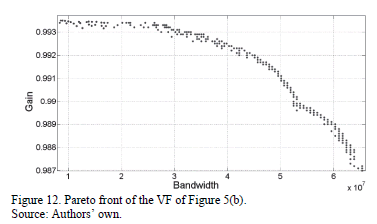
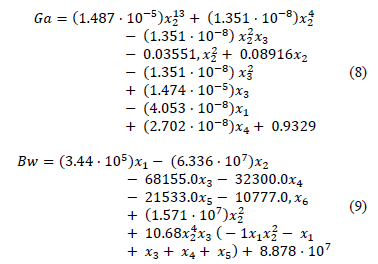
Finally, the proposed methodology is applied for modeling the Pareto optimal front of a VF, shown in Fig. 5(b). This VF has eight variables to encode, as seen in Table 1. The Pareto optimal front to be modeled is depicted in Fig. 12. The symbolic models obtained for gain and bandwidth are presented in (8) and (9).
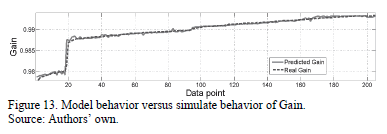
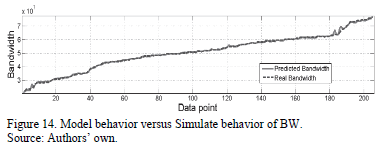
The behavior of the Gain symbolic model (8) and the SPICE simulation result (Actual Gain) are shown in Fig. 13. It can be observed that MGGP is capable of approximating the behavior of actual gain solutions; its RSME is  . The symbolic model obtained by using the MGGP method is shown in (8). As can be seen, the model is highly interpretable given that it is formed only by additions and subtractions of polynomials. Likewise, the BW symbolic model obtained is shown in (9). Fig. 14 shows the behavior of the symbolic model for the bandwidth and the behavior of the actual (SPICE simulated) bandwidth.
6. Discussion of Results
The symbolic regression process provides an abundant population of different types of symbolic models with different values in RMSE and complexity. Some having a smaller error, have complexities exceeding the hundreds of nodes, making them uninterpretable. In addition to the above, enlarging the functional set drastically increases the complexity of the symbolic models obtained. For that reason, the functional set is limited to only three functions: addition, subtraction and multiplication. In Section 5 symbolic models and their behavior against SPICE simulated data are shown. As mentioned above, symbolic models that are highly interpretable by human beings and can be of practical use are selected.
Given the quantity of individuals that form the population of symbolic models and the complexity and adjustment of each one, this work focused on those models that dominate others for the selection of symbolic models. In other words, individuals in the knee of the Pareto Front of models are selected; this guarantees that selected models are highly interpretable and have a good adjustment.
As is well known, the Pareto-domination based selection of the NSGA-II algorithm succeeds at driving the whole population towards the Pareto optimal set or Pareto Front. However, it has no direct control over the evolution of each individual in the population and thus it has no good mechanism to control the distribution over the PF. That is why repetition is recommended to ensure the location of the real Pareto front. Moreover, the NSGA-II groups individuals from different regions of the design space in the Pareto front. The interpolation of antecedents of two neighbors of the Pareto front may not necessarily be valid.
7. Conclusions
This paper has presented a procedure to data-mine the results of a circuit sizing to extract domain knowledge that can be immediately used by IC experts. Thus, the knowledge can be distributed to designers or students, without the need for more synthesis, since the symbolic models, which have been generated using MGGP, are human-interpretable mathematical models.
The procedure presented involves two steps: the generation of samples of the Pareto-optimal performance sizes of a UGC using the MOGA and the generation of white box models of each of the objectives of this Pareto Front.
The symbolic models are formed by additions and subtractions of polynomials; thus, their form is highly interpretable. Nevertheless, these are very hard to invert, so it is necessary to go back to the antecedent simulations.
For values between two or more simulation points, interpolation does not always make sense. This is because the antecedent points come from distant regions in the design space. It is important to highlight that in this work, less complex symbolic models were selected despite having a less precise adjustment. Thus, selecting complex models that are obscure as a neural network is avoided.
References
[1] Rutenbar, R.A., Gielen, G. and Antao, B., Computer-aided design of analog integrated circuits and systems, Piscataway, NJ, USA: Wiley-IEEE Press, 2002. ISBN: 978-0-471-22782-3 [ Links ]
[2] Razavi, B., Design of analog CMOS integrated circuits: Tata McGraw-Hill Education, 2002. ISBN-10: 0072380322 [ Links ]
[3] Tlelo-Cuautle, E., Integrated circuits for analog signal processing. Tlelo-Cuautle E., ed., Springer New York, USA, 2013. ISBN: 9781461413820 [ Links ]
[4] Sánchez-López, C., Martínez-Romero, E. and Tlelo-Cuautle, E., Symbolic analysis of OTRAs-based circuits. Journal of applied research and technology [online], 9(1), pp. 69-80, 2011. [date of reference Dec. 11th, 2015]. Available at: http://www.revistas.unam.mx/index.php/jart/article/view/25278/23750 [ Links ]
[5] Khateb, F. and Biolek, D., Bulk-driven current differencing transconductance amplifier, Circuits, Systems, and Signal Processing, 30(5), pp.1071-1089, 2011. DOI: 10.1007/s00034-010-9254-9 [ Links ]
[6] Campos-Cantón, I., Desarrollo de celdas lógicas por medio del espacio de estados en un sistema bidimensional, Revista Mexicana de Física, [online]. 57(2), pp. 106-109, 2011.[date of reference Dec. 11th, 2015] Available at: http://revistas.unam.mx/index.php/rmf/article/view/25225/23707 [ Links ]
[7] Swamy, M., Mutators, generalized impedance converters and inverters, and their realization using generalized current conveyors. Circuits, Systems, and Signal Processing, 30(1), pp.209-232, 2011. DOI: 10.1007/s00034-010-9208-2 [ Links ]
[8] Pathak, J., Singh, A.K. and Senani, R., Systematic realisation of quadrature oscillators using current differencing buffered amplifiers. IET Circuits, Devices & Systems, 5(3), pp. 203-211, 2011. DOI: 10.1049/iet-cds.2010.0227 [ Links ]
[9] Duarte-Villaseñor, M.A., Tlelo-Cuautle, E. and de la Fraga L.G., Binary genetic encoding for the synthesis of mixed-mode circuit topologies. Circuits, Systems, and Signal Processing, 31(3), pp. 849-863, 2012. DOI: 10.1007/s00034-011-9353-2 [ Links ]
[10] Coello-Coello C.A., Van Veldhuizen, D.A. and Lamont, G.B., Evolutionary algorithms for solving multi-objective problems, Second ed, Springer US, 2002. ISBN: 978-0-387-33254-3 [ Links ]
[11] Sheldon, X. and Tlelo-Cuautle, E., Recent development in symbolic analysis: An overview. In: Fakhfakh, M., Tlelo-Cuautle, E. and Fernández, F.V., eds. Design of analog circuits through symbolic analysis: Bentham Science Publishers, 2012, pp. 3-18. ISBN: 9781608050956 [ Links ]
[12] McConaghy, T. and Gielen, G.G.E., Globally reliable variation-aware sizing of analog integrated circuits via response surfaces and structural homotopy. Computer-Aided Design of Integrated Circuits and Systems, IEEE Transactions on, 28(11), pp.1627-1640, 2009. DOI: 10.1109/TCAD.2009.2030351 [ Links ]
[13] McConaghy, T. and Gielen, G.G., Nonlinear template-free symbolic performance modeling for design and process variation analysis of analog circuits. In: Fakhfakh, M., Tlelo-Cuautle, E. and Fernández, F.V., eds. Design of analog circuits through symbolic analysis, Bentham Science Publishers, 2012, pp. 3-18. ISBN: 9781608050956 [ Links ]
[14] Polanco-Martagón, S., Reyes-Salgado, G., De la Fraga, L.G., Tlelo-Cuautle, E., Guerra-Gómez, I., Flores-Becerra, G., et al., Optimal sizing of analog integrated circuits by applying genetic algorithms. In: Ramirez-Muñoz, A. and Garza-Rodriguez, I., eds. Handbook of Genetic Algorithms: New research. Mathematics Research Developments, Nova Science Publishers; 2012. ISBN: 978-1-62081-184-9 [ Links ]
[15] McConaghy, T. and Gielen, G., Analysis of simulation-driven numerical performance modeling techniques for application to analog circuit optimization, in Circuits and Systems, 2005 ISCAS 2005 IEEE International Symposium; pp. 1298-1301, 2005. DOI: 10.1109/ISCAS.2005.1464833 [ Links ]
[16] Wolfe, G. and Vemuri, R., Extraction and use of neural network models in automated synthesis of operational amplifiers. Computer-Aided Design of Integrated Circuits and Systems, IEEE Transactions on, 22(2), pp.198-212, 2003. DOI: 10.1109/TCAD.2002.806600 [ Links ]
[17] Sarmiento, A.T. and Soto, O.C., New product forecasting demand by using neural networks and similar product analysis. DYNA. 81(186), pp. 311-317, 2014. DOI: 10.15446/dyna.v81n186.45223 [ Links ]
[18] Lizarazo-Marriaga, J.M. and Gómez-Cortés, J.G., Desarrollo de un modelo de redes neuronales artificiales para predecir la resistencia a la compresión y la resistividad eléctrica del concreto, Ingeniería e Investigación, [online]. 27(1), pp. 11-18. 2007. [date of reference Dec. 11th, 2015]. Available at: http://revistas.unal.edu.co/index.php/ingeinv/article/view/14771 [ Links ]
[19] Boolchandani, D., Ahmed, A. and Sahula, V., Efficient kernel functions for support vector machine regression model for analog circuits' performance evaluation. Analog Integrated Circuits and Signal Processing, 66(1), pp. 117-128, 2011. DOI: 10.1007/s10470-010-9476-6 [ Links ]
[20] Kotti, M., González-Echevarría, R., Fernández, F.V., Roca, E., Sieiro, J., Castro-López, R., et al., Generation of surrogate models of Pareto-optimal performance trade-offs of planar inductors. Analog Integrated Circuits and Signal Processing, 78(1), pp. 87-97, 2014. DOI: 10.1007/s10470-013-0230-8 [ Links ]
[21] Li, X. and Cao, Y., Projection-based piecewise-linear response surface modeling for strongly nonlinear VLSI performance variations. Quality Electronic Design, in 9th International Symposium; pp. 108-113, 2008. DOI: 10.1109/ISQED.2008.4479708 [ Links ]
[22] McConaghy, T., Palmers, P., Gielen, G. and Steyaert, M., Automated extraction of expert knowledge in analog topology selection and sizing, in Computer-Aided Design, 2008 ICCAD 2008 IEEE/ACM International Conference, pp. 392-395, 2008. DOI: 10.1109/ICCAD.2008.4681603 [ Links ]
[23] Vladislavleva, E.J., Smits, G.F. and den Hertog, D., Order of nonlinearity as a complexity measure for models generated by symbolic regression via Pareto genetic programming. Evolutionary Computation, IEEE Transactions on, 13(2), pp. 333-349, 2009. DOI: 10.1109/TEVC.2008.926486 [ Links ]
[24] Aggarwal, V. and O'Reilly, U-M., Simulation-based reusable posynomial models for MOS transistor parameters, in Conference on Design, Automation and Test in Europe, San Jose, CA, USA: EDA Consortium, 2007, pp. 69-74. 2007. DOI: 10.1109/DATE.2007.364569 [ Links ]
[25] McConaghy, T. and Gielen, G.G.E., Template-Free symbolic performance modeling of analog circuits via Canonical-Form functions and genetic programming. Computer-Aided Design of Integrated Circuits and Systems, IEEE Transactions on, 28(8), pp. 1162-1175, 2009. DOI: 10.1109/TCAD.2009.2021034 [ Links ]
[26] Koza, J.R., Genetic programming: On the programming of computers by means of natural selection. Cambridge: MIT press; 1992. ISBN: 9780262111706 [ Links ]
[27] Poli, R., Langdon, W.B., McPhee, N.F. and Koza, J.R., A field guide to genetic programming [online] Published via http://lulu.com; 2008.[consulted, December 10th, 2015]. Available at http://www.gp-field-guide.org.uk. [ Links ]
[28] Hii, C., Searson, D. and Willis, M., Evolving toxicity models using multigene symbolic regression and multiple objectives. International Journal of Machine Learning and Computing, 1(1), pp. 30-35, 2011. [ Links ]
[29] Searson, D.P., Leahy, D.E. and Willis, M.J., GPTIPS: An open source genetic programming toolbox for multigene symbolic regression, in International Multiconference of Engineers and Computer Scientists, pp. 77-80, 2010. [ Links ]
[30] Sallem, A., Benhala, B., Kotti, M., Fakhfakh, M., Ahaitouf, A. and Loulou, M., Application of swarm intelligence techniques to the design of analog circuits: Evaluation and comparison. Analog Integrated Circuits and Signal Processing, 75(3), pp. 499-516, 2013. DOI: 10.1007/s10470-013-0054-6 [ Links ]
[31] Polanco-Martagón, S., Reyes-Salgado, G., Flores-Becerra, G., Tlelo-Cuautle, E., de la Fraga, L.G., Guerra-Gómez, I., et al., Selection of MOSFET sizes by fuzzy sets intersection in the feasible solutions space, Journal of Applied Research and Technology. [online]. 10(3), pp. 472-483, 2012. [date of reference Dec. 11th, 2015]. Available at: http://www.jart.ccadet.unam.mx/jart/vol10_3/selection_15.pdf [ Links ]
[32] Santos-Azevedo, M.S., Pérez-Abril, I., León-Benítez, C.D., Cabral-Leite, J. and Holanda-Bezerra, U., Multiobjective optimization of the reactive power compensation in electric distribution systems. DYNA, 81(187), pp. 175-183, 2014. DOI: 10.15446/dyna.v81n186.40979 [ Links ]
[33] Ocampo, R.A.B., Flórez, C.A.C. y Zuluaga, A.H.E., Planeamiento multiobjetivo de la expansión de la transmisión considerando seguridad e incertidumbre en la demanda, Ingeniería e Investigación, [online]. 29(3), 74-78, 2009. [date of reference December. 11th, 2015]. Available at: http://www.revistas.unal.edu.co/index.php/ingeinv/article/view/15186/34199 [ Links ]
[34] Zitzler, E., Thiele, L. and Bader, J., On Set-Based multiobjective optimization. Evolutionary Computation, IEEE Transactions on, 14(1), pp. 58-79, 2010. DOI: 10.1109/TEVC.2009.2016569 [ Links ]
[35] Mueller-Gritschneder, D., Graeb, H. and Schlichtmann, U., A Successive approach to compute the bounded Pareto front of practical multiobjective optimization problems. SIAM Journal on Optimization, 20(2), pp. 915-934, 2009. DOI: 10.1137/080729013 [ Links ]
[36] Deb, K., Pratap, A., Agarwal, S. and Meyarivan, T., A fast and elitist multiobjective genetic algorithm: NSGA-II. Evolutionary Computation, IEEE Transactions on, 6(2), 182-197, 2002. DOI: 10.1109/4235.996017 [ Links ]
[37] Li, M., Liu, L. and Lin, D., A fast steady-state e-dominance multi-objective evolutionary algorithm. Computational Optimization and Applications, 48(1), pp. 109-138, 2011. DOI: 10.1007/s10589-009-9241-x [ Links ]
[38] Guerra-Gómez, I., Tlelo-Cuautle, E., McConaghy, T. and Gielen, G., Optimizing current conveyors by evolutionary algorithms including differential evolution. In: 16th Electronics, Circuits, and Systems, ICECS 2009 IEEE International Conference on; 2009, pp. 259-262. DOI: 10.1109/ICECS.2009.5410989 [ Links ]
[39] Fernandez, F.V., Esteban-Muller, J., Roca, E. and Castro-López, R., Stopping criteria in evolutionary algorithms for multi-objective performance optimization of integrated inductors, In Evolutionary Computation (CEC), 2010 IEEE Congress; pp. 1-8, 2010. DOI:10.1109/CEC.2010.5586196 [ Links ]
[40] Keramat, M., Kielbasa, R., Modified latin hypercube sampling Monte Carlo (MLHSMC) estimation for average quality index. Analog Integrated Circuits and Signal Processing, 19(1), pp. 87-98, 1999. DOI: 10.1023/A:1008386501079 [ Links ]
S. Polanco-Martagón, received a BSc. degree in Computer Science at the Technological Institute of Puebla, Puebla, México, in 2006. He earned his MSc. Degree in Engineering, with honors, in the area of Information Technologies from the Institute of Technology in Puebla, Puebla, México in the year of 2010. He received his Dr. degree in July 2015 from the Centro Nacional de Investigación y Desarrollo Tecnológico (CENIDET), Cuernavaca, Morelos, México. Currently, he is working as a professor and researcher at the Universidad Politécnica de Victoria, Ciudad Victoria, Tamaulipas, México. His main areas of interest are artificial neural networks, fuzzy systems and bio-inspired algorithms. He has published about eight papers in book chapters, journals and conferences. ORCID: 0000-0001-8473-0534
J. Ruiz-Ascencio, received his BSc. degree in physics from Universidad Nacional Autónoma de México (UNAM), Mexico, in1971, a MSc. degree in Electrical Engineering in 1973, from Stanford University, USA, and the DPhil. degree in Engineering and Applied Science in 1989, from the University of Sussex, USA. He has been a researcher at the Institute of Applied Mathematics, IIMAS-UNAM, a full-time lecturer at the Autonomous University of Barcelona, automation project leader for Allen-Bradley, a researcher at the Instituto Tecnológico de Monterrey, and an invited scholar at McGill University's Center for Intelligent Machines in 2003 and again in 2010. He joined the Computer Science Department at the Centro Nacional de Investigación y Desarrollo Tecnológico (CENIDET) in 1995, where he is a member of the Artificial Intelligence Group. His current interests are machine vision and intelligent control. ORCID: 0000-0001-8411-6817
M.A. Duarte-Villaseñor, received his BSc. degree of in Electronics from the Benemérita Universidad Autónoma de Puebla (BUAP), Mexico, in 2005. He received his MSc. and Dr. degree in the National Institute of Astrophysics, Optics and Electronics (INAOE), in 2007 and 2010. He has been a professor and researcher at the Instituto Tecnológico de Tijuana (ITT), Mexico since 2014. He is interested in the design of integrated circuits, artificial intelligence, automation and evolutionary algorithms. He has authored more than 20 works including book chapters, journals and conferences. ORCID: 0000-0002-8858-8595


