


 Inglés (pdf)
 Articulo en XML
 Referencias del artículo
 Enviar articulo por email
 Citado por SciELO
  Citado por Google
  Similares en
SciELO
Similares en
SciELO  Similares en Google
 Permalink
1. Introduction
Bogota’s Savannah and surrounding areas are home to nearly a third of Colombia’s population and are the country’s main economic center with around 40% of the gross domestic product [1]. In case of a destructive seismic event in this area, the entire country would face many harmful social and economic effects; this is why a seismic early warning system around Bogota is important and the epicenter distance estimation is one of the main parameters in this system. The epicenter distance represents the length between the earthquake epicenter and the seismological station, and epicenter is the surface area vertically above the earthquake focus [2]. The density of seismological stations around Bogota is not high enough, making the time used for the localization of seismic events longer than the travel time to areas where the early warning is required. In this case, an alternative solution may be implemented, by using seismological data of previous events recorded at one single station in order to calculate earthquake hypocentral parameters. A seismic early warning system emits an alert from a few seconds to a few tens of seconds before the stronger shaking movement arrives; it can be based on one three-component station, implementing methods of bio-inspired computing, natural computation or computational intelligence. These methods have been successfully applied in multiple areas of knowledge; in seismology, these methods allow the estimation of hypocentral parameters using just few seconds of a signal registered at a single seismological station, achieving acceptable accuracy and generating reliable alerts. This approach is very useful in areas with sparse seismic networks [3,4]. Automatic computation algorithms in a single broadband three-component station have been mainly developed for P and S waves onsets detection, allowing the estimation of source location using the back-azimuth and the apparent surface speed measurements [5-7], or seismic moment estimation [8-13]. On the other hand, kernel-based methods have become a very powerful tool for mathematicians, scientists and engineers, providing a very rich and surprising solution in areas such as signal processing and pattern recognition [14]. Its implementation is quite simple by applying a function that combines input variables as a combination of themselves using a function of dot products, obtaining an enhanced new space with more dimensions, mapping variables in a hyperspace where separation of classes (in the case of classification) by a linear function or hyperplane can be achieved.
The study area corresponds to the Bogota’s Savannah and its surroundings, where some important fault systems are present, such as Piedemonte Llanero, La Salina, Bogota Savannah and even the Ibague fault system Fig. 1.
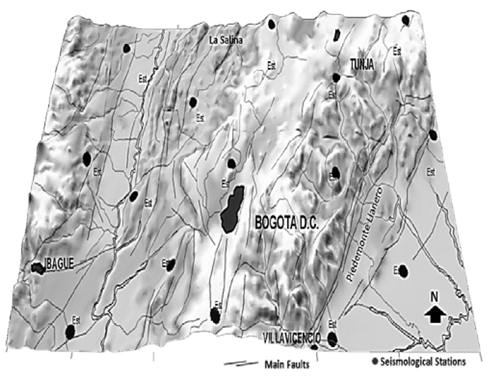
Also, the Bogota city has been built on soft lacustrine soil [1], which is a natural seismic wave amplifier producing high damage to the infrastructures, similarly to damages occurred in Mexico City in the past [15]. This area suffers high seismicity that can affect Bogota, the country’s capital and most important social and economic populated center.
2. Data set used and methods applied
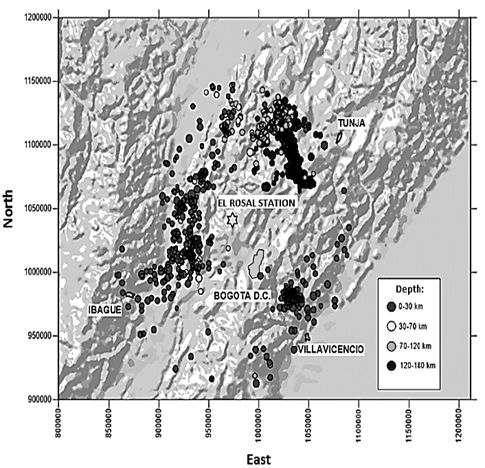
The data set used in this research belongs to El Rosal seismological station, located toward north-west Bogota as shows Fig. 2. This station is part of the Colombian Seismic Network administrated by The “Servicio Geológico Colombiano - SGC” (Colombian Geological Service).
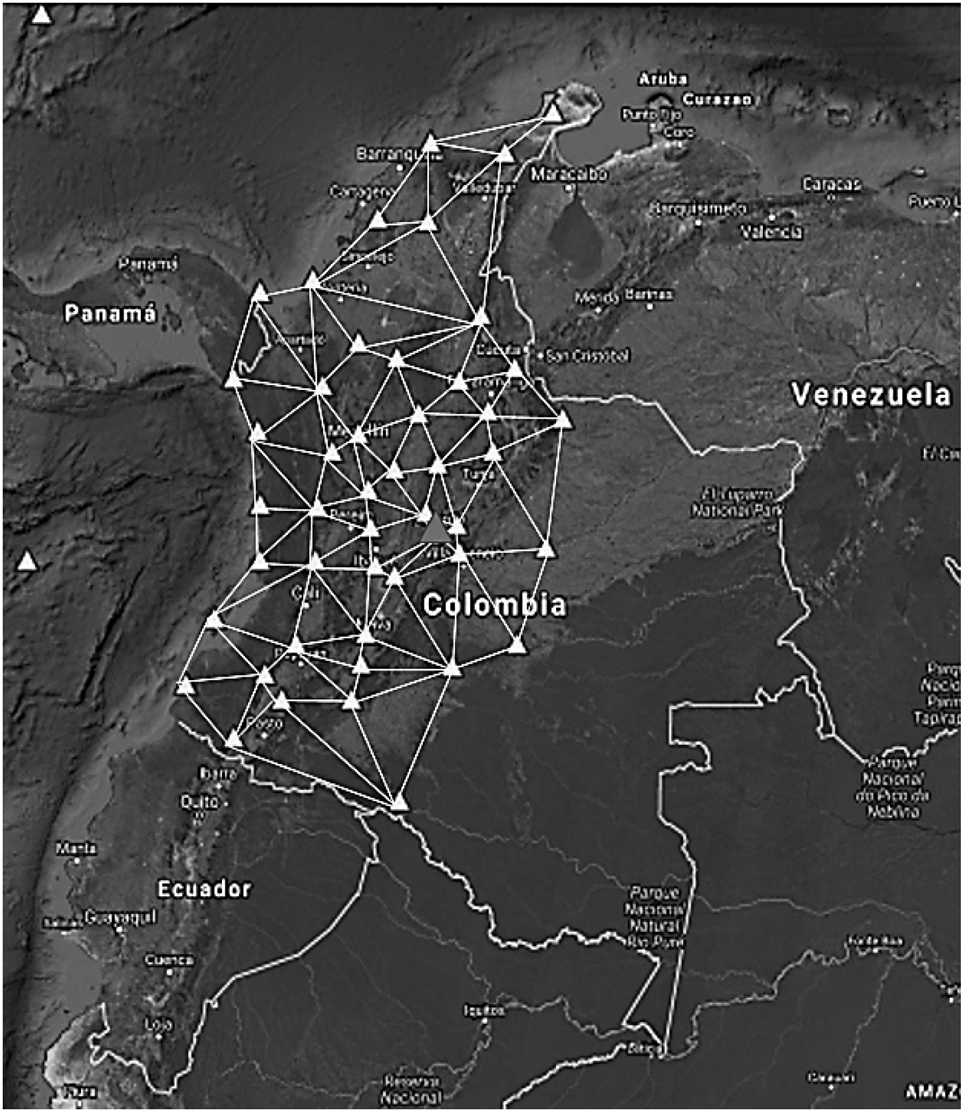
The Colombian Geological Survey has a main network composed by 42 stations transmitting in real time, recording seismic activity for the entire country as shows Fig. 3, with an average distance between stations of 162 kilometers. El Rosal station employs a brand Guralp CMG - T3E007 sensor in the three components and a nanometrics RD3-HRD24 digitizer, which provides simultaneous sampling of three channels with a 24-bit resolution [16]. The data correspond to the three component raw waveforms recorded directly in this station and a seismic catalogue with 2164 characterized events, selected between January 1st 1998 and October 27th 2008; all these events were located less than 120 kilometers from the station.
2.1. Data pre-processing
Before starting the processing related to SVMR, waveform files from El Rosal station were converted to the American standard code for information interchange (ASCII) format, using a Seisan package tool [17]; earthquakes with magnitudes lower than 2.0 M L were ignored; therefore the followed processes were applied on the remaining 1011 events. Since the selected seismic records present variable levels of noise, it was necessary to filter them out with both high and low frequency filters. Low frequencies correspond to instrumental noise that can be easily eliminated through the implementation of a high-pass filter with a cut-off frequency of 0.075 Hz [18], while high frequencies were removed with a low-pass filter with a cut-off frequency of 150 Hz.
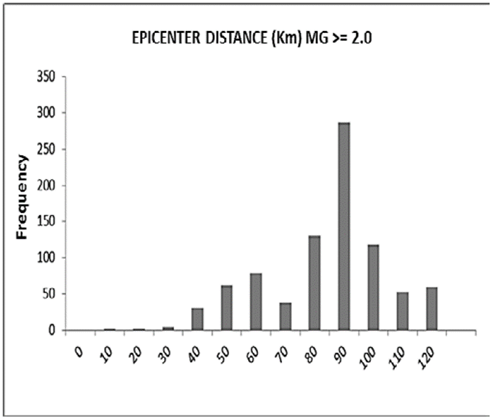
The statistical distribution of epicenter distance values is presented in Fig. 4, where main distribution of whole data set is observed. This bar chart shows that the seismicity surrounding El Rosal station is presented from 40 kilometers and beyond, with great amount of events close to 90 kilometers. Although this is not a homogeneous distribution, it corresponds to local conditions and regular behavior for this variable and therefore the model has to work properly under this condition.
2.2. Descriptors - Input data set of SVMR
In this study, some parameters that have been previously used for other authors to magnitude estimation were calculated; then, they were employed as input variables or descriptors for the SVMR algorithm. In the first stage, the relationship between maximum amplitude of the wave in a short period of time was selected, along with local magnitude of the earthquake [19]. Consecutive, maximum peaks were highlighted and a linear regression was performed for each of the three components, correlating not only the maximum peak, but also the way it changes while energy reaches the sensors. Three basic parameters were chosen from the linear regressions such as, slope (M), independent term (B) and correlation coefficient (R), for each of the three components. The maximum amplitude values (Mx) obtained for the time of each component were used as descriptors as well. Thus, each event had 12 descriptors associated with this concept.
Furthermore, nine descriptors used previously for epicenter distance estimation were added. These descriptors were performed by adjusting a linear regression of an exponential in eq. (1):
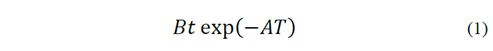
This equation belongs to the envelope of the seismic record in a logarithmic scale determined by linear regression and its respective correlation coefficient (R) for each component [10].
Similarly, some parameters used for previous back-azimuth determination were used to include information about the source location of the seismic event into the model. Maximum eigenvalues of the two-dimensional covariance matrix were used as input descriptors, calculated as described in [5,20]. A windowing scheme with one second time windows was performed, obtaining consecutive values for which a linear regression was calculated, in a similar way as described above, determining the slope (M), the independent term (B) and the correlation factor (R) of the regression, as well as the arithmetic mean of the eigenvalues (P). Despite this parameter involving three components, only four descriptors were added to the process.
In sum, a total of 25 descriptors were used in the SVMR model for local epicenter distance determination, 12 of them related to previous works on magnitude estimation, 9 were associated with previous epicenter distance estimations and the last 4 descriptors were used in back-azimuth determination. These descriptors were calculated for 5, 10 and 15 seconds signal windows for 1011 selected events with magnitudes greater than 2.0. All extreme or anomalous values were eliminated reducing the data set to 863 events.
2.3. The SVMR model
The model was trained with the refined data set for each time window, using the Weka 3.6 software [21]. This algorithm has a strong statistical support and is easily implemented on the station by electronic processing cards. After performing several tests, a standard normalized polynomial kernel was selected. In order to choose the kernel exponent and the complexity factor, correlation factors and minimum absolute error obtained by a 10 fold cross correlation process were compared. These processes were carried out testing multiple combinations of exponents and complexity factor for deferments magnitudes and time signals. The correlation coefficient calculated for each partition corresponds to the Pearson’s Coefficient, which measure the linear relationship between two variables independently of their scales. This coefficient takes values between 1 and - 1; a value of zero means that a linear relationship between two variables could not be found. A positive value of this relation means that two variables change in the same way, i.e. high values of one variable correspond to high values of the other and vice versa. The closer this value is to one, the greater certainty that two variables have a linear relation.
3. Results
Using the descriptors explained above and real magnitude for each considered seismic event, a group of 12 datasets were evaluated. Each dataset corresponds to a combination of 4 minimum magnitude filters (2.0, 2.5, 3.0 and 3.5) and 3 signal length filters (5, 10 and 15 s), evaluating combinations of 7 values for kernel exponent and 6 values for complexity factor, completing a total of 504 tested models of SVMR in order to find the combination of parameters with the best correlation factor in epicenter distance determination.
Fig. 5 shows values of correlation coefficients in each combination of cut-off magnitude and time signal where kernel exponents and complexity factors were calculated for each combination, where values in green squares represent better correlation, while those in red squares represent values of lower correlation. Afterward, those with the highest value of correlation coefficient were chosen. Fig. 5 also shows optimal values of correlation coefficients for time signals of 10 and 15 seconds, the average being of 0.7.
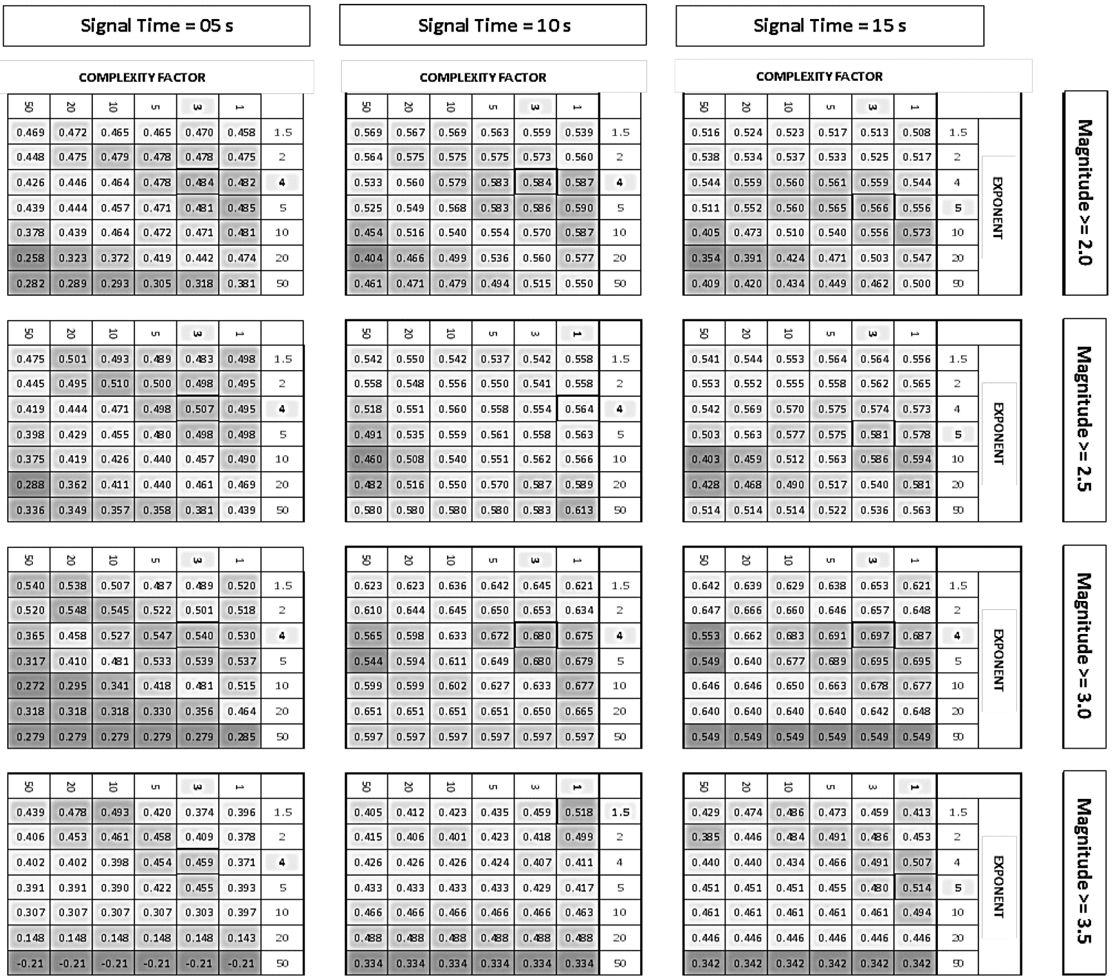
This value is an acceptable correlation, indicating that the model is predicting the epicenter distance with good accuracy. For a time signal of 5 seconds, correlation coefficient values are just above 0.5, pointing out that this time signal is not long enough to estimate an acceptable epicenter distance.
Although a correlation coefficient is more suited to a time signal of 15 seconds, the 10-signal seconds was selected as the best model in the shortest period of time; moreover, a cut-off magnitude must be established for the 10 seconds signal allowing accuracy in the final value of epicenter distance.
The choice of parameters is shown in Fig. 6, where correlation coefficient and mean absolute error are presented for each combination of kernel exponent and complexity factor, all of them for the time signal and the cut-off magnitude selected.
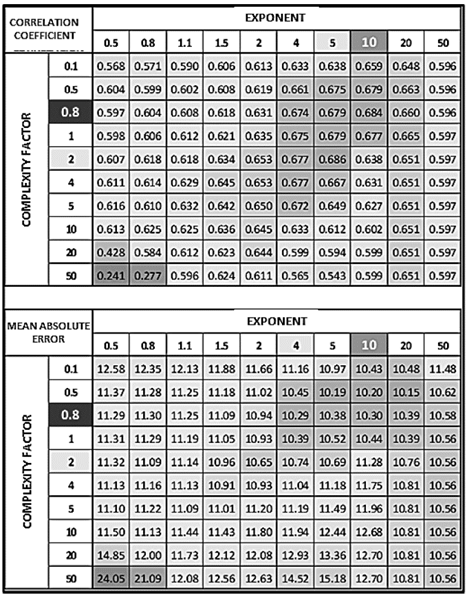
Table 1 shows, for a time signal of 10 seconds and 3.0 of cut-off magnitude, a mean value of 0.45 kilometers with standard deviation of 9 kilometers, this cut-off being the one finally implemented in the model.
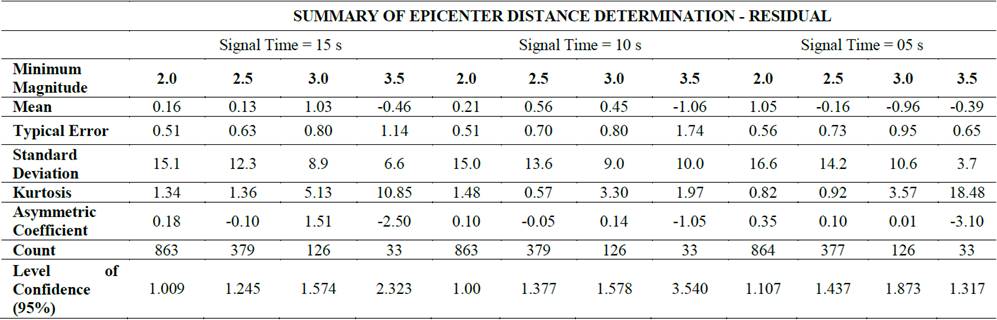
These parameters were calculated using SVMR algorithm in Weka 3.6 with a standard normalized polynomial kernel and 10 fold cross-validations. We can see that quality factors enable an accuracy of 10.9 kilometers in epicenter distance, considering the cross-validation, and also allowing verification of the model at the same time.
Based on these results, a support vector machine of normalized polynomial kernel can be implemented using an exponent of 10 and a complexity factor of 0.8. The standard deviation was of 10.3 kilometers, which is good enough for an early warning generation, considering that most of the seismic events are located farther than 40 kilometers from El Rosal station.
Fig. 7 shows the cross-plot with relationship between the real epicenter distance (X axis) and the distance calculated by the model (Y axis). A normal statistical pattern can be observed in the distribution of residuals, also confirming that the calculated distance is of around 10.9 kilometers. The dashed blue line represents the linear behavior of predicted data, corresponding to the locus where prediction is equal to real values.
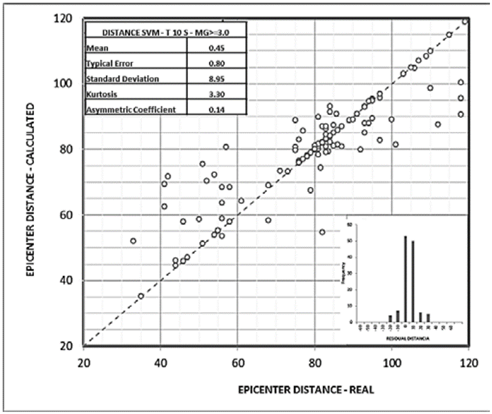
From these results, we can establish that the model works properly, allowing prediction of the distance where earthquakes occur with good accuracy, considering that the values are obtained with a 10 seconds signal, which is good enough for an early warning system.
4. Conclusions
The SVMR model proposed here is an important step towards the implementation of an early warning system of earthquakes for the city of Bogota - Colombia, and for other populated centers in the world.
The result showed in this study is an improvement on that of [22] and [23], who were as accurate as ±15 and ±16-19 kilometers respectively.
This model is proposed and evaluated for fast epicenter distance determination, based on support vector machine regression through pattern recognition and characterization of earthquake signals recorded on a three components seismic station in only ten seconds, anticipating the arrival of earthquakes in the city of Bogota. An earthquake travels the distance to main seismic alignments in at least 30 seconds, allowing an early warning generation, which must be in less than 10 seconds. Additionally, this model can be implemented directly in the seismological station embedded in electronic devices, where the main mathematical process corresponds to a simple matrix product involving the given kernel for the epicenter distance and a vector which contains the calculated descriptors of the current event.
5. Recommendations
Despite the good results obtained in terms of epicenter distance determination, it is important to continue developing the model introduced here, in order to calculate other hypocentral parameters.
It is important to find ways to improve the prediction accuracy based on further research, supported by computational intelligence and geophysics research groups as well as the seismological network in Bogota’s Savannah and its surroundings managed by the Universidad Nacional de Colombia.
The use of other descriptors such as predominant period, Fourier and wavelet frequency spectra should be considered to obtain higher correlation factors and better estimation values for local magnitude and other hypocentral parameters estimations, required to generate a reliable and fast earthquake early warning system.
Datasets should be complemented with recent seismic events, specifically from October 27th of 2008 to the present, as this period has presented larger set of earthquakes with magnitudes greater than 3.0.

