


 Inglês (pdf)
 Artigo em XML
 Referências do artigo
 Enviar este artigo por email
 Citado por SciELO
  Citado por Google
  Similares em
SciELO
Similares em
SciELO  Similares em Google
 Permalink
1. Introduction
Austenitic stainless steel materials play an important role in many fields, such as modern power and chemical industries. However, austenitic stainless steel is difficult to machine [1]. Its poor machinability is usually due to low heat conductivity, high tensile strength, high ductility, high fracture toughness and high work-hardening rate [1,2].
A number of difficulties occur when machining austenitic stainless steel, such as intensive vibration, poor surface finish, built-up edge on the tool flank face, and cutting edge breakage [3].
In recent years, research has generally been focused on the role of cutting fluids and machining variables, surface roughness and cutting forces, and milling of stainless steel.
The effects of cryogenic cooling on cutting forces in the milling process of AISI 304 stainless steel, using different cutting speeds, were investigated by Nalbant and Yildiz [1].
Influence of radial depth on vibration, chip formation and surface roughness during face milling of AISI304 stainless steel with cemented carbide milling cutters, were studied by Shen and collaborators [3]. They found that high radial depth increases the vibration, and the machining quality deteriorates.
Results of dry and wet milling of AISI 316 stainless steel were compared by Ozcelik et al. [4], in terms of tool wear, surface roughness and force components. The authors established that tools used in wet milling failed catastrophically before reaching the fixed machining length, although cutting fluid application was efficient at low-cutting speeds, and in some cutting conditions, dry milling gave lower surface roughness.
Hamdan et al. presented an optimization method of machining parameters in high-speed milling of stainless steel with coated carbide tool using different types of lubrication modes. This study showed feed rate as the most prominent factor influencing cutting force and surface roughness, moreover, lower values of feed rate and depth of cut were recommended to achieve minimum machining forces and better surface roughness [5].
The research paper by Thangarasu et al. [6], made a study on optimization of milling parameters using Multi Objective Genetic Algorithm. They found that feed rate and depth of cut were the most significant parameters affecting surface roughness.
Nurul and colleagues [7], revealed that surface roughness was reduced when milling was done under the influence of magnetic field, and feed per tooth had the most significant effect on Ra, followed by cutting speed. Authors recommended a combination of higher cutting speed, lower feed rate, and small depth of cut to produce a good surface roughness in machined stainless steel specimens.
A study of machining of AISI 304L steel in dry milling was performed by Maurotto et al. [8], with the aim of characterizing its surface quality and microstructure. They found that high feed per tooth with less depths of cut and cutting speed rate, improved the surface roughness, besides cutting speed was the variable with the largest influence on it.
Muñoz-Escalona et al. [9] showed that dry cutting environment was the best option in terms of power consumption, surface roughness and materials microhardness values in milling of AISI 303 steel. The authors emphasized that high cutting speed with less feed rate improved these results.
Influence of undeformed chip thickness on cutting forces and temperature was studied by San-Juan et al. [10]. In their research, a comparison between up-milling and down-milling was performed, over the AISI 316L steel.
Influence of milling on the development of stress corrosion cracks in austenitic stainless steel was examined by Lyon et al. [11]. They found that machined samples have a biaxial tensile surface stress with a higher stress in the direction of milling.
Taner et al. [12] examined the effect of minimal quantity lubrication on surface integrity in robotic milling of AISI 316L steel. Their experiments showed that surface roughness is not affected by the MQL settings. However, the surface residual stresses can be decreased by well controlled MQL oil flow.
Maurel-Pantel et al. analyzed the effect of milling cutter angular position on cutting force, using the numerical simulation and the experimental study, in milling of AISI 304L steel [13].
Kumbhar et al. performed the optimization of milling parameters of stainless steel 304, using surface roughness and material removal rate as target variables [14].
A geometric approach for the milling cutter tool wear prediction was developed by Liu et al., in machining of AISI 304 steel with the high vanadium high-speed steel tool [15].
Based on this review, studies focused on searching for an optimum combination of cutting parameters to obtain a better value of surface roughness such as: high speed machining by Thangarasu et al. [6]; articles on medium speed machining by Nurul et al. [7], Maurotto et al. [8], Muñoz-Escalona et al. [9], as well as Kumbhar et al. [14]. However, there is not much research on low cutting speed, and the effect of feed rate and cutting speed on workpiece hardness has not been considered; therefore, these are the aims of this work.
2. Experimental procedure
The experiments are designed to investigate the effects of cutting speed and feed rate on surface roughness and hardness in dry milling of AISI 304 austenitic stainless steel.
AISI 304 steel in the hot rolled condition was the material chosen for the present study. It was provided in the form of plate with dimensions 800 mm x 20 mm x 20 mm. Its chemical composition was determined using a spectrometer of spark emission, and is presented in Table 1.
Table 1 Chemical composition of AISI 304 stainless steel workpiece (mass fraction, %).
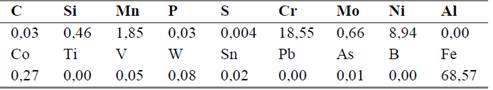
Source: The authors.
Machining trials were carried out on a X5032 universal milling machine, equipped with a maximum spindle speed of 1 500 r/min and a 7,5 kW drive motor.
Five workpieces for milling tests were used, with dimensions of 75 mm × 20 mm × 20 mm. Samples were identified with letters (A, B, C, D and E), and its lateral side with numbers (1, 2, 3 and 4).
The cutting tools used in this study were two end mill with three helicoidal flutes and a diameter of 16 mm. Chemical composition of the cemented carbide milling cutter was: 5 % of carbide of titanium, 10 % of cobalt and 85 % of carbide of tungsten.
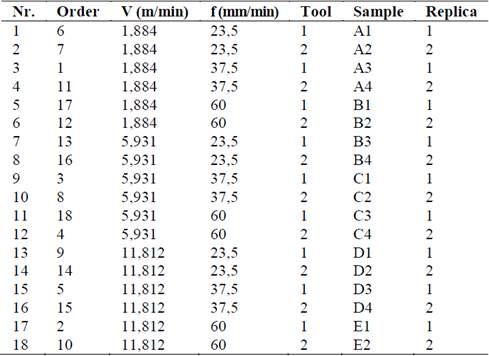
Three cutting speed and three feed rate, as well as a constant depth of cut (0,5 mm), and two replicates were included, leading to 18 experimental runs. Tests were randomized to minimize influences of the cutting tool wear and operator on the results. The machining experiment was stopped every pass to record the surface roughness (Ra) and hardness (HRB) of workpiece. The matrix of experiment is presented in Table 2.
In order to analyze possible changes in hardness of machined surface, ten hardness tests were conducted in each sample surface using a HRS - 150 hardness equipment. Hardness of the initial workpiece was measured in two specimens, with dimensions of 25 mm × 20 mm × 20 mm.
When a number of measurements of a same parameter is repeated, it could be obtained atypical or suspicious values, because it presents a notable difference with respect to other ones. Generally, applying normal distribution curve's properties, suspicious values can be detected and eliminated.
For numerous measurements of a magnitude, the average ( x ) and standard deviation (S) are calculated. Then, the interval is set up (eq. 1) for a given confidence level, and all the values that are left out of the aforementioned range are eliminated, because they are considered unusual. So, necessary calculations to express the final result are made again, without the uncommon values [16].

where t is interval that contain to µ. For 95 % of confidence level t = 1,96 [16].
In the Territorial Office of Standardization of Holguín, the surface roughness was determined using standard samples of comparison. It is a method in which touch, vision and experience are used to compare the roughness of a pattern plate with the surface to be evaluated. Grades are assigned to this surface according to the standards of the pattern used.
3. Discussion of results
The results obtained in the present investigation, as well as their discussion, are shown below.
The surface roughness was measured two times, while ten hardness measure were conducted, for each surface of the samples.
The mean, median, standardized bias, standardized kurtosis, first quartile and third quartile, for the hardness and surface roughness of machined samples, are shown in Table 3.
Table 3 Mean, median, standardized bias, standardized kurtosis, first quartile and third quartile, for the hardness and surface roughness of machined samples.
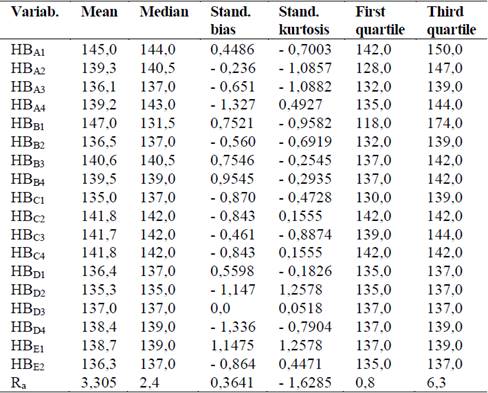
Source: The authors.
Generally, if the data are symmetric the mean and median coincide (HBD3). Usually, we find that median < mean if the distribution is skewed to the right (HBA1, HBB1, HBB3, HBB4, HBD2 and Ra), whereas median > mean if the distribution is skewed to the left (the rest).
When an ordered set of data is divided into four equal parts, the division points are called quartiles. The first or lower quartile, is a value that has approximately 25 % of the observations below it and approximately 75 % of the observations above. The second quartile, has approximately 50 % of the observations below its value. The second quartile is exactly equal to the median. The third or upper quartile, has approximately 75 % of the observations below its value.
The lowest first quartile (HBB1 = 118) and the highest third quartile (HBB1 = 174), coincide with the extreme values of cutting parameters (f = 60 mm/min and V = 1,884 m/min). Consequently, it coincides with the highest interquartile range (56), which indicates the maximum hardness variability. So, the difference between the Mean (147) and the Medium (131,5) is the highest (15.5) also.
The milling process is very difficult in these conditions (f = 60 mm/min and V = 1,884 m/min), because the distance in meters traveled by a point in the periphery of the milling cutter in one minute (v) is very low, and on the other hand, the linear distance traveled by the cutting tool at a constant feed speed with respect to the workpiece in one minute (f) is high. The vibrations increase during the cutting process.
Another high interquartile range were registered for HBA2 (19), HBA4 (9), HBC1 (9) and HBA1 (8).
The standardized bias and the standardized kurtosis can be used to determine if the sample comes from a normal distribution. Values of these statistical ones outside the rank from -2 to 2 indicate significant deviations of normality. In this case, the value of the standardized bias and standardized kurtosis are within the rank of data a normal distribution.
Atypical values of hardness were not found, then the average was determined, and converted from HRB to HB according to [17]. The hardness of the first sample was 181 HB and for the second 171 HB, therefore, the average hardness for this steel in supply state was 176 HB, a value that is within the theoretical parameters of original hardness of the material.
The hardness of the machined workpiece was 139 HB, that is, it decreased by 21 % with respect to the original hardness of the specimen (176 HB), which could be related to the heating of workpiece during the cutting process, this fact could be beneficial to a roughing pass, not so for a finishing pass.
Fig. 1, shows the effect of feed rate (a) and cutting speed (b) on the hardness of the machined workpiece. The increase of feed rate caused an initial decrease and then an increase in hardness for the lower cutting speeds, while for V = 11,81 m/min, hardness first grew and then tended to remain constant.
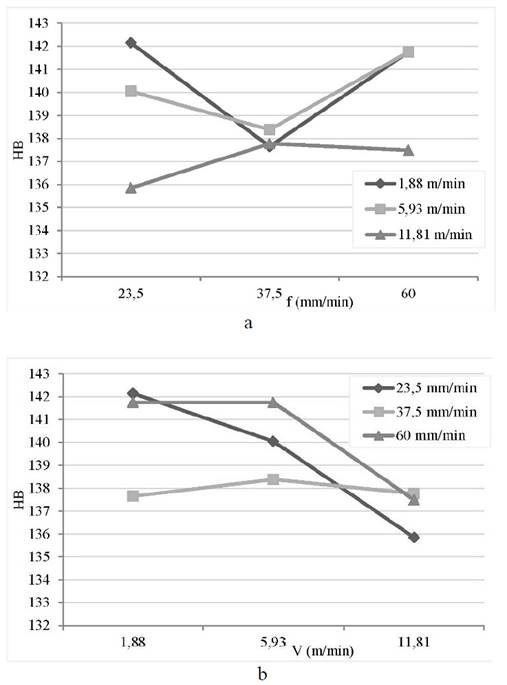
Source: The authors.
Figure 1 Effect of feed rate (a) and cutting speed (b) on the hardness of the workpiece.
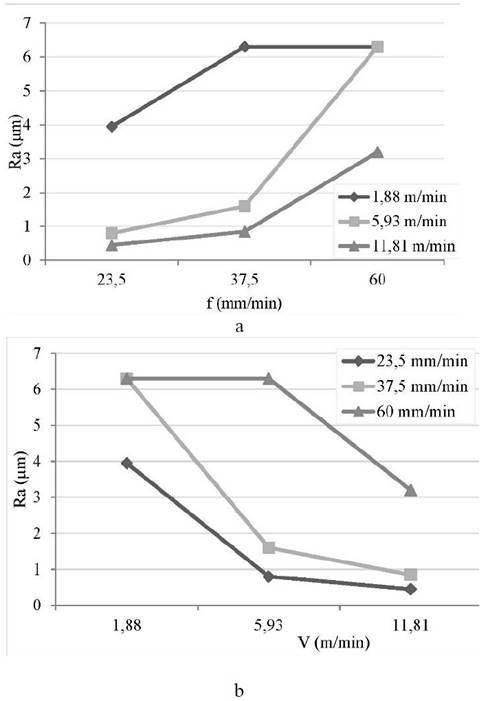
Fig. 2 shows the effect of feed rate (a) and cutting speed (b) on the surface roughness of the machined workpiece. The average surface roughness recorded was 3,3 μm, close to the recommended value for this type of operation (Ra = 3,2 μm), and ranged from 0,4 μm to 6,3 μm.
Source: The authors.
Figure 2 Effect of feed rate (a) and cutting speed (b) on the surface roughness of the workpiece.
The increase of feed rate (Fig. 2a) caused an increase in the surface roughness value, while the increase of cutting speed induced the reduction of roughness (Fig. 2b).
As for feed rate, it is usually assumed that surface roughness increases with the increase of feed rate, but not in linear proportion [18]. In the present study, a lower value of surface roughness was obtained at a lower feed rate, coinciding with the investigations of Hamdan et al. [5], Nurul et al. [7], Muñoz-Escalona et al. [9].
By decreasing feed rate and depth of cut, less material has to be cut per tooth per revolution, thus energy required is lower. Consequently, this would reduce the cutting forces, thus, preserve material properties against residual stress, the change in micro hardness at the subsurface, and leading to better surface roughness [4].
The result of cutting speed agrees with what is generally accepted, and with studies by Ozcelik et al. [4], Hamdan et al. [5], Thangarasu et al. [6], Muñoz-Escalona et al. [9], Kumar and Venkateswara [19].
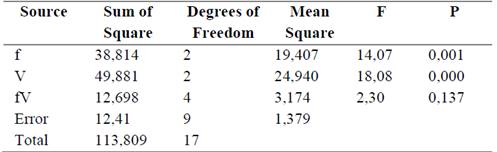
The multifactorial analysis of variance (Table 4) shows that the values of P are lower than 0,05; so the feed rate and cutting speed have a statistically significant effect on the surface roughness, at 95,0 % confidence level. However, the interaction of these two factors does not have a significant effect on the dependent variable, since the value of p is greater than 0,05.
3. Evaluation of results using the correlation among feed rate, cutting speed and surface roughness.
Below, the results obtained when using the feed rate, cutting speed and surface roughness in the regression study are shown.
To determine whether the variables (f, V, and Ra) are related, the following conditions must be met:
The coefficient of determination (R2) must be at least greater than 50%.
The F-value of the analysis of variance of the model is less than 0,05 (there is a statistically significant relationship between the variables with a confidence level at 95,0 %).
The P-value (the probability of t) of the independent variables should be less than 0,05 (statistically significant with a confidence level at 95,0 %).
The basic assumptions of regression analysis [20].
To determine the fitting model, multiple regression analysis is performed using the STATGRAPHICS software, equation obtained is as follows:

The R2 statistic indicates that the fitting model accounts for 88,62 % of the variability in Ra, sufficient value.
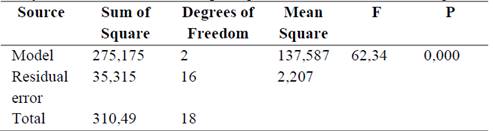
Table 5 shows that the value of P (probability of F) is less than 0,05; so there is a statistically significant relationship between the surface roughness and the independent variables for a confidence level at 95,0 %.
Table 5 Analysis of variance of the multiple regression model for surface roughness.
Source: The authors.
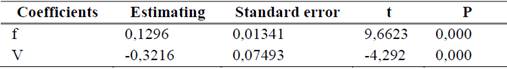
In Table 6, the P (probability of t) values of the coefficients are shown, they are less than 0,05; so they are statistically significant for a 95% confidence level.
Table 6 Analysis of variance of the coefficients of the multiple regression model.
Source: The authors.
In order to validate the model, it was verified that the basic assumptions were fulfilled, according to the classical Astakhov [21], it is sufficient that they fulfill the homoscedasticity and non-autocorrelation assumptions of the residues, and that coefficients of variables are statistically significant. In the present investigation, the assumptions of normality and zero mean were also checked. EVIEWS software was used for this purpose.
From the obtained histogram, the assumptions of normality and null mean were verified.
The critical region is: Probability (Jarque-Bera) < α (0,05 % significance level).
Decision: 0,71 > 0,05; therefore, the normality assumption is fulfilled.
The mean is equal to 5,34 10-16 and the assumption of zero mean is fulfilled.
The Breusch-Godfrey test was used to verify the non-autocorrelation assumption. The critical region is: Probability (n R2) <α.
For non-first-order serial autocorrelation: 0,307 > 0,05. Therefore, the assumption is fulfilled.
For non-order serial autocorrelation: 0,590 > 0,05. Consequently, the assumption is also fulfilled.
To verify compliance with the homoscedasticity assumption, the assumption will be verified with the non-crossover regression terms.
Critical Region: Probability (n R2) <α.
Decision: 0,055 > 0,05. Therefore, the assumption is fulfilled.
Consequently, the conditions are fulfilled to state that, the variables feed rate, cutting speed and surface roughness are related.
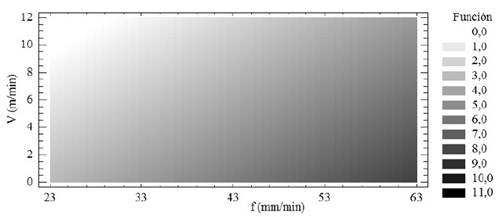
Figure 3 shows the contour plot to determine the lowest surface roughness values and their corresponding cutting speed and feed rate values. The best surface roughness values (Ra ≤ 2 μm) were obtained for the feed rates of f ≤ 43 mm/min, and for cutting speeds of V ≥ 6 m/min.
4. Conclusions
When analyzing the results of dry milling of austenitic stainless steel AISI 304, with a milling cutter of uncoated carbide inserts, they show that it is possible to obtain an adequate surface roughness for low values of feed rate and cutting speed. The grinding operation could be discarded.
The hardness of the machined workpiece decreased by 21 % with respect to the original hardness, which could be related to the heating of the workpiece during the cutting process. However, no significant change in hardness was observed with increasing feed rate and cutting speed. This was confirmed by the analysis of variance, since these variables did not present a statistically significant effect for a 95 % confidence level.
The highest interquartile ranges of hardness of the machined workpiece were observed for the lower values of cutting speed and the higher feeding speed, that is, a greater dispersion in the results, which is related to an increase in the vibrations of the cutting process, and therefore, the surface roughness worsens.
The statistical importance of cutting speed and feed rate in the surface roughness of the milled workpiece was verified. Being the cutting speed, the factor that most contributed to the variation of roughness.
The correlation equation between feed rate, cutting speed and surface roughness was determined. In addition, the model was verified by means of: the calculation of the coefficient of determination, the analysis of variance of the model, the statistical importance of the independent variables and the fulfillment of the basic assumptions of the regression analysis.
The contour plot of the model allowed to determine the best values of surface roughness (Ra ≤ 2 μm), which were obtained for feed rates of f ≤ 43 mm/min, and for cutting speeds of V ≥ 6 m/min.

