


 Inglês (pdf)
 Artigo em XML
 Referências do artigo
 Enviar este artigo por email
 Citado por SciELO
  Citado por Google
  Similares em
SciELO
Similares em
SciELO  Similares em Google
 Permalink
1. Introduction
A firm is considered to be successful when it positions its brand on the market with profitable operations. This is achieved by an efficient supply chain that allows managing the resources strategically. In this manner, accomplishing satisfactory service levels and highly attractive margins result in a differentiating advantage.
Configuring a supply chain design requires coordinating the flow of goods, money, and information between suppliers, manufacturers, distributors and retailers [1,2]. At the design stage of a supply chain, coordination is performed considering the decisions of facility location and transportation of goods in order to achieve high performance.
The performance of a supply chain design is often measured as the total cost of inventory management, transportation, and the fixed cost of using the facilities and other resources. Nevertheless, current requirements of the environment force companies to consider other performance metrics to evaluate the sustainability of the operations. Thus, operational risks, social impacts and environmental aspects must be considered in the decision making process of designing supply chains.
This paper proposes to study a non-hierarchical, or non-tier, supply chain design problem. This means that the product is shipped to the customers through different network levels, without any hierarchical sequences. E.g.: Products can be supplied directly from the production center or through intermediate nodes without any specific order.
Moreover, this work will use as solution method the combination of optimization models and Monte Carlo simulation. This represents a powerful development, since simulation enables to examine impacts while taking into account variability of the parameters, which makes the model to represent more realistic situations and to gain confidence in the solutions.
Then, the main contribution of the article is to carry out a comprehensive study of a supply chain design problem with the following features: 1) A supply chain design model with a generic structure is analyzed, by assuming a non-hierarchical closed-loop configuration, which generalizes the topology of a hierarchical supply chain. 2) Three objective functions are involved in the decision-making process in order to tackle the green challenge of supply chain designs and the trade-off with profitability. These objectives are associated to the economic, environmental, and risk dimensions of the considered operations. 3) Variability of the performance indicators associated to uncertainty is studied by integrating simulation techniques while evaluating the performance of the supply chain designs.
This paper is structured as follows: section 2 presents the state of the art, section 3 presents the proposed mathematical model, section 4 corresponds to the methodologies of developed solutions, and sections 5 and 6 present the results and the conclusions, accordingly.
2. State of the art
The supply chain refers to all activities related to the flow and transformation of goods and services from raw materials to final consumption [3]. Supply chain management can be classified into two broad categories: configuration and coordination. First, the configuration relates to the high-level design and the basic infrastructure of the supply chain. On the other hand, coordination is related to tactical and operational decisions [4]. This work is focused on the configuration category, which integrates elements of risk management and sustainability. For this reason, the literature review is presented around these concepts and their relationship.
Closed-loop supply chains are defined by Guide & Van Wassenhove [5] as the design, control and operation of a system to maximize the value creation over a product’s life cycle. The literature on the topic shows that progressive attention is focused on public awareness and laws to make the designs less harmful for the environment [6]. A closed-loop supply chain includes the concept of reverse logistics, in which residuals are collected at the customer after consumption to be recycled or destroyed.
Some works in the literature propose different approaches and variables to take into account relevant variables such as the prices, which affect the demand and thus the flow [7], provider’s ratings [8], as well as the extensions to more than one distribution channel [9], and even for more than one period [10]. Hierarchical models that take into account social and environmental impacts are proposed by [11] or diverse combinations of the previous ones, adding variables such as multi period time horizon [12].
Specifically, the design of supply networks that involve more than one objective to be optimized, comprises a wide variety of works that include objectives of different nature such as the minimization of transportation costs based on risk neutral criteria [13], economic and environmental performance according to life cycle assessment (LCA) principles [14], minimization of total daily cost and environmental impacts when applied to a hydrogen supply chain [15], decision analysis of a supply network integrating costs, customer service, and volume of deliveries [16].
According to the supply chain design supported in different models, environmental issues have not always been integrated to these models, or have not been evaluated explicitly. Nonetheless, based on the review by Eskandarpoura, Dejaxa, Miemczykb & Péton [17], it is concluded that some models include one measure regarding the environment and the social impact, either in the objective function or in the model constraints, while optimizing decisions related to the supply chain design, including location of facilities, means of transportation, design of production processes, technological options, among others [17]. This dimension has been treated with models such as: Life Cycle Assessment, reasoning maps, Analytic Hierarchy Process, Analytic Network Process, Data Envelopment Analysis, equilibrium models, simulation, and others. The main measure to estimate environmental impacts is based on carbon emission indicators, wastes, energetic consumption and recycled material [18]. Authors like Quariguasi Frota Neto, Bloemhof-Ruwaard, van Nunen, & van Heck [19] show that advantages of solving problems using multi-objective programming.
Additionally, regarding risk management, the literature shows that several works have been formulated for supply chain design models considering some kind of risk. For example, a multi-objective stochastic programming for the supply chain design considering financial risks is proposed in [20]; a stochastic model for risk management in global supply chain networks of multiple-stage, incorporating demand, exchange rate and the disruption risks is presented in [21]; a case-oriented approach to a lead-acid battery closed-loop supply chain network design under risk and uncertainty is studied in [22]; [23] presents a conceptual model for managing supply chain network risk. Tuncel and Alpan [24] propose the use of Petri nets to model and analyze a supply chain network subject to various risks. Moreover, simulation is a powerful tool to evaluate scenarios of the supply chain and to generate different options to improve operations. Further, tools for measuring and managing risks have been proposed, such as the "Supply Chain Resilience Assessment and Management (SCRAM™)". This tool focuses on environmental risks only and has proven to increase of the recovery capacity and a higher performance of the supply chain [25].
For this work the solution methods are based on methodologies that combine simulation with optimization. The integration of optimization with simulation, is a process whose objective is to minimize the resources spent while maximizing the information obtained in a simulation experiment [26]. Simulation-optimization techniques have been used for a few decades, firstly with a stochastic approximation during the 1950s. However, this technique has become more powerful in recent years due to the increase in computational capacity, that allowed providing alternative solutions of high-quality systems and promoting the introduction of uncertainty and risks [27]. Some examples of this kind of methods include the following: search methods based on probability gradients, finite differences and perturbation analysis; stochastic optimization; Surface response methodology; Heuristic methods such as genetic algorithms, evolutionary strategies and statistical methods such as classification and selection [27].
Table 1 summarizes relevant works of this literature review, developed in the last decade, which highlights interesting features of the chain design problems: sustainability (Sust), the risks (Risk) and other sources of uncertainty (Uncert.), as applicable:
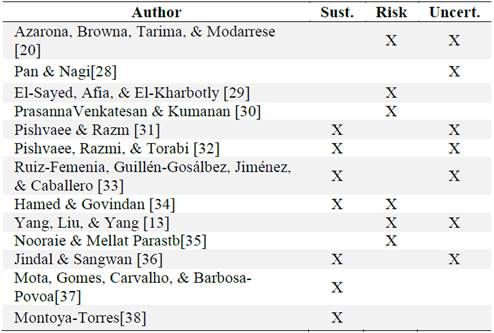
According to the review developed, it is concluded that several authors have worked on subjects related to supply chain design, risks and sustainability, while including uncertainty in order to consider variability of parameters. However, it is not common to find works that explicitly consider these aspects under uncertainty in an integral manner. Furthermore, stochastic programming modeling techniques predominate over simulation techniques as a solution tool. Nevertheless, it is well known that simulation techniques are more flexible and scalable to tackle large scale design problems.
3. Mathematical formulations
We consider a supply chain (SC) composed by 6 levels or echelons. Four levels are available to connect the production sites with the nodes representing the final customers. Further, two additional levels are included: one for recollection sites for collecting recyclable materials such as packing boxes, and the second one are destruction sites for the non recyclable waste. The assumptions made for the proposed model are the following: First, to satisfy the final customer’s demand (at level 4 of the SC), the product is delivered from the production centers (level 1) and distributed through warehouses or distribution centers, passing through retailers if necessary (levels 2 and 3, accordingly). Each facility is characterized for having a limited capacity, with known costs associated to CO2 emissions when the node is used.

Product transportation can be performed by two types of vehicles (Type I and Type II) whose characteristics change according to load capacity, cost, and the amount of CO2 emissions. Product may flow within the facilities at the same level of at different levels until the consumption nodes.
Additionally, product flow decisions consider a proportion to product loss in the arcs previous to customer delivery as a risk measure. After the product fulfils its function with the final customer, a proportion of this is picked and transported towards recollection centers (level 5). There, the selection process to decide whether the product can return to the plants to be reused or if it is sent to a destruction level is made (level 6). At this stage of the network, the closed-cycle is implemented. In Fig. 1, the studied network is shown.
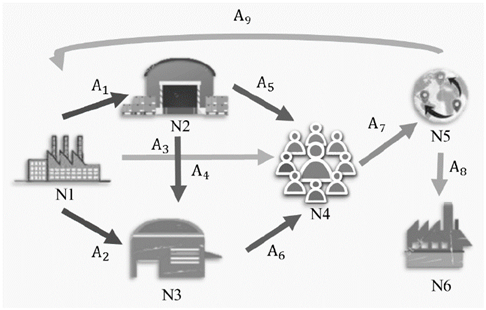
The problem can be formulated using the following notation. A directed, completed and weighted graph G={N,A} is defined, consisting of a set of nodes N, which represents the total number of facilities and customers of the supply chain. This set N includes the following subsets:
N1: Set of production plants
N2: Set of distribution centers
N3: Set of retailers
N4: Set of customers
N5: Set of collection centers
N6: Set of destruction centers
Additionally, the graph consists of a set of directed arcs A composed of the following arcs:
𝐴 1 : Arcs connecting production plants ( 𝑁 1 ) to distribution centers ( 𝑁 2 )
𝐴 2 : Arcs connecting production plants ( 𝑁 1 ) to retailers ( 𝑁 3 )
𝐴 3 : Arcs connecting production plants ( 𝑁 1 ) to customers ( 𝑁 4 )
𝐴 4 : Arcs connecting distribution centers ( 𝑁 2 ) to retailers ( 𝑁 3 )
𝐴 5 : Arcs connecting distribution centers ( 𝑁 2 ) to customers ( 𝑁 4 )
𝐴 6 : Arcs connecting retailers ( 𝑁 3 ) to customers ( 𝑁 4 )
𝐴 7 : Arcs connecting customers ( 𝑁 4 ) to collection centers ( 𝑁 5 )
𝐴 8 : Arcs connecting collection centers ( 𝑁 5 ) to destruction centers ( 𝑁 6 )
𝐴 9 : Arcs connecting collection centers ( 𝑁 5 ) to production plants ( 𝑁 1 )
A set of transport modes 𝑀 and a set of product types 𝑇={𝑛𝑒𝑤, 𝑟𝑒𝑐𝑦𝑐𝑙??𝑑} are considered. Furthermore, the following model parameters are considered:
} 𝑖𝑗𝑚 𝑇 : Unitary transportation cost in the arc (𝑖,𝑗)∈𝐴 using transportation mode 𝑚∈𝑀
𝐶 𝑢 𝐹 : Financial cost for using the intermediate node 𝑢∈ 𝑁 2 ∪ 𝑁 3
𝐶 𝑡𝑖 𝑃 : Unitary production cost of product type 𝑡∈𝑇 at production plant 𝑖∈ 𝑁 1
𝐸 𝑖𝑗𝑚 𝑇 : Unitary CO2 emissions for transporting product in the arc (𝑖,𝑗)∈𝐴 using transportation mode 𝑚∈𝑀
𝐸 𝑢 𝐹 : CO2 emissions for using the intermediate node 𝑢∈ 𝑁 2 ∪ 𝑁 3
𝑆 𝑖𝑗𝑚 : Percentage of product loss in the arc (𝑖,𝑗)∈𝐴 with transportation mode 𝑚∈𝑀
𝑄 ?? : Reception and processing capacity at node 𝑢∈ 𝑁 1 ∪ 𝑁 2 ∪ 𝑁 3 ∪ 𝑁 5 ∪ 𝑁 6
𝐷 𝑗 : Customer’s product demand in node 𝑗∈ 𝑁 4
𝛼 𝑗 : Expected proportion of product recovered from customers 𝑗∈ 𝑁 4 to be taken to collection centers.
𝛽 𝑘 : Expected proportion of product recovered from the collection center 𝑘∈ 𝑁 5 to be sent back to production centers.
𝐻: Very large number.
The proposed decision variables define the product flow on the network and activate the corresponding costs.
𝑃 𝑡𝑖 : Amount of product type 𝑡∈𝑇 manufactured in the production center 𝑖∈ 𝑁 1
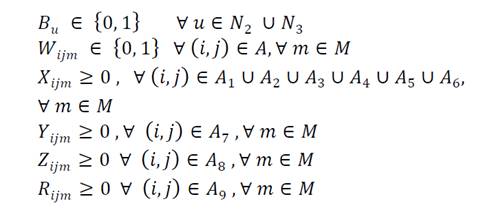
𝑋 𝑖𝑗𝑚 : Amount of product to transport in the arc (𝑖,𝑗)∈ 𝐴 1 ∪ 𝐴 2 ∪ 𝐴 3 ∪ 𝐴 4 ∪ 𝐴 5 ∪ 𝐴 6 by transportation mode 𝑚∈𝑀.
𝑌 𝑖𝑗𝑚 : Amount of product to transport in the arc (𝑖,𝑗)∈ 𝐴 7 by transportation mode 𝑚∈𝑀
𝑍 𝑘𝑙𝑚 : Amount of product to transport in the arc (𝑖,𝑗)∈ 𝐴 8 by transportation mode 𝑚∈𝑀
𝑅 𝑘𝑖𝑚 : Amount of product to transport in the arc (𝑖,𝑗)∈ 𝐴 9 by transportation mode 𝑚∈𝑀
𝐵 𝑢 = 1 , if the node 𝑢∈ 𝑁 2 ∪ 𝑁 3 is used to transport the product. 0, otherwise.
𝑊 𝑖𝑗𝑚 =1, if the arc (𝑖,𝑗)∈𝐴 is used with the means of transport 𝑚∈𝑀. 0, otherwise.
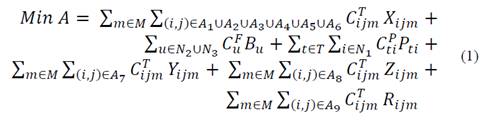
The proposed model seeks to optimize simultaneously the following three objectives:
-
Minimizing the total transportation cost + fixed cost of using nodes (location cost) + production cost. This is expressed in eq. (1).
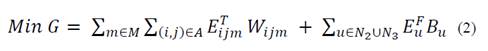
-
Minimizing the total amount of CO2 emissions in transportation, and the operations at nodes. This is expressed by eq. (2).
-
Minimizing the risk of product losses in transportation, computed by eq. (3).

The model is subject to the following constraints:
First, the demand must be completely fulfilled at each demand node:

Also, the SC has limited capacities. Thus, eq. (5) limits the reception capacity of products at each node.

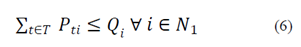
Eq. (6) limits the production and reception capacity at each production center:
Eq. (7) limits the amount of products that leave each production plant to be equal to the existing products:

Eq. (8) limits the reception capacity of products going from the collection center to each plant:

Eq. (9) limits the reception capacity of products at collection centers.

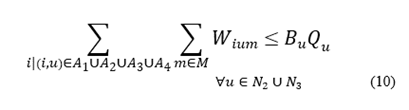
The following constraints coordinate the decision variables. Eq. (10) forces that if an arc is used, the associated nodes must be used:
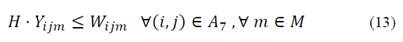
Eq. (11)-(15) coordinate the integer and binary decision variables associated with transportation decisions:


Eq. (16)-(19) are flow conservation constraints. The amount of product arriving at a destination node must be equal to the flow minus the proportion of product lost on the arc depending on the mode of transportation:


Eq. (19) guarantees that the amount of product arriving at the production centers from the collection center must be equal to the amount of products recovered, discounting the loss factor:

Eq. (20) guarantees that the expected proportion of products is sent from the customers to the collection centers:

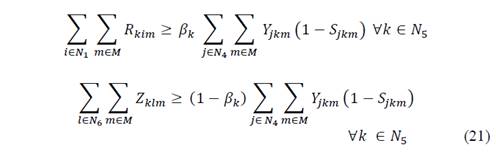
Eq. (21) and (22) guarantee that the products fraction must be sent from the collection centers to the nodes of origin and to the destruction centers:
Eq. 22 guarantees that the customer’s demand is fulfilled completely from a single source by using a unique transportation mode, where split deliveries are not allowed:

The following equations define the nature of the decision variables:
4. Proposed solution methodology
Three methods to solve the proposed problem are compared. These methods are classified according to the solution technique. The first one is based on mixed integer linear programming. The other methods include optimization and simulation. Combining optimization with simulation allows generating attractive solutions for the different objectives exposed, where simulation is a tool to replicate scenarios with several values for random variables.
4.1. Methods based on mixed-integer programming
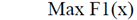
Solving a multi-objective problem requires to compute a number of solutions belonging to the Pareto-optimal set. The solution method chosen is the ε-constraint implemented as in Mavrotas [39]. It is briefly described next.
Consider the following multi-objective problem where x ∈ S, is a decision variable vector in the search space S. Let f1 (x),.., Fp (x) be objective functions.
In the ε-constraint method, one of the objective functions is optimized by using the other objective functions as constraints. Thus, iteratively, each constraint is allowed to deteriorate to improve the performance of other objective functions.
Subject to:
As performance measures for multi-objective optimization the hyper-volume, spread measure and spacing are typically used for multi-objective problems [40].
4.2. Methods based on optimization via simulation
Simulation has the advantage of being a tool that replicates situations with many relations among variables. A simulation engine is developed in VBA running with MS Excel and with the optimization model implemented in GAMS. This integration allows computing attractive solutions to solve the proposed objectives. Two different approaches are studied. Each one is explained next:
4.3. Approach 1: First stage: optimization. Second stage: simulation
This approach is developed by using the following method: First, the solutions of the Pareto-optimal set for the problem are obtained by using the ε-constraint method. Then, by using simulation methods, the solutions that do not show statistically significant differences are deleted. The steps for this method are the following:
Compute the Pareto optimal set of solutions using the method described in [40].
Each solution in the Pareto-optimal set is simulated in the SC simulation engine. This simulation varies the costs, CO2 emissions, and the proportion of product losses with a known probability distribution. The confidence interval is determined for each objective function with a defined significance level of 5%. The number of iterations in this step must be determined by the decision maker.
Then, the dominance of the solutions is analyzed by comparing all of them. The Pareto Set of solutions is said to be set of statistically non- dominated solutions. Thus, a solution is said to dominate another if there is at least a single objective that is statistically better without deteriorating the others.
When the solutions are classified, the total set of statistically different solutions is shown. With this input, the decision maker may select the one that fits better for the specific case.
4.4. Approach 2: Optimization-simulation cooperation
This model seeks to converge to attractive solutions in fewer simulation and optimization runs. This variant is explained with the following steps:
Solve the optimization problem with the most important objective function without restricting the values of the other two objective functions. The ideal value for that objective is computed.
Simulate the obtained solution to compute the confidence intervals for each one of the objective functions. Denote the lower limit of each confidence interval as 𝑓 𝑖 ′
Include in the mathematical model a set of constraints to the value of the constraints in the right side associated to the other two objective functions (secondary functions) taking into account the lower levels of the confidence intervals. For example:
-
- Quantity of emissions

-Amount of product loss
These constraints are treated similar to the ε-constraint method.
Solve the mathematical programming model once again, adjusting the right side of these two constraints.
Solve steps 2 - 5 until the main objective function has deteriorated until a tolerable limit or unfeasibility of the solution.
Check the dominance of computed solutions.
The number of solutions will depend on the analyst criteria, according to the acceptable range of each of the objective functions that can operate the supply chain.
5. Computational results
Results of the developed experimental studies are tested on 48 randomly generated instances, changing the number of nodes in each of the six levels of the supply chain, with three or six nodes per level and five or ten customers, which correspond to 24 different configurations. All the experiment are carried out in a computer with an Intel(R) Core(TM) i7-3930k CPU @ 3.20 GHz. Processor. 12 GB RAM. Operative system: 64-bit Windows 8. The mathematical models are solved using GAMS and CPLEX, and the simulation engine is developed in VBA.
5.1. Parameterization
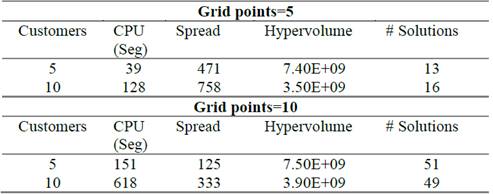
In the ε-constraint method, the number of grid points define discrete limits within the range in which each objective function is optimized to search for Pareto-optimal solutions. The larger the number of grid points, more solutions are likely to be computed since the step size in which objective functions are allowed to deteriorate is smaller. Our experiments work with 5 and 10 grid points.
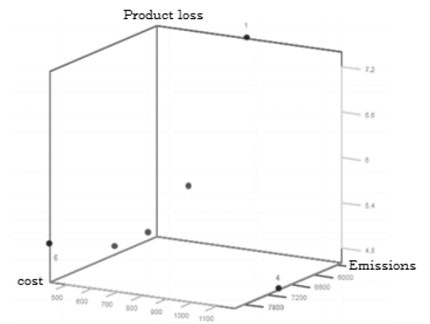
Fig. 2 is an example of the Pareto-optimal set solutions for one instance. It shows the location of the different solutions with respect to the objective functions and highlights those three that have the minimum value cost (C), emissions (E) and product losses (P).
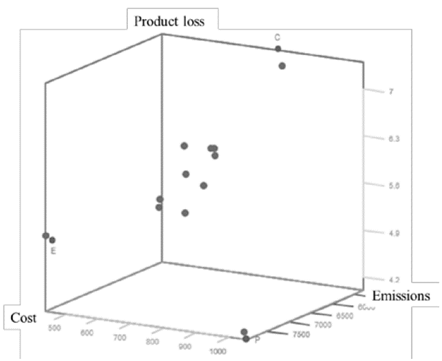
Table 2 details the results of the performance measures for the performed experiments using the traditional ε-constraint method with five and ten grid points. Note that the higher the number of grid points, the denser the representation of the efficient set, but with a higher computation time requirement. The solution distribution measuring throughout the Pareto-optimal set (spacing) is presented with better performance that those instances run with more grid points. The hyper volume is higher when the number of grid points increases.
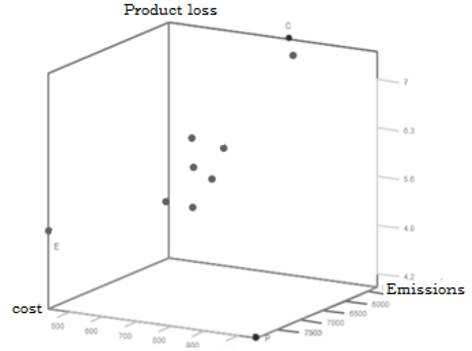
For the experimental development of these methods, 10 instances are randomly chosen. For the first proposed method, the simulation engine works with the solutions belonging to the Pareto Frontier obtained from the optimization model after applying the ε-constraint method. The Tukey test with a significance level of 5%, allows identifying which of the solutions show statistical differences. On average, about 60% of the solutions do not present statistical differences and therefore, these are discarded. Fig. 3 presents an example of the resulting Pareto frontier with solutions that are statistically different between each other.
In our experiments, the percentage of recovered product that may be recycled varies from 40%-60% of the total sold product. Also, when minimizing economic costs, the objective function is 5,289 in average. When minimizing exclusively one of the other two objective functions, the cost may be increased up to 50%. When minimizing CO2 emissions, the average optimal solution is 43,8Kg. This KPI is increased by 81% when the objective function is economic cost, and 140% when the objective function is minimizing risks. By setting the objective function to minimize the operational risks, the amount of lost product may be reduced up to 45%.
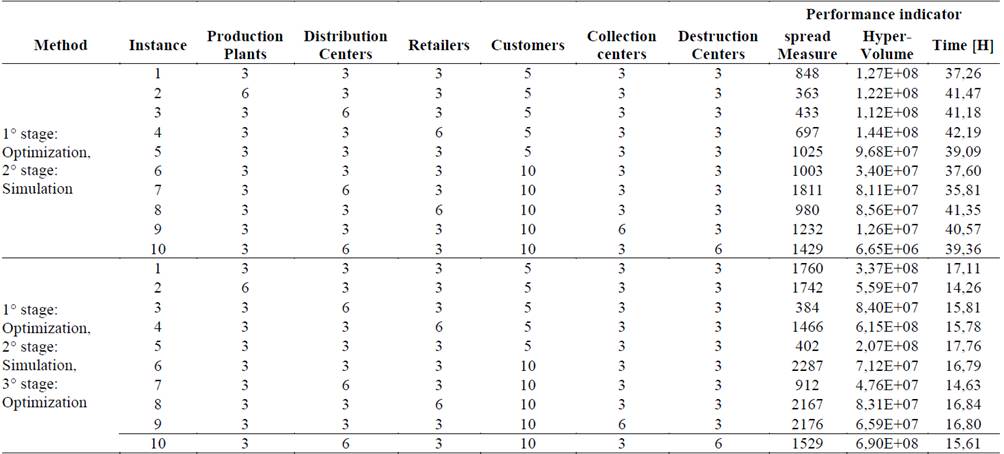
In Table 3, the configuration of the 10 studied instances is presented, together with the spacing and hyper volume values obtained for each developed Sim-Opt approaches. In general, the second approach presents a spacing measure of approximately 51% higher than the first one, since the search of solutions there lacks a reference point to move within the Pareto-optimal set, different from the first one. Instances 3 and 5 present better results since the intention was to move within closer values to reduce costs. The second approach requires less computational time and is more dedicated to finding statistically different solutions with limited economical costs. Fig 4. Presents the Pareto frontier approximation for this approach.
6. Conclusions and future work
This work proposes two multi-objective supply chain design approaches combining optimization and simulation techniques. Further, a generic closed-loop supply chain design is considered, in which product flow may happen between consecutive and non-consecutive echelons of the network, respecting the required steps for production and consumption.
The purpose of the considered approach is to build Pareto frontier solutions that are statistically different, and robust, so that the decision maker has different options to choose from. The traditional exact methods generate good results in theoretical terms. The Pareto-optimal set found there for each instance allows visualizing a large set of solutions.
Nevertheless, although multiple options are presented, this does not guarantee that these are statistically different, since this method does not take into account the variability from randomness in parameters.
Therefore, the cooperation between optimization and simulation methods is studied to bound the set of solutions, thus allowing the decision maker choose among the most convenient configurations. Computational results show that the proposed approaches reduce the number of solutions to 40% for not being statistically different.
The first solution approach is a two stage approach in which all the solutions obtained from a ε-constraint method are simulated using our simulation engine, and statistical tests are performed to determine statistical differences. If no statistical difference is proven, the solution is discarded. The second approach simulates each solution that is being evaluated by the ε-constraint method to determine confidence intervals of the solutions that constitute the bounds in which the objective functions must not be explored in subsequent iterations.
The main advantage of the second proposed approach is that the computational time requirements are considerably lower than in the first approach since fewer solutions are simulated.
Future works include a finer tuning of the number of replications required to compute the confidence intervals. Also, to consider a multi-objective supply chains design with hierarchical and multi-product settings, considering manufacturing operations. Besides that, it can contain multiple period decisions and routing decisions as in [41]. Moreover, other performance measures may be included, such as the financial risks and social sustainability. Furthermore, optimization methods based on meta-heuristic methods may also be taken into account in future works.

