


 English (pdf)
 Article in xml format
 Article references
 Send this article by e-mail
 Cited by SciELO
  Cited by Google
  Similars in
SciELO
Similars in
SciELO  Similars in Google
 Permalink
1. Introduction1
Similar to a society, the operation and maintenance of a university is a process of socioeconomic metabolism, in a network of complex interactions involving its processes and actors, taking various raw materials, energy and water and transforming them into products, services and waste. [1]. The adoption and implementation of a comprehensive environmental model, known as the Environmental Management System (EMS), is proposed to improve sustainability in academic institutions and for the reasons expounded above, as it can identify and address, in a systematic way, the various dimensions involved in the operation of the organization [1,2].
Using an EMS framework and rigorous and diligent studies, the thorough evaluation and consequent assessment of the Metropolitan Technological Institute of Medellín (ITM), was able to determine its most significant environmental aspects and impacts, developing for each of them an Objective, a Goal and a Program.
The purpose of the implementation of the different Environmental Programs is to promote sustainable development with reference to the ITM’s environmental policy, through the execution of programs aimed at the prevention and minimization of negative environmental impacts and the optimization of the use of resources in institutional processes, promoting environmental responsibility among the ITM community members, within the framework of fulfilling current environmental normativity. The environmental programs, being the objects of study of the present analysis, are listed hereafter:
- Efficient Use of Water and Water Saving Program
The purpose of this program is to promote a gradual standard of efficient water use within the ITM and to minimize the consumption of this natural resource.
- Efficient use of electricity and energy saving program
The purpose of the implementation of this program is to promote a gradual standard of efficient electricity use within the ITM and minimize the consumption of this energy resource.
- Comprehensive management of solid waste program
Established with the purpose of promoting the comprehensive management of the Institutions’ waste, while being able to identify the amount of solid waste generated by each member of the ITM community and to assess the effectiveness of the actions undertaken to reduce waste generation or keep waste generation at a minimum where possible. In addition, the program will help to identify the proportion of recyclable material within the total waste generated and the effectiveness of the actions taken to maximize recyclable materials.
This article analyzes the Robledo campus and each of the programs, starting with a comparison between the different instances of electricity and water consumption, and the report of the solid waste generation, for each month of the years 2015 and 2016, along with the information provided for the current year. Subsequently, a study of the sustainability and effectiveness of each program is carried out, based on sustainability indicators such as a decrease in the carbon footprint. The intention here is to show a positive environmental impact caused by the implementation of environmental programs within the ITM and the effectiveness of the measures applied by the EMS-ITM, as a step towards a carbon neutral institution.
1.1. Public services: water, electricity and sanitation
The drinking water and electricity service is supplied and managed by Empresas Públicas de Medellín (EPM).
The sanitation service is provided and managed by Empresas Varias de Medellín and consists of the collection, transport and final disposal into landfill. The landfill known as La Pradera is located within the jurisdiction of the municipality of Don Matías (Antioquia department), 60 km from the city of Medellín.
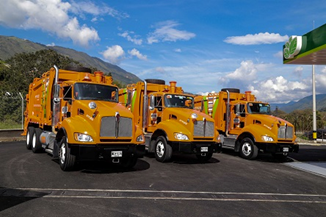
In Fig. 1, the make of garbage truck is shown to determine the type of fuel it consumes and its efficiency.
Source: EPM
Figure 1 Vehicles run on Natural Gas solid waste collection trucks of EMVARIAS of Medellín.
The information available on this type of vehicle and the closest approximation to the Medellín context is: “Kenworth T440 vehicle model 2017, equipped with a Cummins Westport natural gas engine of 320 Hp (horsepower) and 8900 cm3. The capacity of the natural gas tanks is 618 liters, equivalent to 155 m3, which gives an approximate range of 200 km.
This truck complies with EPA 2016 emission regulations, has a six-speed Allison automatic transmission, ABS brakes, anti-skid control and differential lock. The compactor unit has a capacity of 20 cubic yards for an equivalent compaction of 12 Tons '' Source: TGI2
This information on the landfill and garbage collection vehicles is used to determine the Carbon Footprint associated with the transport of solid waste generated by the ITM and how, indirectly, the recycling and composting of organic waste reduces GHG emissions by subtracting the amount of solid waste that must be transported to landfill.
2. Characterization of resource consumption and generation of waste
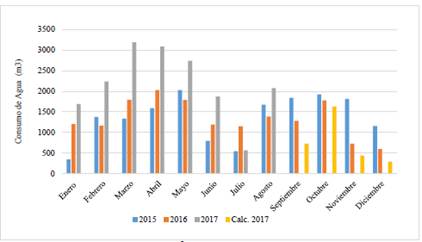
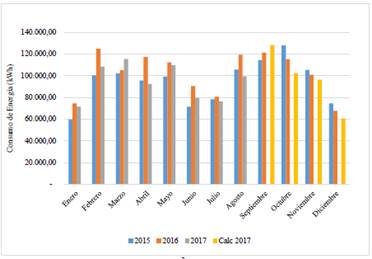
In this section, the consumption of electricity and water is described, as obtained from the invoices issued monthly by the suppliers of the different services mentioned for the years 2015, 2016 and 2017. The information is shown in Fig. 2 and in Fig. 3.
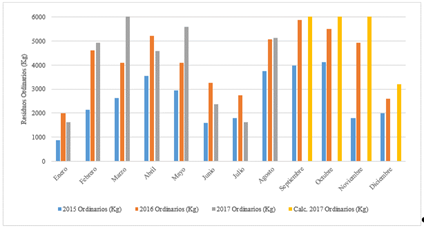
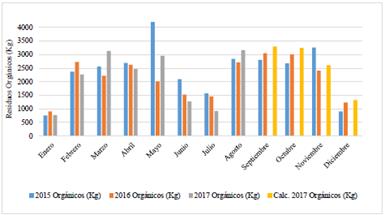
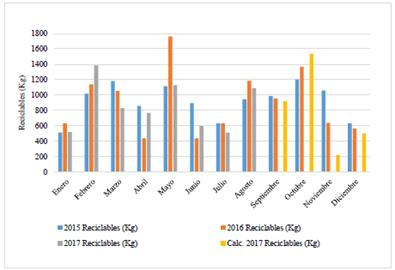
The generation of solid waste by type is illustrated in Figs. 4, 5 and 6. It should be noted that in the present study the Hazardous Waste generated by the institution is not taken into account, since the data analyzed here from the collection company, as well as the emission factors, are for the final disposal of solid waste in a Non-Hazardous Waste Landfill.
3. Methodology
The aim of this section is to briefly describe what a Carbon Footprint is, its method of calculation and the data needed to calculate it. This because the objective of the implementation of the programs proposed by the ITM’s EMS is to make use of the resources and to dispose of waste in a rational and responsible manner, that is, to look beyond the economic interests in the potential savings achieved by minimizing the consumption of natural and energy resources, and the generation of solid waste that goes to landfill. Instead, the main purposes are to have a positive impact on the environment, to turn the ITM into a sustainable institution, to minimize the emission of pollutants, to establish clean, pleasant and suitable spaces for students and workers, and become a carbon neutral institution.
3.1. Definition of Carbon Footprint
As an indicator of sustainability, Carbon Footprint serves to determine total emissions of greenhouse gases (GHG), emitted by the direct or indirect effect of an individual, organization, event, product and/or service [3-5]. The method of measurement of this parameter or indicator consists of creating an inventory of GHG emissions, based on a Life Cycle Analysis, for each of the materials, resources and services required by the object of study during all its useful life or for an established period of time [6,7].
3.2. Calculating Carbon Footprint
Before starting calculations for the Carbon Footprint, all anthropogenic GHG emissions within the organization must be estimated (CO2, CH4, N2O, HFC, PFC and SF6), and then, this information is converted into equivalent CO2 emissions (KgCO2 eq) using the global warming potential factor [8,9]. Table 1 shows the conversion factors of the different GHG to Kg of CO2 equivalents.
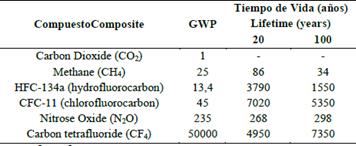
The information reported in Table 1, together with the Emission Factors (Table 2) and Eq. (1), are used to calculate the Total Carbon Footprint in Kg CO2eq.
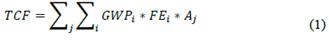
Where TCF is the Total Carbon Footprint in Kg CO2eq, GWPi is the Global Warming Potential or the conversion factor, for the GHG i to Kg CO2eq, FEi is the GHG i Emission Factor of the Activity or Resource j and Aj is the factor of the total consumption of the resource or service studied.
3.3. Scope of the study
To calculate the Carbon Footprint, first, the direct and indirect emissions are quantified, assuring that they are within the operational limits and the scope of the study [8,12]. These are described below and are illustrated graphically in Fig. 7.
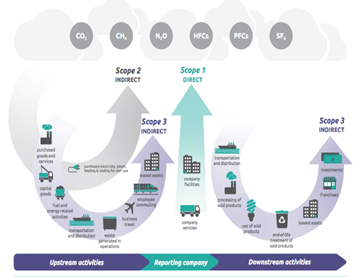
Source: [12]
Figure 7 Graphical representation of the study dimensions used to determine GHG emissions.
Due to the characteristics of the resources consumed, waste generation and services rendered, this study focuses solely on indirect emissions, which correspond to Dimension 2 (Water and Electric Power) and Dimension 3 (Sanitation Service), since the resources and services considered are provided by organizations in which the ITM has no intervention and/or operational control [4,8,12]. However, the ITM has used the recycling of waste and the composting of organic or biodegradable waste as mitigation measures for the emission of GHGs [11,13-15], which are taken from Dimension 1, since the ITM has operational control of these two activities and also, has so within the limits of the operation of the university institution. Additionally, these activities reduce the environmental impacts related to the emission of GHG through the use of collection trucks, from the place of collection to the landfill.
3.4. Emission factors by type of resource, services contracted with third parties and GHG emission mitigation activities
Table 2 shows the GHG generation emission factors for the different resources and activities related to the development of the environmental programs analyzed in the present study.
Table 2 GHG emission factors for the energy and natural resources used by the ITM, and others related to the generation of solid waste.
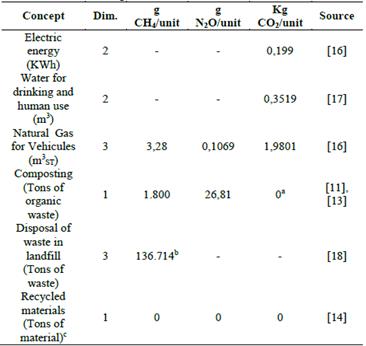
a Composting operations are considered carbon neutral (KgCO2/Ton=0) [11]
b Landfill without methane recovery (CH4)
cPost-consumption waste from the First Life do not have any environmental burden when they are recycled and used as raw materials in the Second Life [14]
Source: the authors
3.5. Quality of data, considerations and assumptions about missing information
3.5.1. Electricity and drinking water
As there is no information available for the months September to December 2017, they will be calculated based on the percentages of increase or decrease in consumption of these resources for these same months in 2015 and 2016, as the ITM’s consumption dynamics repeat year after year.
3.5.2. Solid waste
Given that there is no information on solid waste for December 2015, the information from January 2016 will be used, since the ITM’s waste generation dynamics for these two months are similar.
For the missing solid waste generation information from 2017, it will be calculated in the same way as the calculation of the electricity and water consumption of the missing months from the current year.
3.5.3. Factores de emisión, constantes y datos secundarios Emission factors, constants and secondary data
This study uses information provided by the entities related to the evaluated material, product or service. If information from primary sources is not available, information reported in the literature will be used, as long as it is suitable for the Colombian context.
4. Carbon Footprint results
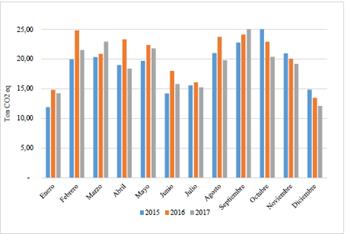
4.1. Electricity
In Fig. 8, the Carbon Footprint (TonCO2 eq) associated with the consumption of electricity is shown, month to month, for the years studied.
4.2. Organic waste
The organic waste is the entire biodegradable portion separated from the total waste generated in the ITM Robledo. Additionally, as mentioned above, this biodegradable portion is disposed of and treated entirely through composting processes at the ITM. Therefore, they do not generate GHG by being transported to landfill and also because they are subjected to anaerobic biological degradation at the final disposal composting site, and so this treatment is considered a mitigating agent in the emission of GHG.
Below, Table 4 shows the CF along with the emissions not created because there is no need to transport to landfill since the final destination is the composting equipment.
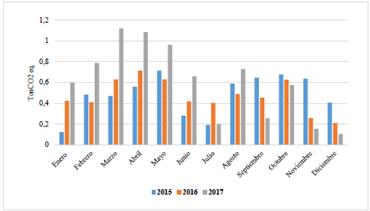
4.3. Drinking water
In Fig. 9, the Carbon Footprint (TonCO2 eq) associated with the consumption of drinking water is shown, month-to-month, for the years studied.
4.4. Solid waste
4.4.1. Ordinary solid waste
Ordinary waste is any material disposed of at the different solid waste collection points, which cannot be harnessed or revalued in any way and therefore are taken to landfill for final disposal. This study considers environmental impact as the GHG emissions from the collection trucks combusting
Vehicular Natural Gas during the transport of material from the ITM Robledo to landfill. In Table 3, the emissions of the different GHGs and the Carbon Footprint (KgCO2 eq) are shown.
Table 3 Carbon Footprint (KgCO2 eq) and GHG emission, for the transport of ordinary waste from the ITM Robledo to the landfill.
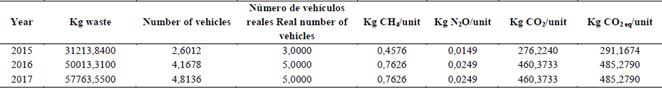
Source: the authors
Because it is not disposed of in landfill and due to its biological degradation inside the final disposal tanks, organic waste does not generate GHGs. Therefore, as shown in Table 5, GHGs that are no longer emitted by this waste are subject to a harnessing process through composting.
Table 4 Carbon Footprint (KgCO2 eq) and GHG emission, for the transport of organic waste from the ITM Robledo to landfill.
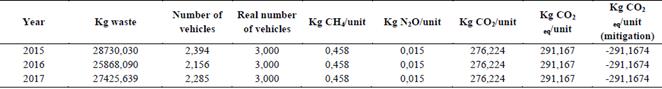
Source: the authors
Table 5 Carbon footprint (TonCO2 eq) and mitigated GHG emissions, due to the non-disposal of organic waste in landfill, without methane recovery.
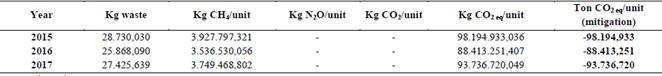
Source: the authors
Table 6 illustrates GHGs resulting from an organic waste composting process similar to that carried out at the ITM

4.1.2. Recycling material
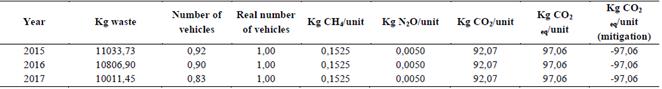
The recycling material is the entire portion of waste that contains materials that can be reused by other people or organizations as raw materials for goods manufacturing processes, such as plastic, paper, and cardboard among others. These are separated from the total waste generated in the ITM Robledo. This type of material does not generate GHG from its transportation to landfill, since it acquires new value and so is considered a mitigating factor in GHG emissions.
Table 7 shows the CF along with the emissions not expelled due to the fact that there is no need for transportation to landfill, given that this portion of the waste is revalued and returned once again to the production cycle and thus avoids the consumption of virgin resources and energy, to manufacture the same material anew.
5. Total Carbon Footprint (Ton CO2eq.)
Figs. 10 and 11 shows the consolidated total HC (Ton CO2eq.) per year, for the consumption of electricity and drinking water respectively.
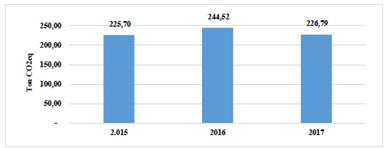
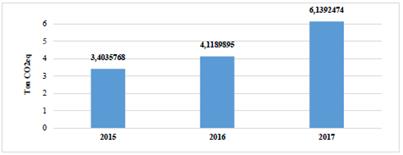
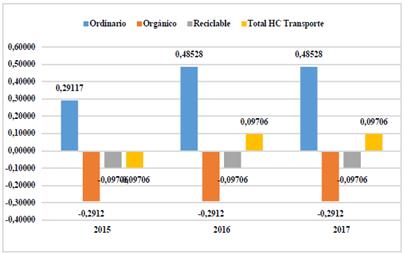
Fig. 12 shows in graph form the Total CF (Ton CO2eq.) associated with the transport of ordinary waste and the impact of composting organic waste and recycling activities on this indicator.
Source: the authors
Figure 12 CF (Ton CO2eq) for the TRANSPORTATION of ordinary solid waste and the mitigation activities of composting and recycling.
Fig. 13 illustrates the results obtained for the mitigation of GHGs that would be generated if all the organic waste was not degraded under anaerobic conditions in landfill, since now it is being used to produce a bio-fertilizer through composting. In addition, GHGs emitted during the compost production process are included.
Source: the authors
Figure 13 CF (Ton CO2eq) for the composting of solid organic waste and the mitigation activities from non-disposal in landfill.
Fig. 14 illustrates the ITM Robledo campus’ Carbon Footprint in Ton of CO2 eq, for the various activities and consumption of resources that are impacted by the different environmental programs and GHG mitigation practices implemented in the institution.
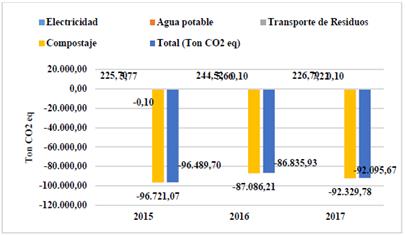
Source: the authors
Figure 14 Carbon Footprint in Ton of CO2 eq of the ITM Robledo campus, for the different activities and consumption of resources.
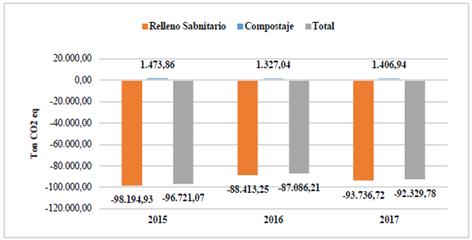
Fig. 15 illustrates the consolidated Carbon Footprint in Ton of CO2 eq, for the years analyzed. This information demonstrates the effectiveness of the environmental programs implemented and lead by the EMS coordination team at the ITM.
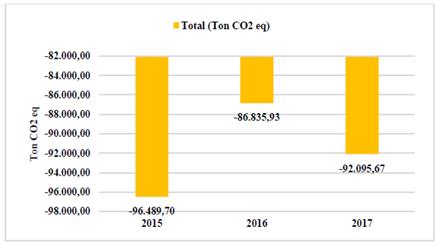
From an analysis of Fig. 15, the effectiveness of the environmental programs is clearly evident, since the sustainability indicator Carbon Footprint results in negative values for the years studied. This indicates a mitigation of GHG emissions, which brings the institution closer to the goal of being carbon neutral or "zero emissions".
6. Conclusions
Electric Power and Drinking Water consumption do not show a clear trend due to decreases shown month by month between 2015 and 2016, yet for the same month between 2016 and 2017 consumption rebounds and increases. In the case of Water, an increase is evidenced year after year. This may be due to the fact that the environmental programs implemented depend on an organizational culture, so despite the efforts made by the ITM’s EMS in the dissemination of the programs and training on the ideal and sensible use of water and energy resources, it is evident that the ITM community is not totally aware of them. However, when analyzing the consolidated electricity consumption per year, a decrease of 7% between the years 2016 and 2017 is evidenced. Thus, there is a decrease in the Carbon Footprint indicator of 17.73 Ton of CO2eq for this resource. Therefore, programs for the efficient and sensible use of water and energy resources can be considered as alternatives for the mitigation of GHG emissions in any organization.
By observing the analysis of the Total Carbon Footprint resulting from the GHG mitigation activities, which in this case are recycling and the composting of organic waste, it can be concluded that these two processes are high impact mitigation actions. This especially in the case of the composting of the biodegradable portion of waste generated in the ITM Robledo campus, since unnecessarily transportion of these two types of material to landfill is avoided and they are revalued, due to the fact that they are reintegrated into the production cycle; recycling as raw materials for different industries and organic waste as fertilizer, through composting. In addition, methane gas formation is avoided, it being normally produced if the organic portion is disposed of in a landfill without going through any harnessing and/or revaluation processes. For example, GHG emissions from composting are approximately 1.5% of the emissions generated when organic waste is disposed into landfill.
The success of the GHG mitigation within the ITM Robledo campus, through the implementation of recycling and composting, is due to the fact that this campus has more direct control, since success depends on the training of all cafeteria and general office staff to correctly separate waste and clear guidelines for the coordination of the EMS-ITM, in terms of sanctions, follow-up activities and continuous improvement of the practices implemented. For this reason, these types of alternatives should be implemented in other organizations, given their effectiveness in mitigating GHGs, the low investment required for their implementation and the environmental awareness that is generated in the whole organizational community.

