


 Inglês (pdf)
 Artigo em XML
 Referências do artigo
 Enviar este artigo por email
 Citado por SciELO
  Citado por Google
  Similares em
SciELO
Similares em
SciELO  Similares em Google
 Permalink
1. Introduction
Quality engineering involves management in the stages of product design, manufacturing process design, manufacturing, and customer use. Reduction of the effect of noise factors and part-by-part variation in manufacturing should be considered within the design phases. The main objective of robust parameter design (RPD) is obtaining the optimum levels in the control factors, with which the average performance of the process is improved. At the same time, the variation around the mean of the process is reduced [1]. The definition of robustness indicates that the solution obtained by means of the RPD is one in which is minimized the effect of noise factors in the process. Noise is something difficult to control in the process, there is a need to reduce the variation in critical quality characteristics.
In Taguchi's original proposal, a double experimental arrangement is used. There is an arrangement for noise factors called “internal arrangement” and an arrangement for noise factors called “external array” in which noise factors are integrated, these factors are expensive or difficult to control. The combination of values for each factor is defined in rows and consists of a treatment. The experimental region is defined by the extreme values of the control factors under study.
The RPD methodology has evolved from the advice of areas of opportunity by several western statistical authors [2]. One of the proposals to streamline the experimental effort is based on the use of an experimental matrix in which both the control and noise factors are integrated, called the "combined array", which can reduce the number of experimental runs. The use of the combined array allows working on the response surface scheme with several designs, such as factorials, fractional factorials, Box-Behnken, Box Draper designs, among others [3].
Optimization procedures for the double orthogonal array and the combined array are found in the literature. In these proposals, an approach based of response surface models for the mean and models for the variation (variance, standard deviation, signal to noise ratio SNR) is managed. Among the optimization proposals for the RPD is that of Kim & Lin [4] which is an approach to diffuse modeling. Kim & Cho [5] presented a proposal based on an RPD model that ponders the point of view of the engineer at the product design stage. Del Castillo & Montgomery [6] used the nonlinear programming problem for RPD optimization. Köksoy & Doganaksoy [7] use a mean squared error (MSE) reduction approach and joint optimization of the mean and variance. Copeland & Nelson [8] used quadratic nonlinear programming techniques for the direct minimization of the variance and set the target to a target value as a constraint. Lin & Tu [9] presented a definition of the MSE that allows moving a little away the mean of the Target value, in addition to the minimization of the variance. This approach allows obtaining better optimization solutions. All of the above methods are based on the analysis of a single process response.
In this research, a proposal of analysis for a sole vulcanizing process is presented. The two quality characteristics are analyzed based on tests of tension and hardness in the material. The methodology involves the use of the combined array in the experiment and the use of optimization techniques based on restricted nonlinear optimization by genetic algorithms. The objective function of the optimization problem involves the use of the Taguchi loss function. In order to use an economic approach to reduce the expected cost due to costs of non-confirming in the product. The main contribution of this work lies in the analysis of the multi-objective problem in the RPD and the use of a loss function-based scheme. Likewise, there are no analyzes in the literature to optimize parameters of the vulcanized process in rubber for shoe soles. Due to the high competitiveness and quality demands on the part of footwear users, it is important to carry out studies to establish standards for the evaluation and improvement of quality in the materials used in the product to achieve optimal performance. The objective can be achieved by using techniques for process optimization.
2. Generalization and approach of the proposal
2.1 Combined array, models for mean and variance
Welch et al [10], presented an alternative to the double orthogonal array of Taguchi. In this strategy, the control and noise factors are combined in a single experimental matrix. The main advantage of this scheme is that the number of runs or experimental treatments is significantly reduced, remembering that every experiment consumes resources. The experimental structure is shown in Table 1.
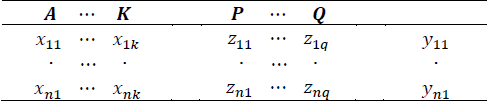
Data generated by this experimental strategy allows the generation of a model that is based on the control and noise factors obtained, the expression can be represented as eq. (1):

Where x’ = ( x1 , …, xk ) k control factors, z = ( z1 , …, zq ) q noise factors, y 0 the constant. Parameter vectors, β'=(β 1 ,…,β k ), δ'=(α1,…,αq), B=(β11,…,β1k,βk1,…,βkk) and C=(α 11 ,…,α 1q ,…,α k1 ,…,α kq ) are the second order parameter matrix, y ε~N(0,σe 2). We have the following assumptions for noise factors: E(z)=0, Var(z)=V and diag(V)=σz 2.
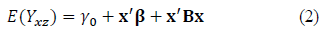
The expressions for the mean (conditional expectation) and variance are shown in eq. (2) and eq. (3)

The model in eq. (1) is fitted by the least squares’ method. Subsequently, eq. (2-3) are estimated according to the required terms. An important detail is that the model in eq. (1) must contain control x noise interactions, in order to determine the eq model. (3). Terms δ+x' C are the partial derivative with respect to z of the individual elements and interactions that contain z in eq. (1).
2.2 Quadratic loss function
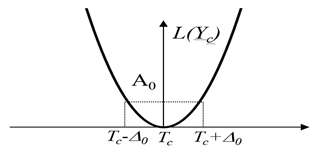
This model was introduced by Dr. Taguchi to provide a monetary estimate of the loss that the manufacturer causes to customer when the performance of their product differs from the target value. That is, it is used in cases for quality characteristics of the type “Target is the best”. Let Yc the quality characteristic of a product and Tc the target value for Yc. According to the quadratic loss function, its equation is represented in eq. (4).
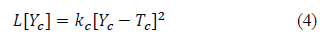
L[Yc ] is given by a Taylor series expansion around Yc=Tc neglecting the cubic terms hereafter. Constant kc is known as the coefficient of quality loss for the quality characteristic, it is defined as eq. (5).
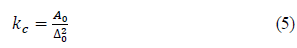
In which A0 is the cost r los to repair a product when quality is not met, ∆0 refers to the tolerances allowed before the product exceeds the functional limits. The quadratic loss function is shown in Fig. 1.
The expected value of the loss is shown in the ec. (6).
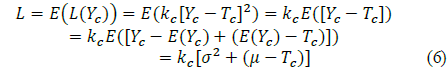
The eq. (6) is an important part of the objective function for the proposed optimization scheme.
Note that when Yc=Tc the los is zero. The loss L(Yc ) increases when the quality characteristic Yc moves away from Tc. The loss function is a model that implies that the average cost of loss with quality characteristic Yc is L[Yc] and it is clear that the loss it will cause to a particular client will depend on the operating conditions.
Some applications of the use of the loss function for optimizing RPD problems for a response can be found in Sharma & Kumar [11] who submitted an application proposal in conjunction with the QFD for provider selection. Pandey et al. [12] proposed the use of the loss function for the optimization of a preventive maintenance design and quality policies. Pi & Low [13] proposed the evaluation of suppliers using the loss function as the main weighting.
2.3 Multi- Objective Optimization in RPD
The problem of multi-objective optimization in RPD has been influenced by schemes applied to classical Experimental Design. The desirability function initially proposed by Harrington [14], is emerging as a good option for optimization of multiple objectives in the DRP, since the minimization of the variance between the desired objectives can be focused. Wu & Chyu [15] presented a multi-response optimization proposal in the DRP based on the use of Eq. 7, which is applied in correlated models. Hsieh [16], proposed the use of artificial neural networks in the problem of multi-objective optimization of DRP using different degrees of importance consideration.
Pal & Gauri [17] proposed the use of multiple regression and the Taguchi SNR applied to the RPD for dynamic characteristics. Fang et al. [18] applied optimization techniques for multi-objective DRP in the analysis of fatigue in truck cabins. Le Chau et al. [19] analyzed a leaf compatible articulation problem for micro positioning systems. Nejlaoui et al. [20] proposed a DRP and multi-objective optimization scheme for the analysis of a railway vehicle moving on short radius curved tracks according to safety and comfort criteria.
2.4 Genetic Algorithms and Proposed Optimization Problem
Within meta-heuristic search techniques, genetic algorithms are computational techniques widely used for solving problems in which it is important to find the global optimum. They are particularly useful in the use of highly nonlinear, non-differentiable, discontinuous, or stochastic functions. The techniques have been extensively analyzed by Goldberg [21].
Genetic algorithms can be used for solving constrained or unconstrained optimization problems. The basis of the technique is the imitation of natural selection processes that occur in biological evolution. The algorithm repeatedly changes a population of individual solutions in an iterative process that involves selection, reproduction, mutation, crossover, and migration techniques. In their mathematical form, populations are matrix arrays, an individual may appear on more than one line of the matrix, and they change as new generations occur.
The fitness function is the function to be optimized and is equivalent to the objective function of traditional optimization schemes. In each iteration, new generation sequences are created that evolve according to the optimization conditions declared in the problem [22]. The evaluation of fitness function defines the most appropriate ranges of values called expected values. The new individuals with the best fitness values are called elite and move on to the new population. For the improvement of the new generations, the children of the elite are produced by random changes in an individual relative (mutation) or by the combination of inputs of a relative pair (crossover), the population is replaced with the children to form the next generation. The algorithm will stop when a stop condition determined by the analyst occurs.
The proposed optimization problem falls under the constrained nonlinear optimization scheme. The objective function contemplates the minimization of the total cost. The problem involves the use of the superimposed loss function in the distribution of the data. The probability areas related to the loss function and the normal distribution at the three important points are taken: the area before the lower specification limit, the area between the specification limits and the area after the upper specification limit. The objective function is defined in eq. (7) and the restrictions on eq. (10-11).
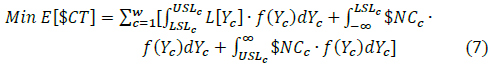
Where
Where E[$CT] is the total expected cost (fitness function). LSLc y USLc are the specification limits for lower and upper respectively for each of the quality characteristics, Y
c is the quality characteristic (c=1,2 for the analysis case: 1 for hardness, 2 for maximum load). L[Y
c ] loss function for quality characteristic, $NC the manufacturing cost associated with non-conformance to specifications.
 the regression model fitted for the mean of the quality characteristic c,
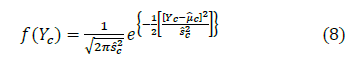
 is the fitted regression model for the variance of the quality characteristic c. f(Yc ) the normal distribution function as a function of the means and variances
, T
c is the target value for the quality characteristic, k
c is the quality loss coefficient for the quality characteristic. In all cases, c changes as subscript to Maximum Load or Hardness.
is the fitted regression model for the variance of the quality characteristic c. f(Yc ) the normal distribution function as a function of the means and variances
, T
c is the target value for the quality characteristic, k
c is the quality loss coefficient for the quality characteristic. In all cases, c changes as subscript to Maximum Load or Hardness.
2.5 Characterization of rubber for shoe sole
Footwear sole research presents important opportunity areas, as there is currently not much information or study references for this specific type of material. Modgil et al [23] presented a study on the modeling and duration of the shoe sole. Mares & Domínguez [24], presented a study on the optimization of quality characteristics in a polyurethane sole process using RPD and binomial responses. Derringer & Suich [25] proposed a modification in the desirability function and validated with a study in one type of rubber, the experiment presents variation in the formulation of the components and four quality responses analyzed with laboratory tests. On studies available for other types of rubber, Nandi et al [26], applied an optimization scheme based on genetic algorithms for the development of a silicone rubber reinforced with particles for smooth machining processes. Skrobak et al [27] analyzed the mechanical properties of rubber samples.
The experimental tests for the case of analysis consist of carrying out tensile tests on rubber and thermoplastic elastomers under ASTM D412-06 [28], carried out on the universal laboratory machine, and testing hardness tests on rubber under the ASTM D2240-15 standard [29], made with the use of shore A scale durometer. The first test gives the maximum load data in kN and the second one gives the hardness data on shore A scale. Both characteristics are of the Nominal type and Target-is-the-best type. The main objective of the research is to obtain the optimal parameters in the vulcanization. Therefore, the best values are obtained in the response variables. Another goal is to reduce the effect of variability and the noise factor in the process. An example of noise is the ambient temperature and can have an effect on the temperature of the molds throughout the day. The optimization objective is the reduction of the variation and the reduction of the mean of the variables from the nominal or target values, while reducing the cost for non-compliance with quality.
3. Materials and methods
Fig. 2 shows the proposed methodology for the analysis case.
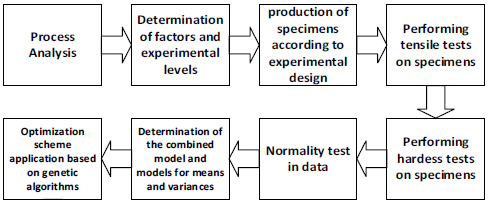
Initially, a process analysis is carried out to detect critical variables, here the use of operation diagrams and cause and effect diagrams are recommended. Once the critical process (vulcanization) has been detected, the experimental factors and levels are defined according to the experts' knowledge,the levels are defined based on the conditions of the process. Based on the number of factors and levels an experimental design is selected, based on the experimental runs the test specimens are produced. Once the specimens are identified, the experimental tests are carried out in the laboratory for the two quality responses, the experimental matrix is filled and data is captured in software.
Normality tests are required on the experimental data because the objective function in eq. (8) it is modeled based on the normal distribution; it should be noted that other distributions can be worked once their own parameters are known. The regression models in eq. (1-3) are fitted and substituted in the optimization problem in eq. (7-11). Finally, optimization is performed through the use of genetic algorithms to obtain the optimal levels for the control parameters.
3.1 Process analysis
The rubber sole manufacturing process begins with the weighing and mixing of raw materials (raw elastomeric rubber, fillers, carbonate base, silicates, oils, acids and chemicals. The mixing of materials is done in a mill called "bámbury", which works with special blades with temperature. The mixing is carried out in a specific time and a mixture of material in the form of paste is obtained. Subsequently, color pigments and accelerators are added on rotating roller machines. The material obtained is in the form of strips, which are taken to a cooling area. Then, material is brought to the cutting area by means of soles in the shape of the sole. The following process is considered the most important for obtaining quality characteristics, which is vulcanizing (Fig. 3).
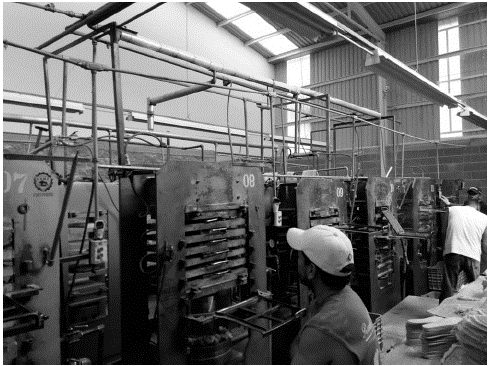
Here, the sole is shaped into molds with a combination of pressure, time and temperature and it is the area where more defects can be generated if the process parameters are not correct and well controlled. The final processes are carried out in the prefinishing area in which the characteristics of the sole are detailed through deburring, carding and brushing processes. Finally, the batching of the sole is carried out.
3.2 Determination of experimental factors and levels and testing of specimens
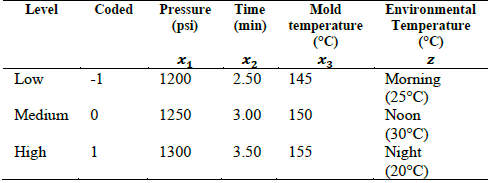
The experimental control factors are the pressure, time and mold temperature. The noise factor is the environmental temperature, which is a factor that can interact with the temperature of the molds causing variation throughout the day. It is desirable to reduce the effect of said factor in the process. Factors and experimental levels are shown in Table 2.
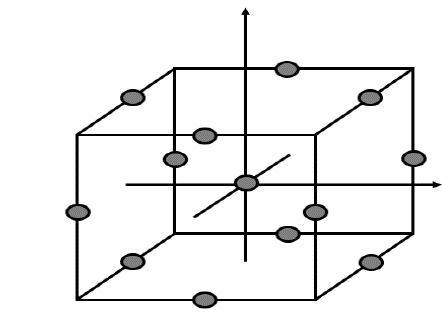
To carry out the experiment, a Box-Behnken design was selected. The design is applied when there are three or more factors and it has good orthogonality and rotatability properties, which can be found in [30].
The design points are located at the edges of the cube centered at the origin. This design does not include vertex treatments that are sometimes very extreme and cannot be run due to process conditions. The representation of the design is shown in Fig. 4.
The experimental tests were carried out on a universal laboratory machine (Fig. 5). The ASTM D412-06a procedure contains the methodology to evaluate the tensile properties of thermoplastic rubber and elastomers. The test evaluates the residual elongation of a test sample, which consists of permanent (plastic) and recovery (elastic) components. It is important to take time and burden into account for testing. The applied method is the A, in which specimens in halter form with standard measurements are used. The response variable evaluated in the test is the maximum load, measured in kN.

3.3 Testing of specimens
The data obtained through the tests of tension and hardness in the rubber specimens are shown in Table 3.
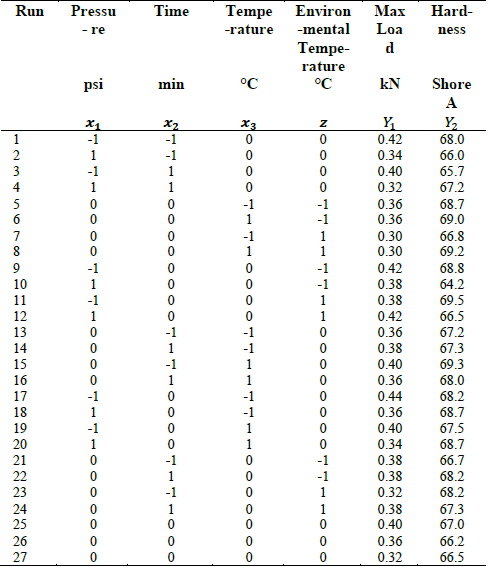
From the data obtained, the least squares method is used to fit the eq models. (1) - (3).
3.4 Normality test in the data
Given that the proposed objective function proposes the analysis of the distribution of the variables and normal behavior is assumed; it is necessary to verify compliance with the assumption in the two response variables.
Fig. 6 shows the normal probability graph for the maximum load variable. The graph shows a distribution of the points around the line and little variation at the ends. The Anderson-Darling test indicates a P value = 0.262> α = 0.05, which indicates that the idea that the data comes from a normal distribution with parameters μ=0.3696 y σ=0.03736 cannot be rejected.
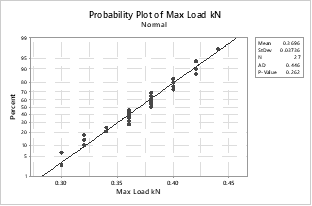
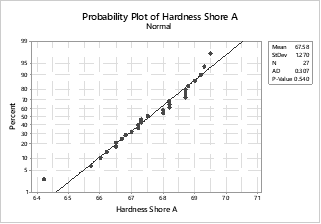
Fig. 7 shows the normal probability graph for the hardness variable. A distribution of the data is observed mainly around the line and little variation in the extreme data. The Anderson-Darling test shows a value P = 0.540> α = 0.05, which indicates that the idea that the data comes from a normal distribution with parameters μ=67.58 y σ=1.270 cannot be rejected.
4. Results
4.1 Determination of the models
For the determination of the models in eq. (1) it is necessary to particularly maintain the control x noise interactions to determine the variance model in eq. (3). There are no significant elements in the model, but they are maintained in order to cover the previous requirement. Only terms x2,x1 x2 y x3z are removed which yielded a value of β=0, likewise the interaction z2, which is not necessary for the variance model. The four terms are eliminated to gain degrees of freedom in the error, the model is shown in eq. (12).
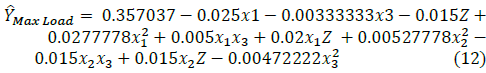
The model presents a value of R2=53.2755 %, a standard deviation of the residuals = 0.0325569. The analysis of the residuals for the model is shown in Fig. 8.
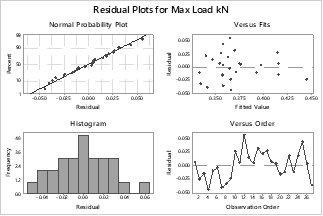
The assumption of normality is adequately met in the residuals. Homoscedasticity is also fulfilled in the absence of patterns or funnel shapes in the residual vs. fits plot. The assumption of independence is also fulfilled in the absence of detectable patterns in the data, indicating the absence of autocorrelation in the data.
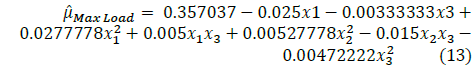
From the previous model the models for the mean in eq are defined. (13) and the variance in eq. (14). For the variance model it is assumed that σ2 z1=1 and S 2 1 it is estimated from the central points of the design as S 2 1=0.001059951738, leaving the model as eq. (15).


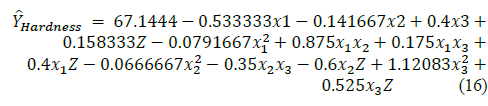
In the model for hardness only the term z2 is eliminated to gain degrees of freedom in the error, the model is shown in the eq. (16).
The model presents a value of R2=51.55 %, a standard deviation value for the residuals = 1,24979. The analysis of the residuals for the model is shown in Fig. 9.
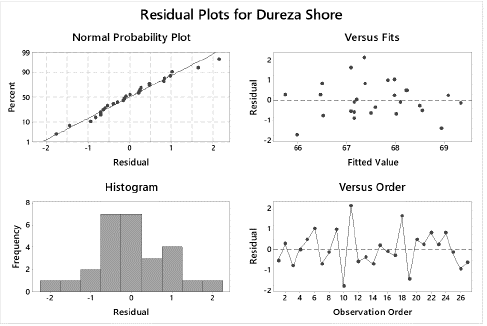
The assumption of normality is adequately met in the residuals. Homoscedasticity is also fulfilled in the absence of patterns or funnel shapes in the residual vs. fits plot. The assumption of independence is also fulfilled in the absence of detectable patterns in the data, indicating the absence of autocorrelation in the data.
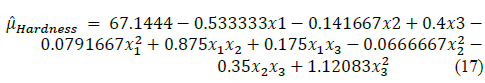
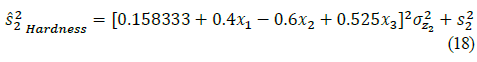
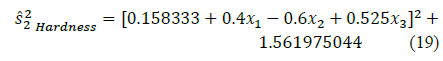
From the previous model, the models for the mean in eq are defined. (17) and the variance in eq. (18). For the variance model it is assumed that σ2 z1=1 it is estimated from the central points of the design as S 2 1=1.561975044, leaving the model as eq. (19).
Once the models for the mean and variance of the maximum load and hardness have been obtained, the optimization scheme is applied.
4.2 Optimization by genetic algorithms
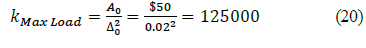
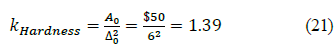
For the application of the experimental scheme indicated in the eq. (8)-(12) the following elements are defined: the cost or loss for repairing a product when it does not meet any of the quality variables is defined asA0=$50. Tolerances for maximum load = 0.35 kN ± 0.01 kN, tolerances for hardness = 67.5 Shore A ± 3 Shore A. therefore the constant k (Max Load) is defined in the eq. (20) and the constant k Hardness is shown in eq. (21).
The specification limits for Maximum Load are defined as LSL (Max Load) =0.25 kN and USL (Max Load) =0.45kN. Target value is T (Max Load) =0.35 kN. The specification limits for hardness are defined as LSL Hardness =64.5 Shore A and USL Hardness =70.5 Shore A, Target value is T_hardness=67.5 Shore A.
The loss function for maximum load is defined in eq. (22), the model  Max Load
is the one shown in eq. (13). The loss function for hardness is shown in eq. (23), the model
Hardness
is the one shown in the eq. (17).
Max Load
is the one shown in eq. (13). The loss function for hardness is shown in eq. (23), the model
Hardness
is the one shown in the eq. (17).


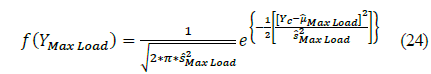
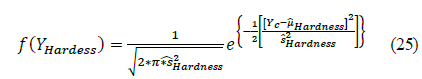
The model for the normal distribution based on the estimated means and variances is shown in the eq. (24-25).
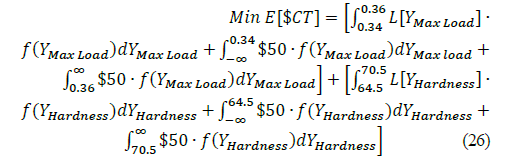
The cost of non-compliance $NC (Max Load)=$NC Hardness=$50. Once all the terms are known, we proceed to substitute all the elements in the objective function shown in eq. (26).
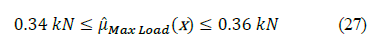
The constraints for the optimization problem are defined as eq. (27-31).


The initial parameters for the genetic algorithm are shown in Table 4.
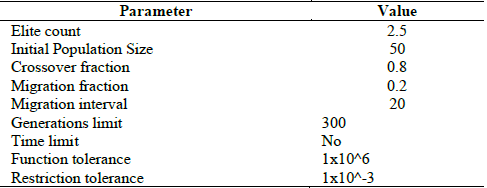
Fig. 10 shows the scoring histogram obtained with the genetic algorithm. The algorithm converges in iteration five with approximately 40 individuals on the optimal value. The coded values obtained for x1=-0.007, x2=0.904 and x3=0.632. The value obtained for the function E[$CT]=38.79277383.
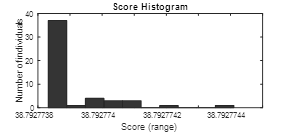
Fig. 11 shows the graph of the distribution of the hardness variable with the optimal values obtained in superposition with the loss function. It can be seen that the area of the distribution that exceeds the specification limits is the minimum possible under the experimental conditions.
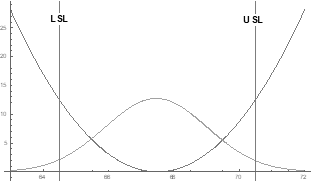
The mean is very close to the Target value where the loss is zero. It is observed that the optimization objective is met by minimizing the variation and reducing the distance from the mean to the Target value. The expected cost is a function of the distribution area that goes beyond the specification limits.
Fig. 12 shows the distribution with optimal parameters and the loss function for the variable maximum load. It is observed that the variation of the distribution is little and the specification limits are not exceeded. The mean value is close to the Target value where the loss is zero.
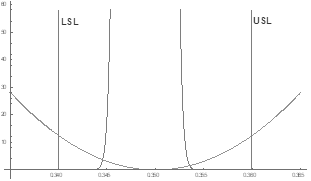
Optimization objectives are considered met by reducing the variance and reducing the distance between the mean and the Target value. It is observed that this variable contributes very little to the expected cost because it is under control.
4.3 Discussion
The analysis of results yielded the optimal levels for the vulcanization process. The main objectives of the multi-objective RPD are to reduce the variation around the mean and to reduce the distance of the Target value from the mean. The mentioned objectives must be satisfied for all the quality variables involved.
Performing a comparison of the optimum levels obtained with the usual levels of the process, the values indicated in Table 5 are obtained.
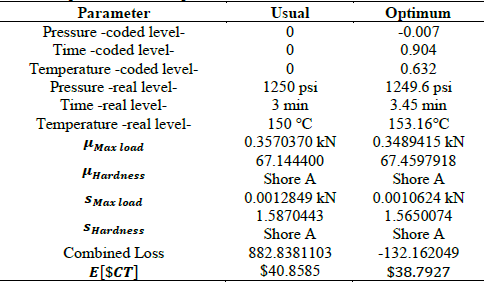
Defining the combined loss as ∑c c = 1 kc [σ2 + (µ - T c ) ] Table 5 shows a comparison of the usual parameters used in the process and the optimal parameters obtained, a reduction in the variation in both the Maximum Load and the hardness is observed. The mean value is closest to the Target value in the two variables. The combined loss is significantly reduced with the use of the optimal parameters. The total expected cost value is reduced with the use of optimal parameters.
All the reviewed indicators indicate the fulfillment of the objectives of the proposed optimization scheme; with which the efficiency of the scheme is verified to obtain the optimal parameters of the process for the fulfillment of the quality characteristics.
5. Conclusions
RPD is a technique for quality improvement with application in various industrial processes. The evolution of the methodology allows the analysis of more complex processes in which more than one characteristic or objective of quality improvement is involved. The multi-objective analysis of the RPD allows obtaining compromise solutions that adequately meet various objectives in a process.
The sole manufacturing process is an area that requires research, as there is currently not much information in the state of the art. It is required to define the standards for the definition of a high-quality product that can compete in the market according to world quality requirements. The proposal presented allows knowing the best parameters in the vulcanization process of rubber for sole assuming that the formulation variables are ideal.
Future research plans include sequential experimentation schemes that include formulation elements. The parameters obtained in the rubber sole manufacturing process are feasible to apply in the real process and represent a potential improvement in quality and savings in the process.
Based on the present proposal, the aim is to work with the schemes with characteristics of the type: the smallest is better and the largest is better, in order to make comparisons with other existing optimization schemes and the analysis of their effectiveness.
The use of an evaluation criterion is important in the use of optimization problems. The economic criterion is the most important indicator to use and represents an efficient starting point for continuous quality improvement. It was noted that the way in which the expected cost can be reduced is to either reduce the variation; or reduce the distance from the mean to the Target value.

