


 English (pdf)
 Article in xml format
 Article references
 Send this article by e-mail
 Cited by SciELO
  Cited by Google
  Similars in
SciELO
Similars in
SciELO  Similars in Google
 Permalink
1. Introduction
Different strategies have been established to improve theeconomic growth of companies through an increase in their competitiveness. Because this involves the companies’ abilities to supply goods and services within a market in the presence of other companies (competitors), strategies to win market share from them must be addressed with different analytical tools [1].
In particular, the a-priori identification of the strongest competitor, and its likely responses within the market, are two main strategic features which can improve the companies' competitiveness. Note that this involves qualitative and quantitative factors that must be studied through an integrative decision process.
Decision making is a problem-solving activity that can be defined as the selection of a course of action among several possible alternatives to achieve the most suitable solution. Depending on the problem's complexity, this activity may involve the integration of different criteria and analytical tools, leading to multi-criteria decision processes [2]. This, however, is not an easy task because different alternatives may conflict with each other based on the same set of decision criteria. The use of formal analytical tools can reduce this risk for the efficient assessment of alternatives associated with the best outcomes [3].
In this work, a multi-criteria decision-making approach is described to evaluate and improve the competitive strategy of a food company which is focused on two alternatives for expansion:
Increasing the production volume of current products.
Introducing the production of a new product line.
These alternatives are considered to increase the profits of the company and recover some of the market share which has been lost due to the presence of two strong competitors. Thus, the proposed multi-criteria approach contributes with the assessment of the competitors' profiles to evaluate their likely responses to the company's actions. As many criteria are associated with these aspects, tools of analytic hierarchy process (AHP), game theory, decision tree and design of experiments (DOE) were considered for this decision approach.
This work is organized as follows: first, Section 2 presents the technical background of the tools considered; then, in Section 3, the details of the approach within the context of the company's requirements are presented and discussed. Finally, the results are presented in Section 4 with the conclusions and future work presented in Section 5.
2. Technical background
2.1 Analytic hierarchy process
AHP is an analytical method in which quantifiable and non-quantifiable data can be analyzed to support decision making. This is important because experience and knowledge mixed with data are the basis to make appropriate decisions [4].
AHP was developed by Thomas Saaty in the 1970s to solve the cognitive limitations of decision makers [5-7]. It facilitates the identification and assessment of the factors which contribute to a solution. The AHP is performed in two stages:
a) A hierarchical structure is designed which relates criteria to alternatives. Note that more than one structure is possible as they are built according to the available information.
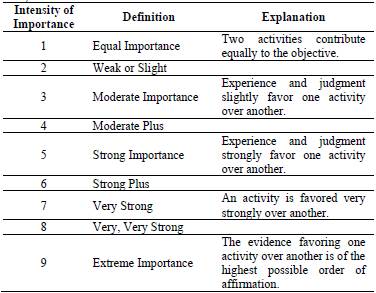
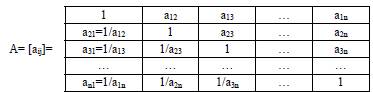
b) The assessment of each identified criterion with each alternative is computed as a comprehensive metric. As in the previous stage, more than assessment is possible due to the assignment of "importance" scores to each criterion and alternative. The Saaty scale (see Table 1) helps to prioritize and weight this information to achieve consensus among the decision makers. It is based on paired comparisons of the identified criteria and evaluates their consistency: "the elements in a level of the hierarchy are compared in relative terms as to their importance or contribution to a given criterion that occupies the level immediately above the elements being compared" [4]. Once identified and evaluated, the criteria of the hierarchy model are added to obtain the overall weight; this is known as the principle of hierarchical composition [4]. To compare the criteria, the evaluation or comparative matrix of elements by level and consistency must be constructed (see Table 2).
2.2 Game Theory - Bayesian Game
Game theory is the basis for the analysis of decisions under conditions of risk, conflict or cooperation between participants. The game method can be used to simulate the strategic relationship between two or more players, with the objective of finding the best reward for all players. Although game theory is used in many areas, it is very popular in economics. Modern business is characterized by aggressiveness, determination and timely decision making, all of which are focused on generating profits. Game theory helps to make the best decisions as quickly as possible, so that entrepreneurs can manage their profitability within the current markets, which are highly dynamic [8].
Because game theory is the logic behind strategic science, mathematical research and conflict and cooperation, it is a powerful tool to analyze how the decisions of multiple participants may affect the compensation of each participant [8].
In general terms, game theory considers two schemes: a broad form of play, and the result of a larger game composed of more basic games [8]. The broad form defines a set of possible actions for players in the game, the sequence of these actions and each decision maker or player's understanding of the actions and preferences that other players can take. Any sequence of actions taken along the broad form or "path of play" ends with a result. Players prefer integrity and delivery of results, and these preferences are represented by utility functions [10].
By learning the concepts and models of game theory, decision makers can improve their understanding of the dilemmas they may face in different situations, thus solving problems in a more rational way [11]. Thus, game theory has been successfully applied to many important problems such as in negotiations and financial risk assessment [12-15].
2.3 Decision trees
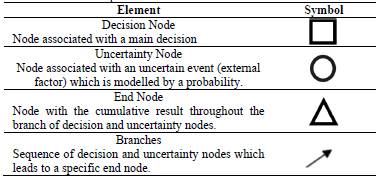
The decision tree is a method of selecting the most appropriate alternative in a decision process based on several available options. This method makes use of a tree structure, as more than two options may be available, and branches represent the different outcomes and associated decisions which may be associated with each option. Note that the different alternatives also involve the presence of risk, which is modelled with probabilities. This is because the alternatives also depend on the uncertainty of external factors [16]. Table 3 presents the main elements of a decision tree.
To build a decision tree, the decision maker must be provided with the best and most complete information, in this way reducing the risk in order to provide the most reliable solution.
2.4 Design of Experiments (DOE)
DOE is a statistical tool which supports the identification of data patterns from a series of experiments to determine the variables and their interactions which are more likely to influence a response or variable of interest. When using this tool, it is essential to know the system and the purpose of the experiment in order to be able to distinguish interactions that are not significant and to handle errors more assertively [17]. Although it is an effective tool to improve and optimize processes and products, its application requires specific conditions to perform the experiments and to measure the response. Hence, experiments must be planned well in advance, and the following stages are identified [18]: Identification of the Problem; Selection of the Factors and their Levels (states of a factor); Selection of the Response Variable; Selection of the Experimental Design; Realization of the Experiments; Analysis of the Information; and Conclusions and Recommendations.
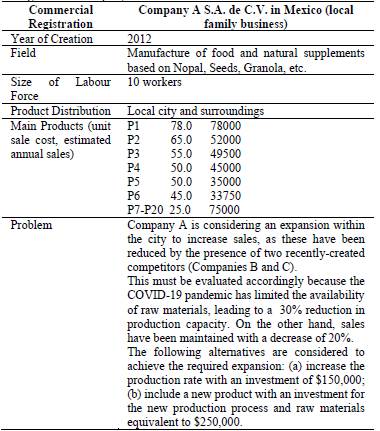
Company A is considering an expansion within the city to increase sales, as these have been reduced by the presence of two recently-created competitors (Companies B and C). This must be evaluated accordingly because the COVID-19 pandemic has limited the availability of raw materials, leading to a 30% reduction in production capacity. On the other hand, sales have been maintained with a decrease of 20%. The following alternatives are considered to achieve the required expansion: (a) increase the production rate with an investment of $150,000; (b) include a new product with an investment for the new production process and raw materials equivalent to $250,000.
3. Methodology
As an initial stage, it is important to gather information regarding the situation, characteristics and requirements of the company of interest (A). In this case, Table 4 presents an overview of this information.
On the other hand, it is important to gather information regarding some features of the competitors (B and C). Table 5 presents an overview of this information.
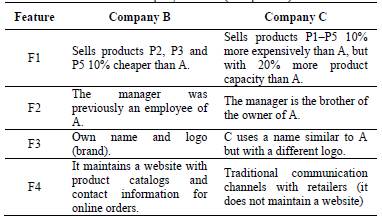
This information was analyzed to identify the strongest competitor between companies B and C. For this purpose, the AHP tool was applied with the features reported in Table 5. Note that these features were associated with the following criteria: Price (F1→ P), Relationship with Company A (F2 → R), Identity/Brand (F3 → I), and Channels (F4 → E).
Thus, five pair comparison matrixes were generated and importance scores were assigned according to the Saaty scale. First, the comparative analysis was performed between criteria (one 4x4 matrix), and second, between competitors based on each criterion (four 2x2 matrices).
In each matrix it was necessary to verify the consistency of the scores (to reduce the risk of conflicting evaluations). The consistency index was computed as reported in [19].
The following assumptions were considered for the assignment of scores:
Matrix 1 (4x4 between all criteria). It is considered that price (P) and the available communication channels (E) are more important than identity (I); the relationship of the owner with Company A (R) is moderately more important than identity (I), and slightly more important than price (P).
Matrix 2 (2x2 between B and C based on I). B is considered more important than C because it possesses a name and image, which differentiates it from the other competitor.
Matrix 3 (2x2 between B and C based on P). It is considered that the prices of C are more competitive than the prices of B, since, despite being more expensive, they offer more product.
Matrix 4 (2x2 between B and C based on R). It is considered that the fact that the owner of Company B has worked for company A represents a higher risk than that the owner of company C is a relative of A, since B's owner knows the internal processes of A.
Matrix 5 (2x2 between B and C based on E). It is considered that Company B is more important than C, because it has two communication channels.
Once the AHP tool supported the identification of the strongest competitor, a decision tree was developed to find the best strategy to be taken by Company A considering the two available alternatives (see Table 4): to increase or not to increase operations and, in the case of increasing operations, if this is achievable by increasing the production rate or by introducing a new product. The following assumptions were considered for each of these decisions through a planning horizon of three years:
By increasing the production rate, the expected sales are $418,250.00.
In the case of introducing a new product, the expected sales are $511,583.33.
Pr(M-) is defined as the probability of a decrease in sales due to the low demand caused by COVID-19 and the competition represented by companies B and C. This is estimated as 70%, so the complementary probability Pr(M+) is computed as 30%.
Pr(O+|M+) is defined as the conditional probability of increasing operations as demand increases, and it is estimated as 85%. Thus, the complementary probability Pr(O+|M-), which is associated with increasing operations due to low demand, is computed as 15%.
Subsequently, a Bayesian Game was designed and played to define the best strategy that Company A can take regarding the competitive aggressiveness of Companies B and C (increase its production line X or introduce a new product Y). Here, the players were identified as: Player 1 (Company A with a prudent nature), Player 2 (Company B with an aggressive and cautious nature) and Player 3 (Company C with an aggressive and cautious nature).
For each of the matrixes used to define the possible actions based on these competitive profiles, approximate percentages of the minimum profit expected by the companies were set for the following three years, considering also the required investments. Subsequently, the possible responses of Players 2 and 3 were analyzed with their corresponding profiles, when performing each of the two possible strategies for Player 1.
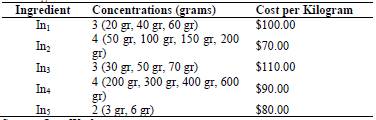
Finally, to support the second alternative considering the current limitations, a factorial analysis was performed to determine the ingredients of the new product which may have the greatest impact on the quality perceived by customers. For this purpose, the Minitab ® software was used to analyze 1440 test samples considering five main ingredients (In1, In2, In3, In4 and In5) with their different concentrations (see Table 6). This is also important to determine a competitive price to introduce the new product to the market.
4. Experiments and results
Fig. 1 presents the AHP model with the scores that integrate the different paired comparisons between the four criteria and alternatives throughout each criterion. As presented, Company B is the strongest competitor.
Subsequently the best strategy was determined through the decision tree. As presented in Fig. 2, due to the high expected profits, it is recommended to expand operations by including a new product, considering the purchase of machinery to minimize production times.
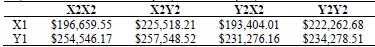
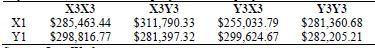
Tables 7 and 8 present the results of the Bayesian Game, which indicate that the most convenient strategy for Company A consists of the introduction of the new product, regardless of the strategies that its competitors may take. Note that X1 and Y1 represent the strategy of increasing the production line of an already available product, and the production of a new product respectively, associated with Player 1 (A). As consequence of any of these actions taken by A, Player 2 (B) and Player 3 (C) may take similar actions based on their competitive aggressiveness. Note that each of the competitors may take one of two profiles: aggressive or cautious. Thus, X2X2 equates the response of Player 2 (increasing production of an available product) with aggressive and cautious profiles as a consequence of the actions of Player 1. In contrast, Y2X2 equates introducing a new product with an aggressive profile and increasing production of an available product with a cautious profile by Player 2.
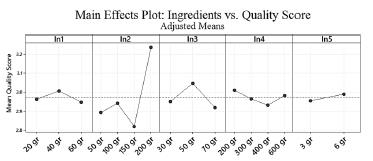
To optimize the production of the new product, a factorial DOE was performed to analyze 1440 samples regarding different combinations of ingredients and the perceived quality (composed metric which includes taste, texture and shelf cycle) of the new product. As presented in Fig. 3, graphically and quantitatively, the two ingredients that provide the highest quality are: ingredient In2 with a concentration of 200 gr, and ingredient In3 with 50 gr. On the other hand, the rest of the ingredients contribute similarly to the results (ingredient In1 with 40 gr, Ini4 with 200 gr, and In5 with 6 gr). Since the results are similar for ingredients In1, In4 and In5, they are not considered as significant for a better evaluation by customers. However, when evaluating the interaction graphs between ingredients (see Fig. 4), the highest ratings are obtained by combining: In2 (200gr) with In4 (600gr); In2 (200gr) with In3 (50gr); and In2 (200gr) with In (6gr).
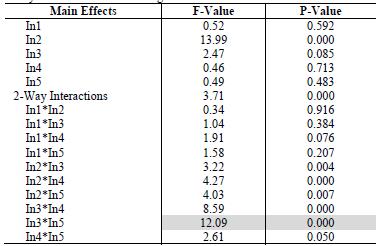
By performing the analysis of variance (ANOVA), the specific results for each main effect and interaction were obtained. As presented in Table 9, the interaction In3-In5 has the most significant impact on the response variable.
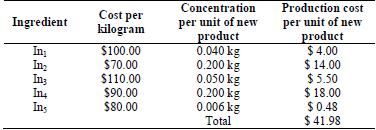
From these results, the production costs per unit of the new product were estimated. This was performed considering two scenarios:
a) With all ingredients (In1 to In5).
b) With the most significant ingredients and concentrations as identified by the DOE approach (i.e., just considering In3 and In5).
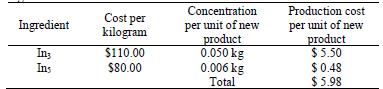
Table 10 presents the production costs for scenario a) while Table 11 presents the costs for scenario b).
Finally, the sale price of the new product was estimated. For this purpose, four cost elements were considered:
Raw materials: as presented in Table 11, the ingredients In3 and In5 represent a total cost of $5.98.
Manufacturing costs: the main processes involve the following costs: $3.00 for blending, $5.50 for baking, $2.25 for cutting, $2.00 for cooling, and $1.50 for packaging. This leads to a total cost of $14.25.
Required investment for the new production line (share cost): the total investment to purchase the required machinery for the new product is estimated as $180,000. This is amortized by the total production volume over three years, which is the desired time frame to recover the investment. As the current annual production volume is 8,050 units, plus the production of the new product of 2,500 units, a total of 10,550x3 = 31,650 units through the three-year period is needed to compensate the investment. This is equivalent to an allocated cost of $5.69 per unit of product. Note that a lower price can be set after this three-year period.
Profit: a profit of 30% is set for both material and production costs. This represents $1.79 and $4.28 respectively for a total profit of $6.07 per unit of product.
As a result, the total sale price for the new product is set as $32.00. Figure 5 presents a review of the calculations performed to define this value.
5. Conclusions and future work
For any process of decision making, companies need to perform a comprehensive analysis of the market. This must consider, among other things, the presence of similar products, competing companies, and potential customers. Also, it must be conducted with different techniques. In this work, we proposed AHP, game theory (Bayesian Game), decision tree and factorial DOE to address the different competitive aspects for a company (A) within the food supplements market.
For this case, it was determined that the strongest competitor for Company A is Company B due to its lower prices and identity/brand. An interesting fact regarding the importance of brands during the COVID-19 pandemic is that they have added value within the new consumer environment. This is because consumers frequently use mental shortcuts to guide judgments and decisions. If the consumer identifies a brand (a mental shortcut), they can develop a preference over other products, even under difficult market scenarios [20]. In this regard, Company B has a clear advantage over Company C Furthermore, the fact that the owner of Company B has worked at Company A gave it advantages regarding key operations.
It was established that the best strategy for Company A is to introduce a new product with the necessary machinery for production, because this can provide a greater profit, regardless of the actions taken by the competitors (B, C) and within the current COVID-19 situation, which has decreased demand for the established products.
This was supported by the AHP technique, where four criteria (identity, relation, price and communication channels) were considered to evaluate the competitive profile of each competitor and to identify the strongest one (B).
As for which strategy Company A should take, evaluations were performed with two methods: decision tree and game theory. This is caused by the high risk of the market and the required economic investment. In both methods, the results proved that introducing a new product to the market, together with the purchase of new machinery, can be most beneficial for Company A.
In addition, through a factorial DOE, the cost of the raw material and the necessary concentrations for a production of 2500 units with the minimum costs were determined.
If no selection of the most important ingredients (those more relevant to the quality metric which includes taste, texture and shelf cycle) is performed, the 2500 units would require an investment of $104,950 for raw material. If selection is based on the results of the factorial DOE (which identified ingredients In3 and In5 as the most relevant for the quality metric), the total investment for raw material is reduced to $14,950.
Finally, considering production costs, the investment in additional machinery and required profit, a recommended sale price of $32.00 was proposed. This is very competitive when compared to the prices of Companies B and C. Also, within Company A, the new product is the second cheapest product in its catalog. Thus, the present work can provide a guideline for other companies or family enterprises to improve their competitiveness.
Future work is focused on the integration of computer simulation to validate the application of these tools in the presence of other sources of uncertainty or variables. This is because not all variables or sources of uncertainty within a system can be modelled through mathematical techniques. In such a case, simulation provides a valuable tool to support multi-criteria decision making with dynamic variables [21-22]. In addition, simulation supports the assessment of "what if scenarios which can provide important feedback on the expected results obtained through game theory approaches.

