


 Inglés (pdf)
 Articulo en XML
 Referencias del artículo
 Enviar articulo por email
 Citado por SciELO
  Citado por Google
  Similares en
SciELO
Similares en
SciELO  Similares en Google
 Permalink
1. Introduction
Electronic medical data are ubiquitous and available in large quantities with high accuracy due to the increasing availability of such data from a variety of sources, including clinical institutions, individual patients, insurance companies, pharmaceutical industries, and others, highlighting great opportunities for understanding risk factors, and disease spread, continuous health monitoring, among others; enabling targeted prevention approaches [1]. Advances in computer science - especially in machine learning with new and improved methods for data collection and storage - have shown increasing interest related to healthcare data analysis [2,3].
The emergence and spread of the SARS-Cov2 coronavirus, which produces the disease called COVID-19 [4,5] has become a particular challenge for healthcare professionals and the general population [6]. The disease placed a great burden on healthcare systems, and total confinements generated losses, as many of the people were not infected, but the follow-up of positive cases becomes a complex task [7].
Many studies have focused on identifying infected individuals to isolate them and allow non-infected individuals to work regularly. The use of clinical symptoms is essential to optimize the identification of infected individuals.
In this sense, researchers have developed predictive models that combine several features such as clinical symptoms, laboratory tests, among others. Also, models to detect possible contagion and estimate the risk of infection, and classify the population to help medical personnel and countries' economies [8,9]. References [8,10] predict a SARS-CoV-2 infection by asking 8 basic questions of which 5 refer to symptomatology (fever, cough, sore throat, shortness of breath, and headache) obtaining an accuracy of 90%. Chen et al. explored the distributions of comorbidities and symptoms, in addition to laboratory test results, to correlate between non-severe and severe types of COVID-19, they were able to identify key features between both clinical types using Machine Learning, as an accurate diagnostic decision support tool [11]. Ahamad et al. developed a model using supervised machine learning algorithms to identify features that predict the diagnosis of COVID-19. Using an algorithm called XGBoost, they obtained an accuracy of over 85% in predicting and selecting features that correctly indicate COVID-19 status, indicating that the most frequent and significant predictive symptoms are fever (41.1%), cough (30.3%), lung infection (13.1%) and nasal discharge (8.43%) [12]. Using a dataset with similar features, other models predicting COVID-19 disease with an area under the curve of 0.90 auROC have been reported using a gradient boosting machine built with decision tree base learners as algorithm [8]. Another approach is reported by Khanday et al. where they perform experiments with various algorithms such as random forest, stochastic gradient boosting, decision trees, to classify into four classes, COVID, SARS, ARDS and both (COVID, ARDS), 212 labeled clinical reports, obtaining that logistic regression and Naıve Bayesian multinomial classifier give excellent results by having an accuracy of 94% and 96.2% [13].
Clinically, COVID-19 disease is complex and manifests itself through a limited number of symptoms such as fever, cough, intense headache, among others [8,11]. If these parameters are analyzed with systems based on machine learning algorithms, it is possible to fight this virus and other future viruses by continuously monitoring individuals to improve detection, isolation, and provide disease control recommendations [14].
The study presents the use of machine learning algorithms for COVID-19 detection using the symptoms and physical conditions of 5,434 people with and without the disease. A Keras-Tensor Flow Neural Network was used. The results of four loss functions, based on the performance indicators, F1 score, and area under the curve, were compared to learn the behavior of the neural network as a basis for integrate them into systems that allow preliminary detection of the disease.
The highest F1 classification score using 11 features was 0.98 with an area under the curve of 0.99 aucROC, using the results of the SHAP values, the less relevant features considered by the model were eliminated, obtaining a feature simplification of 63%, varying the performance by 2 to 3% depending on the metric referred, demonstrating the usefulness of knowing the importance of the features within a classification model, for its simplification without affecting the performance.
2. Materials and methods
2.1. Study data
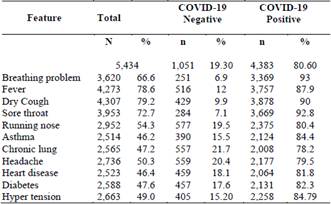
The dataset used contains the records of 5,434 people, obtained from the Kaggle platform for experimenting with machine learning models. From these data, a model is developed that predicts COVID-19 scores using five binary features: asthma, chronic lung, heart disease, diabetes, and hyper tension; and six initial clinical symptoms: Breathing problem, fever, dry cough, sore throat, runny nose, and headache.
The training-validation set consisted of records from 1,051 individuals without the disease and 4,383 individuals with the disease. The following table describes each of the features of the dataset used by the model where the greatest number of individuals present dry cough and fever, respectively (Table 1).
After an exploratory analysis, no null data or empty cells were found. The figures show the number of positive and negative cases for each characteristic for each class. Fig. 1(a) shows a large number of people presenting cough, fever, sore throat and breathing problem for the COVID-19 positive class, the other features show a balance between presence and non-presence.
On the other hand, the negative COVID-19 class only shows a considerable imbalance in people with breathing problem and sore throat (Fig. 1(b)).
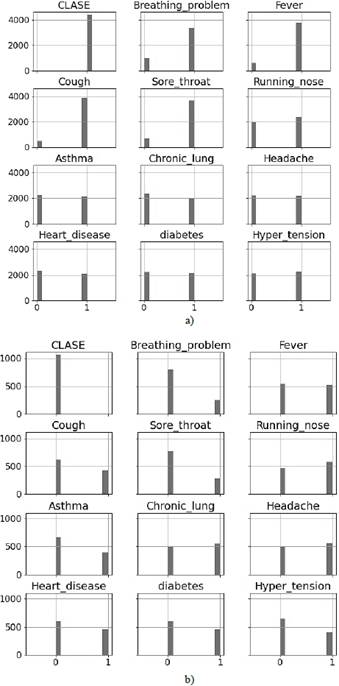
Source: The Authors
Figure 1 Features distribution grouped by class. a) COVID-19 positive. b) COVID-19 negative.
Considering this is an experimental stage of algorithms testing, the UNISANGIL ethics committee determined that the public health dataset used in this study does not require approval for analysis. The development of systems for constant monitoring of physiological parameters supports public health efforts for the monitoring and control of communicable and no communicable diseases.
2.2. Experiment setup and design
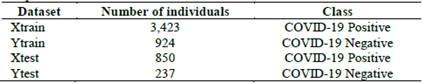
Dataset was classified into two groups: COVID-19 positive and COVID-19 negative. This gives a typical binary classification to know whether people were infected or not. To evaluate the performance of the approach used, the training and test data set were divided into 80% and 20%, respectively. (Table 2).
The process of experimentation with the algorithms was based on Keras Python 3.6 under a win10 operating system. The hardware used for the experiments had an i5-7300HQ CPU, 8G RAM and NVIDIA GeForce GTX 1050 GPU.
The Keras Dense class was used, as a building block of a fully connected layered model, with different loss function described as below:
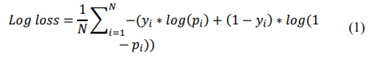
Binary Cross Entropy also known as log loss, is a loss function used in binary classification tasks, which shows the negative mean of the logarithm of the predicted probabilities of each class, penalizing the probabilities as a function of the distance to the expected value, using the given mathematical formulation [15] (1).
Poisson Loss from the combination of loss frequency and loss severity estimates the loss distribution [16], taking the form of (2).
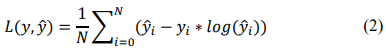
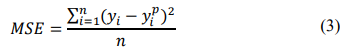
Mean Squared Error is the sum of the squared distances between the true values and the predicted values, greatly penalizing outliers. Due to its sensitivity, regardless of the sign, the values are always positive and 0.0 is the perfect value of the differences [17]. Mathematically it can be expressed as (3).
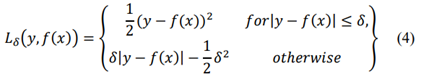
Huber Loss presents a lower sensitivity to outliers, considering that when the error is large the absolute error is obtained, which becomes quadratic as the error decreases [18]. Combine the mean square error and the mean absolute error. Its mathematical formulation (4).
The tensor flow was used as the backend with 11 input neurons, a variable number of hidden layers, and one neuron in the output layer. The dataset used had 11 input features and a binary output.
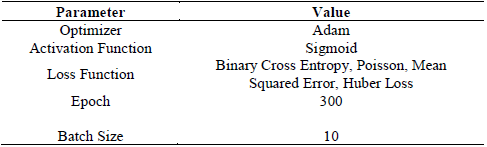
A sequential model with fully connected layers is used, where the dimensions were defined according to the number of inputs, the output, and the variation of the hidden layer, aiming for a small and efficient model. The activation function used was sigmoid. In addition, a comparison with different loss functions was performed. The optimizer used throughout the experimental phase was Adam and the metric used to judge the performance of the neural network was F1 score and auROC parameter from ROC curves. Moreover, considering that the data set is very large, the batch size is used. The characteristics are summarized in Table 3 below.
3. Results
The model trained with data from 5,434 individuals, 19.30% negative and 80.63% positive for COVID-19 disease. It was validated with a 5-fold cross-validation to ensure that the results are independent of the partition between training and test data (Tables 4-6).
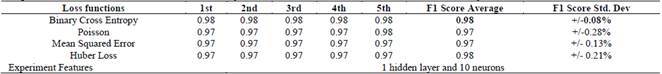
Table 4 Comparative results of the loss functions used in the study with a 5-fold cross-validation, in a model with a hidden layer of 10 neurons
Source: The Authors
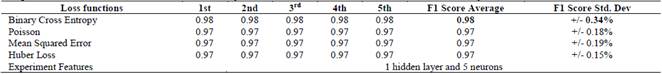
Table 5 Comparative results of the loss functions used in the study with a 5-fold cross-validation, in a model with a hidden layer of 5 neurons
Source: The Authors
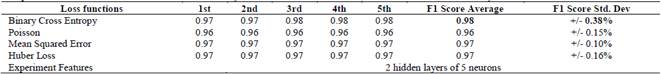
Table 6 Comparative results of the loss functions used in the study with a 5-fold cross-validation, in a model with two hidden layers of 5 neurons each
Source: The Authors
The F1-Score of the model with a hidden layer and 10 neurons show a similar behavior with the four loss functions with a mean of 0.97 and standard deviation of +/-0.005.
However, the best model was obtained using the Binary Cross Entropy error function achieving a result of 0.98.
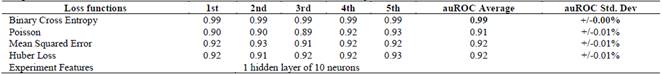
The model was scored on the test set using auROC across different thresholds, including false-positive rate, false-negative rate, and overall accuracy. As seen in Tables 7 to 9, the best performance was obtained using the Binary Cross-Entropy loss function with a single hidden layer configuration with 10 neurons.
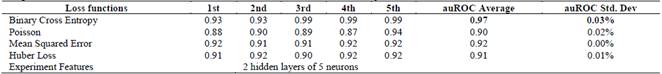
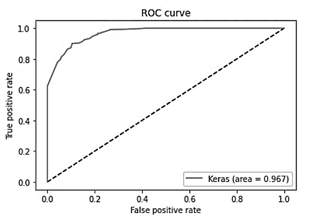
Although the behavior of the models was similar considering the F1-Score, the aucROC shows differences of 7 percentage points as shown in Tables 7 to 9. The best result obtained, considering this metric, was the one using the Binary Cross Entropy error function with a value of 0.99, regardless of the number of layers and neurons (Fig. 2).
Table 7 Comparative results of the auROC of 5-fold cross-validation, in a model with a hidden layer of 10 neurons
Source: The Authors
The metrics of all the ROC curves in this study were calculated using the sklearn.metrics module.
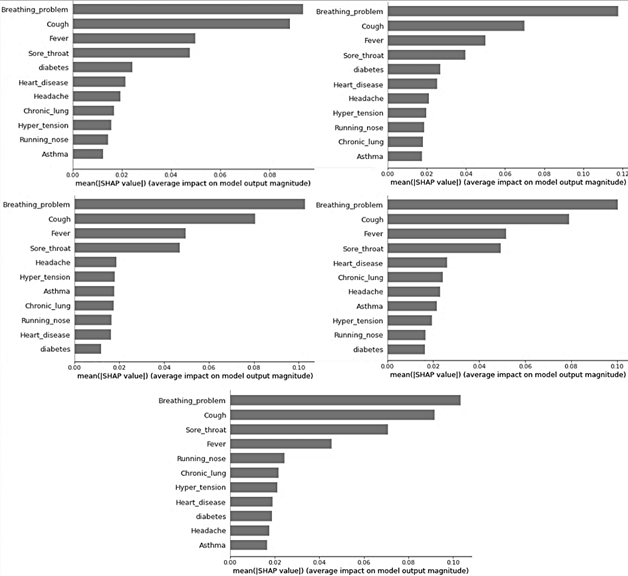
The SHapley Additive exPlanations (SHAP) method introduced by Lundberg and Lee [19], whose origins are in game theory, is used to learn the relevant model features. Since it estimates the differences between models with subsets of the feature space, it allows interpreting the predictions of machine learning models using SHAP values, which estimate the contribution of each feature in the model prediction. The SHAP method for interpreting a model uses additive features attribution, where additive features refer to input variables. Thus, it represents the classification result as the sum of the contribution of each feature, as (5).
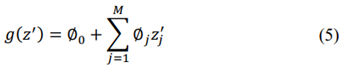
Where g is the explanation model, z′ is the simplified features vector, M is the maximum simplified features size and ϕj ∈ R is the feature attribution for a feature j [20,21].
Thus, it is obtained that the most important features considered by the model are those summarized in the SHAP graph in Fig. 3. The presence of breathing problem, cough, fever, and sore throat were key predictors of the disease presence. The features that showed a low impact in almost all cases were runny nose, Asthma, diabetes, chronic lung disease, hypertension, and headache.
Table 8 Comparative results of the auROC of 5-fold cross-validation, in a model with a hidden layer of 5 neurons
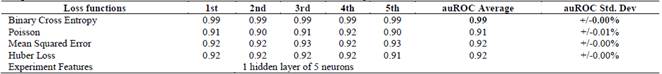
Source: The Authors
Table 9 Comparative results of the auROC of 5-fold cross-validation, in a model with two hidden layers of 5 neurons each
Source: The Authors
Source: The Authors
Figure 2 ROC curves showing the performance of the model using the binary cross-entropy loss function, on the test sets in the 5-fold cross-validation.
Source: The Authors
Figure 3 SHapley Additive exPlanations (SHAP) graph showing the important features considered by the ANN model to predict the diagnosis of COVID-19, in the 5-fold cross-validation.
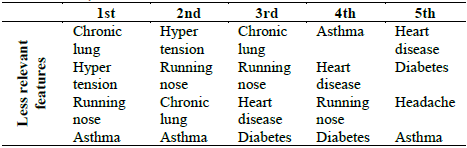
Table 10 Less relevant features considered by the ANN model to predict the diagnosis of COVID-19, in the 5-fold cross-validation
Source: The Authors
Considering the results of the SHAP values in the 5-fold cross-validation, the least relevant features in each fold are shown in Table 10. The least relevant features were running nose and asthma, which in 4 of the 5 folds were common.
The model is recalculated using the features of the best configuration, but the number of input neurons is modified, leaving those corresponding to running nose and asthma. As a result, by removing the least relevant features, an F1-Score of 0.97+-0.12 and an aucROC of 0.98 are obtained, with variations of 1%. This is a negligible variation considering the elimination of features from the model.
Finally, the model is obtained again by eliminating the following 3 less relevant features (Diabetes, Chronic Lung and Hypertension), having a total of 6 inputs. The F1-Score result was 0.96 +/-0.34% and the aucROC was 0.96, obtaining a difference of 2 and 3% for each performance index.
Source: The Authors
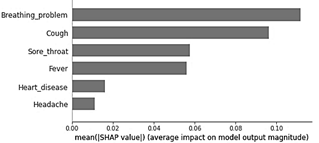
Figure 5 SHapley Additive exPlanations (SHAP) graph showing the important features considered by the new ANN model with less features
Regarding the F1 score obtained in Tables 4 to 6, a decrease of approximately 1% is obtained, but considering the ROC curve, the result obtained with the new model that considers fewer features is still better by approximately 5%, as shown in Tables VII to IX. Fig. 4 shows the ROC curve of the model using fewer features. On the other hand, Fig. 5 shows the SHAP values of the new model, noting that the first two most important features taken by the model do not change in their order or magnitude, although in general the importance of the features was maintained even when some were removed from the initial model.
4. Discussion
Health monitoring using artificial intelligence techniques is a very active field. Currently, specifically in the disease-causing current pandemic situation, a wide range of approaches have been used for monitoring and evaluation of patients with COVID-19. Promising solutions have been proposed in screening using clinical symptoms as a preliminary step. The study shows the use of preliminary symptomatology and clinical condition of the patient to detect possible COVID-19 using a machine learning algorithm and information from 5,434 people with and without the disease.
It is shown that feature reduction using techniques such as SHAP values can produce simpler models that use only relevant feature sets to solve a problem. In the case presented, comparison of the model with 11 features, with an F1 score of 0.98 +/-0.08% and an aucROC of 0.99, versus the model with 6 features, with an F1 score of 0.96 +/-0.34% and an aucROC of 0.96, yields a difference of 2 and 3% for each performance index. Obtaining a very small performance variance with a feature reduction of 63%.
The authors, based on the source of the data, consider that the study is not free of errors and biases, since the clinical condition understood as asthma, chronic lung disease, heart disease, diabetes and hypotension; and six initial clinical symptoms: Respiratory problem, fever, dry cough, sore throat, runny nose and headache of the 5,434 people were taken from public data from the Kaggle platform for experimentation with machine learning models. But it is useful as a basis to evaluate the performance of the machine learning model using different configuration parameters and to learn about the most relevant features considered by the model, showing a path for future studies using proprietary databases acquired for research purposes.
5. Conclusion and future research
In this study, we used data from public sources, as an experimental stage. We evaluate different loss functions and configuration parameters of an ANN, to obtain an optimal model that can detect the disease and know which are the most relevant features influencing the detection.
From the data used, a model has been developed to predict the diagnosis of COVID-19 with an F1 score of 0.98 and 0.99 aucROC, using eleven basic features. As a final model using the SHAP values a model using only 6 features is obtained achieving an F1 score performance of 0.96 and 0.96 aucROC, observing a very small percentage difference and retaining the relevant features for the model.
The model is intended to benefit the response of health systems to this disease and other respiratory viruses, although the need for more robust data to complement the study and avoid possible biases is emphasized, before algorithm is employed.

