


 English (pdf)
 Article in xml format
 Article references
 Send this article by e-mail
 Cited by SciELO
  Cited by Google
  Similars in
SciELO
Similars in
SciELO  Similars in Google
 Permalink
INTRODUCTION
Ultrasonic technology has a wide range of applications in the fields of biology [1-3], pharmacy [4], polymer [5, 6], civil engineering [7], nuclear power generation [8], sonochemistry [9], medical [10], material science [11], agriculture [12], navigation system [13] etc. Due to its non- destructive nature [14], it is also used in various industries such as plastic [15], cement [16], soap [17], paper [18], petrochemicals [19], glass [20], food [21], dairy [22] etc. Further, ultrasonic and related thermodynamic parameters of solid substances provide useful information related to structure of molecules, molecular packing and inter and intra molecular interactions [23]. In liquid mixtures [24, 25] and solutions [26], these parameters help to interpret type of molecular interactions [27].
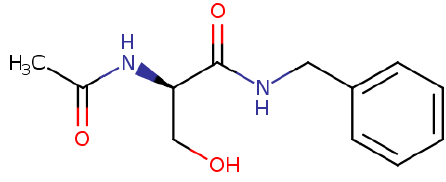
Lacosamide is an amino acid derivative; N-methyl-D-aspartic acid and is non-hygroscopic white to yellow crystalline compound of molecular weight 250.294 g.mol-1 and of molecular formula C13H18N2O3. It is R-enantiomer of IUPAC name (R)-2-acet-amido-N-benzyl-3-methoxy propionamide [28].
The preclinical and clinical result of the drug has demonstrated an excellent anticonvulsant activity [29-32] and is used for the treatment of both epilepsy and diabetic neuropathic pain [33]. Further, drug was found to be more potent than sodium channel blocking drug phonation and barbiturate phenobarbital [34] and is used in combination with other agents as therapy of partial onset seizures.
Ultrasonic study of drugs in various solvents are provide valuable information related to interactions of drug with the solvent which is useful to prepare appropriate concentrated dose for tablets, injection and oral dose in appropriate solvents [35-37]. The ultrasonic data and related thermoacoustic parameters are also useful to study the pharmacodynamic and pharmacokinetics of drugs [38].
In the present study, various acoustical properties of lacosamide in various alcohols have been studied at 298.15 K over a wide range of concentrations by measuring ultrasound velocity, density and viscosity. The results are interpreted to understand the interactions of lacosamide in alcohols. The evaluated data may be useful for further research and development of drug lacosamide.
EXPERIMENTAL
The solvents selected for the study were alcohols such as methanol, ethanol, 1-propanol, 1-butanol and1-pentanol.The drug lacosamide was recrystallized before use. Figure 1 shows the structure of lacosamide.
The solutions of lacosamide of various concentrations were prepared in all selected alcohols by using weight balance (Mettler Toledo AB204-S, Switzerland).
Measurements of ultrasonic velocity and density
The Ultrasonic velocity and density of all the pure alcohols and solutions were measured at 298.15 K using Anton Paar density and sound velocity meter (Model DSA 5000M). The accuracy of ultrasound velocity and density are ±0.5 m.sec-1 and ±0.005 kg.m"3 respectively.
Measurements of viscosity
The Ubbelohde viscometer with 25 ml capacity was used for the viscosity measurement. In the viscometer, milli Q-water/pure solvent/solution were filled, and flow time of liquid was measured at 298.15 K. The digital stopwatch (Model: RACER HS-10W), with an accuracy of+0.01 second was used to determine flow time of solutions. The temperature stability was maintained by circulating water from a thermostat (NOVA NV-8550 E, accuracy of ± 0.1 K around the viscometer. The accuracy of viscosity is ± 0.05 %. Using the flow time of water and solution/ pure solvent and viscosity of standard water sample, viscosity of solvent/ solution was determined according to equation:
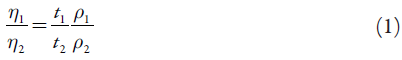
where η 1 and η 1 are viscosities of water and solution/pure solvent, respectively. t 1 and t 2 are the flow time for water and sample solution/pure solvent whereas ρ 1 and ρ 2 are density of water and solution/pure solvent, respectively.
RESULTS AND DISCUSSION
The experimental data of density, viscosity and sound velocity of pure solvents are given in table 1 along with theoretical values taken from literature.
Table 1 Experimental values of density, sound velocity and viscosity of pure solvents at 298.15 K*.
| Liquid | Density (kg-m 3) | Viscosity (mPa-s) | Ultrasonic velocity (m-s ') |
|---|---|---|---|
| Methanol | 787.37 (787.20)a | 0.549 (0.545)a | 1104.90 (1104.00)a |
| Ethanol | 805.94 (790.00)b | 1.124 (1.105)c | 1204.92 (1207.00)b |
| 1-Propanol | 800.22 (800.80)d | 1.946 (1.943)d | 1206.13 (1205.80)e |
| 1-Butanol | 807.88 (806.60)f | 2.581 (2.585)g | 1243.92 (1240.60)f |
| 1-Pentanol | 811.67 (811.00)h | 3.348 (3.412)i | 1275.32 (1275.33)h |
*The values in parenthesis are from literature (a: [39], b: [40], c: [41], d: [42], e: [43], f: [44], g: [45], h: [46], i: [47]).
Table 2 shows the experimental data of density, viscosity and sound velocity of all the solutions in different solvents. It is clear from table 2 that ultrasonic velocity increases with increase in concentration in all selected alcohols. Further, it is minimum for methanol and maximum for 1-pentanol.
Table 2 Experimental values of density, viscosity, and ultrasound velocity of lacosamide in different alcohols at 298.15 K.
The graphical presentation of concentration dependence of ultrasonic velocity in different alcohols is shown in figure 2. It is clear from figure 2 that there is linear increase of ultrasonic velocity with concentration in all the alcohols. The order of ultrasound velocity in alcohols is: methanol > ethanol > 1-propanol > 1-butanol > 1-pentanol. However, there is overlapping in velocity values for ethanol and 1-Propanol. This may be due to the fact that the ethanol in the present study used was only 99% pure. So, the presence of impurity affects the velocity. Overall, ultrasound velocity increases with increase in CH2 group of alcohols.
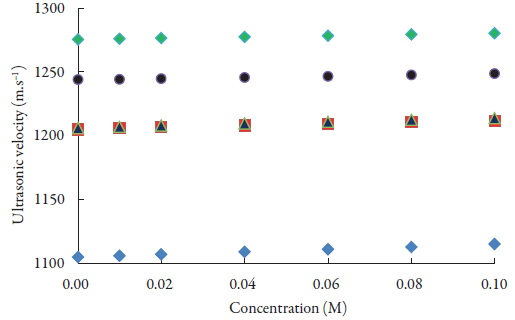
Figure 2 The variations of sound velocity of lacosamide with concentrations in alcohols at 298.15 K. ♦: Methanol; ■: Ethanol;▲:1-Propanol; ●:1-Butanol; A:1-Pentanol.
From the experimental data of density (ρ), viscosity (η) and sound velocity ( U ), following acoustical parameters were calculated.
Speciic acoustical impedance (Z) [48]:

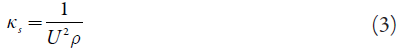
Adiabatic compressibility (k s ) [49]:
Intermolecular free path length (L f ):
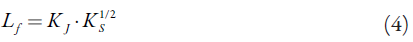
where K J is the Jacobson constant (= 2.0965 x 10⁻⁶) at 298.15 K.
Rao's molar sound function (R m ) [50]:
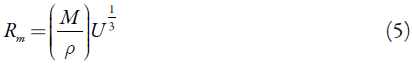
where M is the molar mass of solution and can be calculated by following equation: M = M 1 W 1 + M 2 W2.
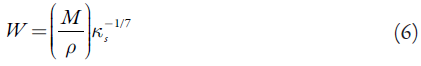
Molar compressibility (W):
Van der Waals constant (b):
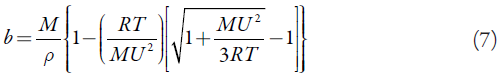
where R is the gas constant (8.3143 J.K-1.mol-1) and T is absolute temperature.
Solvation number (S n):
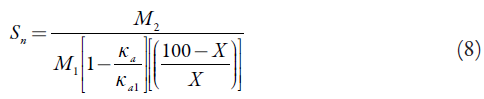
where X is the number of grams of solute in 100 g of the solution. M1 and M2 are the molar masses and K al and K a are adiabatic compressibility of solvent and solution respectively.
Thermal conductivity (K bm ) [51]:
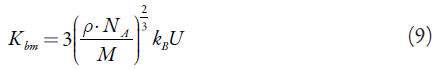
where N A is the Avogadro's number (6.0221 x 10²³), k B is the Boltzmann constant ( k B = 1.38064852 x 10⁻²³ m2.kg-2.K-1) and M is the molar mass of solution.
Relaxation strength (r):
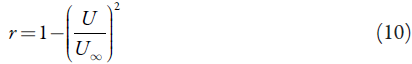
where U ∞ = 1.6 x 10³ m.s-1
Some of these evaluated acoustical parameters are reported in table 3. The variation of specific acoustical impedance with concentration is shown in figure 3. The specific acoustical impedance is the measurement of opposition in acoustical flow by acoustic pressure in the solution [52]. It is observed from figure 2 that specific acoustical impedance (Z) increases with increase of concentration. Further, as CH2 group increases in alcohols, Z increases i.e., it is maximum in 1-pentanol and minimum in methanol. The increase in specific acoustical impedance indicates the existence of solvent-solute interactions in solutions.
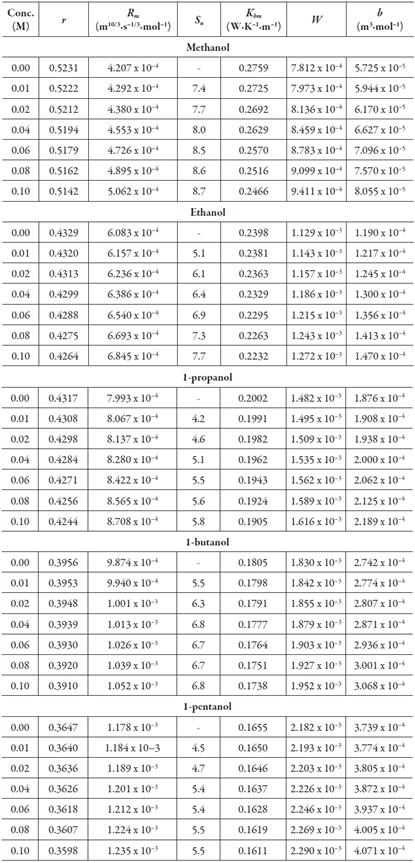
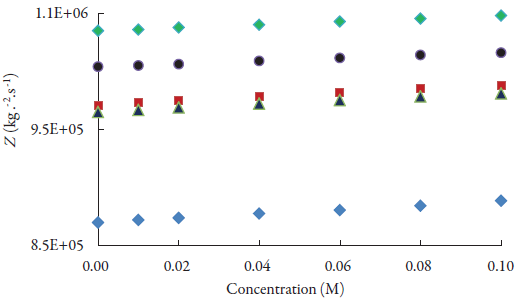
Figure 3 The variations of specific acoustical impedance of lacosamide with concentrations in alcohols at 298.15 K. ♦: Methanol; ■: Ethanol; ▲ :1-Propanol; ●:1-Butanol; ♦:1-Pentanol.
The variation of adiabatic compressibility (k s ) and intermolecular free path length (L f ) with concentration are given in figures 4 and 5 respectively. Both these parameters are observed to decrease with concentration. Further, as number of CH2 group increases, these parameters decrease. The decrease of intermolecular free path length suggests that distance between solute i.e., lacosamide and solvent molecules decreases with concentration. So, when distance decreases, velocity increases (figure 2).
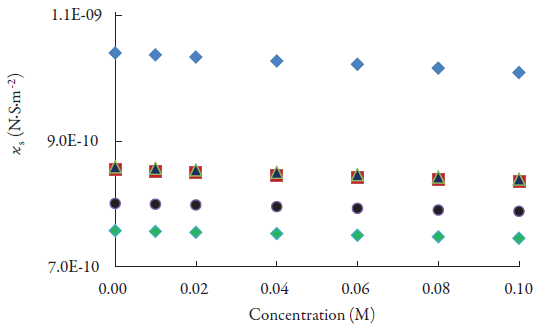
Figure 4 The variations of adiabatic compressibility of lacosamide with concentrations in alcohols at 298.15 K. ♦: Methanol; ▀: Ethanol; ▲ :1-Propanol; ●:1-Butanol; ♦:1-Pentanol.
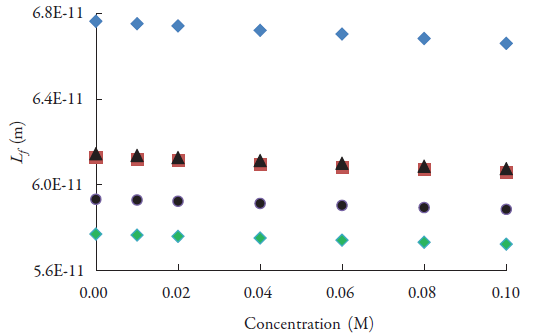
Figure 5 The variations of intermolecular free path length of lacosamide with concentrations in alcohols at 298.15 K. ♦: Methanol; ▀: Ethanol; ▲:1-Propanol; ●:1-Butanol; ♦:1-Pentanol.
The compressibility of the solution is mainly due to free solvent molecules around solute i.e., drug molecules. So, when there is strong interaction between solvent and lacosamide molecules, compressibility decreases which is the case in present study. By increase in concentration of lacosamide, molecular associations are enhanced and newly formed aggregates cause adiabatic compressibility to decrease.
Table 3 shows the decrease in relaxation strength (r) also with concentration which also suggests the predominance of solvent-solute interactions in studied solutions.
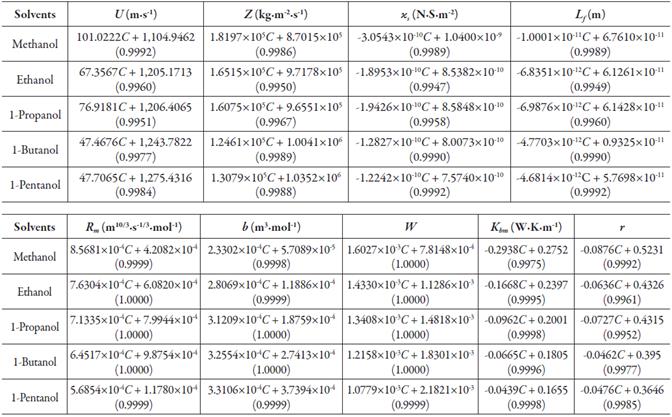
It is also observed from table 3 that Rao's molar sound function (R m ), molar compressibility (W) and van der Waals constant (b) increase with increases in concentration. The variation of Rao's molar function (R m ) with concentrations is also shown in figure 6 for all the studied alcohols and is found to increase linearly. The least square equation and correlation coefficient (γ) values for some of the evaluated parameters are given in table 4. It is observed that for Rao's molar sound function, van der Waals constant and molar compressibility, correlation coefficient is almost unity. This indicates that although there are interactions between drug molecules with alcohol molecules, there is no complex formation.
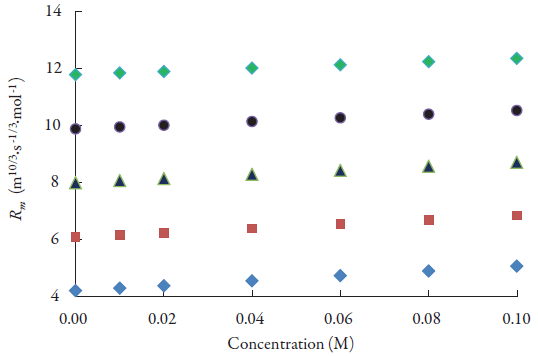
Figure 6 The variation of Rao's molar sound function of lacosamide with concentrations in alcohols at 298.15 K. ♦: Methanol; ▀: Ethanol; ▲ :1-Propanol; ●:1-Butanol; ♦:1-Pentanol.
Table 4 The least square equation and correlation coefficient γ (in parenthesis) for some evaluated parameters of lacosamide in different alcohols at 298.15 K.
The type of interactions of lacosamide drug with alcohols is further confirmed by another parameter known as solvation number (S n). This gives information regarding structure forming or structure breaking capacity of a solute in different solvents. The solvation number can be positive or negative. For the studied alcohols, solvation number of lacosamide is plotted against concentrations as shown in figure 7. It is observed from figure 7 and table 3 that the solvation number is positive for all the alcohols.
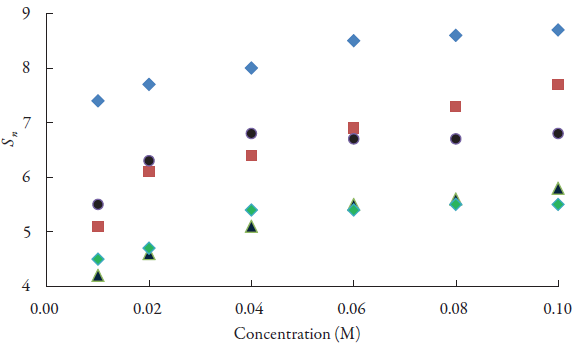
Figure 7 The variations of solvation number of lacosamide with concentrations in alcohols at 298.15 K. ♦: Methanol; ▀ Ethanol; ▲:1-Propanol; ●:1-Butanol; ♦d-Pentanol.
For all the alcohols, it increases with increase in concentration. However, in some cases, it becomes almost constant at higher concentrations. The positive solvation number indicates structure forming tendency of lacosamide in alcohols. This again proves strong molecular interactions between lacosamide and alcohol molecules.
The thermal conductivity of solution is also found to decrease linearly with concentration as given in table 3. The variation in thermal conductivity with concentration is attributed to various factors such as Brownian motion, clustering etc. [51]. The decrease of thermal conductivity with concentration is similar to decrease of intermolecular free path length. As solute-solvent interaction increases with concentration, thermal conductivity is found to decrease which may be due to decrease in Brownian motion. In different alcohols, order of thermal conductivity is: methanol > ethanol > 1-propanol > 1-butanol > 1-pentanol i.e., it decreases with increase of CH2 groups of alcohol.
The predominance of solute- solvent interactions in studied alcohols is further proved by the increases in viscosity with concentration which is shown in table 2. The experimental viscosity data have also been analyzed using the Jones-Dole equation [53]:
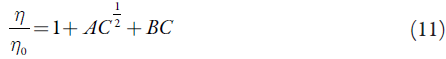
Where η and η 0 are the viscosity of solutions and pure solvents, respectively. C is the molar concentration of lacosamide. The parameters A and B are characteristic of solvents and lacosamide. The coefficient A represents the contribution from interionic electrostatic forces and is a measure of solute-solute interactions whereas B is an empirical parameter which gives information related to ion solvent interactions and structure factors [54]. The values of A and B parameters have been evaluated from the intercept and slope of plots of (η/η 0 - 1). C 1/2 vs. C 1/2 and are reported in table 5. It is observed that A values are small and are negative for two alcohols whereas B values are positive and for some alcohols, it is larger as compared to other alcohols. However, no regular trend is observed for both A and B coefficients in selected alcohols. The smaller or negative A values proves that ion-ion interactions i.e. solute-solute interactions are weak in studied solutions whereas positive B coefficient indicates the presence of strong solute-solvent interactions [55] i.e., structure forming tendency of lacosamide [56]. Thus, evaluated acoustical parameters and Jones-Dole coefficients both confirm the structure forming tendency of lacosamide in studied alcohols.
CONCLUSIONS
In the solutions of drug lacosamide in studied alcohols, solute-solvent interactions dominate. These interactions increases from methanol to 1-pentanol i.e., interactions increase with increase in CH2 group of alcohols. Thus, lacosamide exhibited structure forming tendency in studied alcohols due to predominance of solute- solvent interactions.

