


 English (pdf)
 Article in xml format
 Article references
 Send this article by e-mail
 Cited by SciELO
  Cited by Google
  Similars in
SciELO
Similars in
SciELO  Similars in Google
 Permalink
Introduction
Small ruminants play an important role in animal farming in Iran. Genetic improvement of productivity traits in ewe depends on reliable genetic evaluations based on proper parameter values affecting profitability of meat production and improving breeding efficiency (Mohammadi et al., 2015). Efficiency of lamb production is affected by ewe productivity, maternal ability of the ewe, lamb growth potential, and survival traits (Dickerson, 1970). Ewe productivity traits are the most vital factors to determine reproductive efficiency (Mohammadi and Abdollahi-Arpanahi, 2015), and improving ewe productivity traits is more important, economically speaking, than improving growth rate (Wang and Dickerson, 1991). On the other hand, improvements of survival rate are unlikely if litter size is increased through selection without regard to whether the additional lambs born can be successfully reared (Lindsay, 1982). Nevertheless, improvements in survival rate might be achieved by modifying the conditions and suitable preparation for survival.
Arman sheep was synthesised by crossing four sheep breeds (i.e. Baluchi, Ghezel; two Iranian native breeds), Chios, and Suffolk at the Abbasabad breeding station, located in Khorasan Razavi province, North- east of Iran. Increasing litter size, mutton production and tolerance to harsh, and unfavorable environmental conditions were the main objectives for producing this breed. The project started in 1975 and breed fixation was accomplished by selection and inbreeding.
To our knowledge, there are no literature reports on genetic parameters for lamb survival rate and ewe productivity traits for Arman crossbred sheep. Hence, this study was conducted to estimate the (co)variance components and genetic parameters of this breed using the restricted maximum likelihood method with 12 animal models for lamb survival and four animal models for ewe productivity traits. Correlations between traits were also estimated.
Materials and methods
Geographical location and management
The data and pedigree information were collected from the Abbasabad Sheep Breeding Station. This station is located at 33° 34´ N and 58° 23´ E, in the north-east of Iran. Collected data spans from 1999 to 2011. All animals were raised under similar environmental, nutritional, and management conditions. Breeding season extends from late August to early-October. Maiden ewes were exposed to fertile rams at approximately 1.5 years of age under a fully supervised mating strategy. Ewes in estrus were identified by means of teaser rams, at a ratio of 20-25 ewes per ram. The ewes were kept for a maximum of 7 parities and the rams for a maximum of two mating seasons. To avoid inbreeding, rams were rotationally allocated to each group of ewes. Lambs were ear-tagged and weighed at lambing or within 24 h of birth. Ewes and their lambs were placed in separate pens and kept for a few days, after lambing. Lambs were allowed to suckle dams until weaning. The suckling stage lasted for 90 d on average and minimum/maximum ages at weaning were 70/115 d. All lambs were weaned at the same day (i.e. not necessarily at the same age). The flock was kept on pastures during Spring and Summer seasons, and grazed on wheat and barley stubbles during Autumn. During Winter, the lambs were kept indoors and hand-fed. Supplementary feeding (consisting of wheat and barley straw, alfalfa hay, sugar beet pulp, and concentrate) was offered to all animals during Winter and to ewes in late pregnancy.
Studied traits
The traits were lamb survival rate (LSR: Lambs alive from birth to weaning -coded by 0 for dead lamb and 1 for alive lamb at weaning), litter size at birth (LSB: Number of lambs born alive per ewe lambing within a specific year -coded as 1 or 2), litter size at weaning (LSW: Number of lambs weaned per ewe lambing within a specific year coded as 0 for dead lambs and 1 or 2 for alive lambs at weaning), litter mean weight per lambing (LMWL: Average birth weight of lambs per ewe lambing), litter mean weight per lamb weaned (LMWLW: Average weaning weight of lambs per ewe lambing), total litter weight at birth (TLWB: Sum of the birth weights of all lambs born per ewe lambing), and total litter weight at weaning (TLWW: Sum of the weights of all lambs weaned per ewe lambing). Data structure is summarized in Table 1.
Table 1 Summary of descriptive statistics for traits of Arman crossbred sheep.
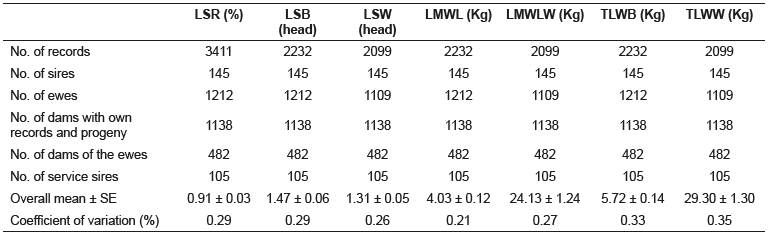
LSR: Lamb survival rate; LSB: Litter size at birth; LSW: Litter size at weaning; LMWL: Litter mean weight per lambing; LMWLW: Litter mean weight per lamb weaned; TLWB: Total litter weight at birth; TLWW: Total litter weight at weaning; SE: Standard error.
Statistical analysis for lamb survival rate
The fitted models accounted for known environmental effects of lamb sex, birth type (single, twin, triplet, and more), lambing year in 12 categories (1999-2011), and ewe age at lambing in 4 categories (2, 3-4, 5-6, and >6 years old) for LSR. Least square analysis was accomplished using the general linear model (GLM) procedure of SAS (Version 9.4 SAS Institute Inc., Cary, NC, USA; 2014). Quadratic effects of lamb age at weaning on the studied traits were determined as non-signifcant. (Co)variance components and corresponding genetic parameters for traits were achieved by restricted maximum likelihood (REML) method fitting an animal model using ASReml (Residual Maximum Likelihood) software (Gilmour et al., VSN International Ltd, Hempstead, HP1 1ES, UK; 2006).
Twelve animal models were fitted as follow, assuming LSR to be a continuous trait:
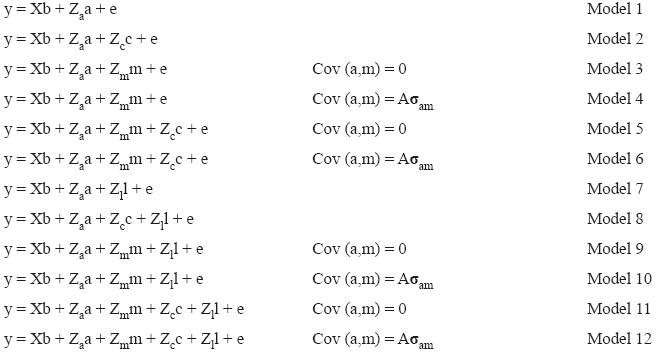
In these models, y, b, a, m, c, l, and e arevectors of observations, fixed effects, direct genetic effect, maternal enetic effect, maternal permanent environmental effect, common litter effects, and residual effects, respectively. X, Za, Zm, Wc, and Wl are the incidence matrices relating observations to the respective fixed and random effects. It wasassumed that:
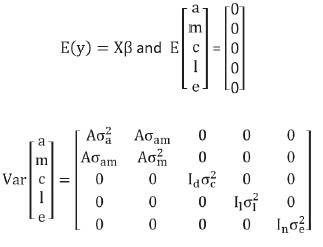
Where β is the vector of fixed effects, A is the additive numerator relationship matrix, σ 2 a is the direct genetic variance, σ 2 m is the maternal genetic variance, σ am is the direct-maternal genetic covariance, σ 2 c is the maternal permanent environmental variance, σ 2 l is the common litter variance, σ 2 e is the residual variance, and Id, Il, and In are identity matrices with orders equal to number of dams, litters, and records, respectively.
Also, for lamb survival rate, heritability obtained by animal and sire models were converted to the underlying liability scale following a standard approximation (Falconer, 1989).
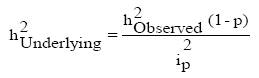
Where:
p: Survival ratio in the flock.
i: Corresponding selection intensity.
Statistical analysis for ewe productivity traits
The fixed effects for ewe productivity traits were ewe age at lambing (4 levels: 2, 3-4, 5-6, and > 6 years old) and lambing year (13 levels, 1999-2011). Moreover, the data for TLWB, LMWL, TLWW, and LMWLW were pre-adjusted for the effect of lamb sex by multiplicative adjustment factors (Van Wyk et al., 2003). The adjustment factors were determined using least square means (LSM) of male and female lambs and records of birth and weaning weight were adjustedaccordingly. The following models were applied to each trait:
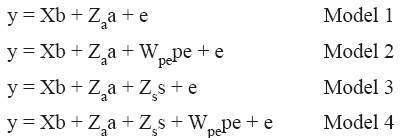
Where, all the terms are as in Models 1-12 for LSR, with the exception of pe and s which denote vectors of permanent environmental effects related to repeated records of the ewes and sire additive genetic effects with corresponding design matrices Wpe andZs, respectively. It was assumed that ewe permanent environmental and service sire effects were normally distributed with mean 0 and variance Id σ 2 pe and Is σ 2 s, respectively, where σ 2 pe, σ 2 s are ewe permanent environmental variance and service sire variance, and Id and Is are identity matrices with the order equal to the number of ewes and service sires.
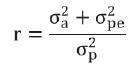
Genetic, phenotypic and environmental correlations were estimated using multivariate analyses and applying the most appropriate models derived from univariate analyses. When the value of -2 log likelihood variance in the AIREML function was below 10−8, convergence was assumed to be achieved. Also, repeatability (r) was calculated using the following formula:
Akaike’s Information Criterion (AIC) was applied (Akaike, 1974) in order to choose the most suitable model for each trait as:
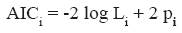
Where, log Li is the maximised log likelihood of model i at convergence and pi is the number of parameters in each model. The model with the lowest AIC was chosen as the most appropriate.
Results
Fixed effects
The least squares mean and standard errors of fixed effects from GLM analysis are presented in Table 2.
Table 2 Least-squares means (± SE) of ewe age on studied traits in Arman crossbred sheep.
| Fixed effects | Traits | ||||||
|---|---|---|---|---|---|---|---|
| LSR (%) | LSB (head) | LSW (head) | LMWLB (Kg) | LMWLW (Kg) | TLWB (Kg) | TLWW (Kg) | |
| Ewe age (year) | ** | ** | ** | ** | ** | ** | ** |
| 2 | 0.88 ± 0.02c | 1.33c ± 0.05 | 1.09d ± 0.06 | 3.89c ± 0.12 | 24.65c ± 1.24 | 4.90d ± 0.12 | 31.00b ± 1.40 |
| 3-4 | 0.94 ± 0.03a | 1.50b ± 0.05 | 1.18c ± 0.05 | 4.12b ± 0.14 | 25.42b ± 1.23 | 5.66b ± 0.11 | 31.48ab ± 1.40 |
| 5 -6 | 0.92 ± 0.02ab | 1.58a ± 0.06 | 1.33b ± 0.06 | 4.48a ± 0.13 | 25.88a ± 1.28 | 6.36a ± 0.14 | 32.12a ± 1.36 |
| > 6 | 0.90 ± 0.02b | 1.48b ± 0.05 | 1.25b ± 0.05 | 4.11b ± 0.12 | 24.59c ± 1.28 | 5.24c ± 0.14 | 31.08a ± 1.25 |
| Lambing year | ** | ** | ** | ** | ** | ** | |
| Birth date | ** | - | - | - | 0.29 ± 0.02 | - | 0.36 ± 0.03 |
LSR: Lamb survival rate; LSB: Litter size at birth; LSW: Litter size at weaning; LMWL: Litter mean weight per lambing; LMWLW: Litter mean weight per lamb weaned; TLWB: Total litter weight at birth; TLWW: Total litter weight at weaning. Means with similar letters in each subclass within a column do not differ significantly.
The LSR was significantly affected by birth type and lamb sex (p<0.01; results not shown). Ewe age at lambing and lambing year on all of the traits were significant as well (p<0.01).
(Co)variance components and genetic parameters
(Co)variance components and estimations of genetic parameters for the traits obtained from the most suitable models are presented in Table 3. Estimates of h2a were low and ranged from 0.08 for LSR and LSW to 0.19 for LMWLW. The repeatability estimates (r) for ewe productivity traits were higher than the corresponding h2a and ratio of permanent environmental variance on phenotypic variance and varied from 0.17 for LSW to 0.23 for TLWB.
Table 3 (Co)variance components and genetic parameters for lamb survival rate and ewe productivity traits fitting the most appropriate model in Arman crossbred sheep.
| Parameter | Traits | ||||||
|---|---|---|---|---|---|---|---|
| LSR | LSB | LSW | LMWL | LMWLW | TLWB | TLWW | |
| Suitable model | 10 | 2 | 4 | 4 | 1 | 4 | 2 |
| σ2 a | 0.010 | 0.038 | 0.019 | 0.240 | 4.78 | 0.34 | 4.523 |
| σ2 pe | - | 0.011 | 0.012 | 0.154 | - | 0.17 | 1.515 |
| σ2 m | 0.005 | - | - | - | - | - | - |
| σ2 l | 0.014 | ||||||
| σ2 s | - | 0.009 | 0.065 | - | 0.14 | ||
| σ2 p | 0.124 | 0.290 | 0.24 | 2.16 | 25.16 | 2.87 | 30.128 |
| h2 a ± S.E | 0.081 ± 0.02 | 0.131 ± 0.008 | 0.080 ± 0.01 | 0.111 ± 0.02 | 0.190 ± 0.02 | 0.118 ± 0.02 | 0.150 ± 0.02 |
| ± S.E | - | 0.038 ± 0.007 | 0.050 ± 0.02 | 0.071 ± 0.02 | - | 0.060 ± 0.03 | 0.050 ± 0.04 |
| s2 ± S.E | - | - | 0.038 ± 0.01 | 0.030 ± 0.01 | 0.049 ± 0.00 | ||
| h2 m ± S.E | 0.04 ± 0.01 | - | - | - | - | - | - |
| l2 ± S.E | 0.11 ± 0.02 | - | - | - | - | - | - |
| ram ± S.E | -0.33 ± 0.12 | - | - | - | - | - | |
| r | - | 0.169 | 0.130 | 0.182 | 0.190 | 0.178 | 0.200 |
| h2 Underlying | 0.253 | - | - | - | - | - | - |
LSR: Lamb Survival rate; LSB: Litter size at birth; LSW: Litter size at weaning; LMWL: Litter mean weight per lambing; LMWLW: Litter mean weight per lamb weaned; TLWB: Total litter weight at birth; TLWW: Total litter weight at weaning. σ2: Direct genetic variance; σ2: Maternal permanent environmental variance; a pe σ2: Maternal genetic variance; σ2: Common litter variance; σ2: Sire service variance; σ2: Phenotypic variance. h2: Direct heritability; pe2: Ratio of maternal m l s p a permanent environmental variance on phenotypic variance; s2: Ratio of service sire variance to phenotypic variance; h2 : Maternal genetic heritability; l2: Ratio of common litter effects to phenotypic variance; ram: Correlation between direct and maternal genetic effects; r: Repeatability; h2 : Underlying heritability.
Correlations
The genetic, phenotypic, and environmental correlations between traits are presented in Table 4. The highest values for genetic, phenotypic, and environmental correlations were obtained between LMWL-TLWW and LMWL-LMWLW, and LMWL- TLWB as 0.91, 0.91, and 0.93, respectively. Generally, the genetic correlations were in the same line with other corresponding correlations.
Table 4 Estimates of correlations between lamb survival rate and ewe productivity traits in Arman crossbred sheep.
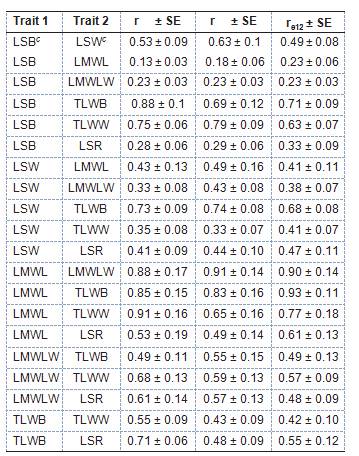
LSR: Lamb survival rate; LSB: Litter size at birth; LSW: Litter size at weaning; LMWL: Litter mean weight per lambing; LMWLW: Litter mean weight per lamb weaned; TLWB: Total litter weight at birth; TLWW: Total litter weight at weaning. rg12: Genetic correlation between trait 1 and 2; rp12: Phenotypic correlations between traits 1 and 2; re12: Environmental correlation between traits 1 and 2.
Discussion
Fixed effects
According to Table 2, the LSR overall mean was 91% from birth to weaning and mature lambs from 3 to 4-year-old ewes had higher viability, that is most likely due to the maternal ability and milk production. Significant effects of birth type and lamb sex on LSR (p<0.05) were comparable with several reports (Riggio et al., 2008; Maxa et al., 2009; Chniter et al., 2011; Rashidi et al., 2011). The effect of ewe age was significant on all traits (p<0.05), which is similar to previous studies (Chniter et al., 2011; Mohammadi et al., 2013; Mohammadi et al., 2015; Roshanfekr et al., 2015). In agreement with the study of Chniter et al. (2011), after one lambing, lamb survival rate and ewe productivity have been increased. A significant effect of lambing year on the mentioned traits were observed (p<0.05). These results were consistent with reports in Scottish Blackface (Riggio et al., 2008), Lori-Bakhtiari (Vatankhah et al., 2008), and Danish sheep (Maxa et al., 2009) as a result of different climatic conditions, rainfall, management, nutrition, health care and relying on sheep pastures and meadows. Significant effect of lambing year on ewe productivity traits has been well documented by several studies (Mokhtari et al., 2010; Mohammadi et al., 2013; Mohammadi et al., 2015; Roshanfekr et al., 2015).
(Co)variance components and genetic parameters
Sheep breeding programs are limited in developing countries due to non-availability of pedigree and the lack of performance records for economically important traits. This lack of dataset has resulted in imprecise genetic parameters. Complete datasets with more associations between dam performance and offspring records as well as more progeny per dam affect the accuracy of partitioning maternal effects into genetic and environmental components (Boligon et al., 2012). The current dataset was large, and fitting complex models was possible because over five generations of animals with data and a moderate twin and triple rate were available (28 and 3%, respectively). The high number of twins enabled a more precise estimation of common litter effects. Current parameters were precisely estimated, with standard errors of 0.02 or lower for heritability estimates.
Estimate of h2 for LSR was 0.081 and enhanced to 0.253 after correcting. It shows that including this trait in breeding goals might be an effective way of enhancing survival rate. In practice, this would involve choosing replacement sires from families with high survival rates. Estimates of h2a for post-natal survival traits was in the range of 0.18 to 0.33 for Scottish Blackface sheep (Sawalha, 2007). Current h2 m estimate for LSR was 0.04 (i.e. half of h2 a and lower than those reported for Texel and Shropshire sheep breeds; Maxa et al., 2009). Current estimates indicated that LSR was more influenced by its additive genes than the maternal ones. Common environmental effect (l2) is an effective factor for estimating the heritability of this trait and should be included in the model. Portion of l2 was remarkable (0.11) for LSR. Similar findings were obtained by Rashidi et al. (2011) in Markhoz goats. The correlation between direct and maternal genetic effects (ram) for LSR was negative (-0.33). Understanding the ram would facilitate the formulation of optimal breeding programs and improve selection efficiency ((Robison, 1981) as negative and positive ram can diminish and accelerate response to selection, respectively (Wolf et al., 1998).
Response to direct selection for litter size is limited by low heritability of the trait, due to its discrete phenotypic expression (Hill, 1985). Estimate of h2 for LSB was 0.13, and it was higher than the estimates in several reports (Vatankhah et al., 2008; Mokhtari et al., 2010; Mohammadi et al., 2013). However, higher h2 a estimate was reported for Lori sheep using threshold models (Mohammadi et al. 2015). The importance of litter size is that an increase in the number of lambs weaned per ewe per year offers the greatest single opportunity for any kind of sheep production. According to the findings reported in the literature (Mokhtari et al., 2010; Mohammadi et al., 2013; Mohammadi et al., 2015), the most appropriate model for LSB should have both direct genetic and permanent environmental effects of the ewes. Estimate of pe2 (0.04) was lower than the corresponding h2 a for LSB, that is comparable with the estimates reported by Mohammadi et al. (2013), Mohammadi et al. (2015), and Roshanfekr et al. (2015) for this trait.
Direct heritability of LSW (0.08) was higher than the estimates reported by other researchers (Vatankhah et al., 2008; Mokhtari et al., 2010; Mohammadi et al., 2013; Roshanfekr et al., 2015). However, higher h2a attributed to fertility, prolificacy, lamb growth, and lamb survival to weaning, and ewe viability from breeding to weaning (Ercanbrack and Knight, 1998).
For LSW, a low h2a estimate showed that loss of lambs from birth to weaning is mainly influenced by environmental factors, lamb’s genotype rather than ewe’s genotype and hewing of some lambs before weaning age. The inclusion of service sire effects (s2) together with direct genetic effects and permanent environmental effects of ewe significantly affected Log likelihoods of LSW, LMWL, and TLWB. Our estimated variances of pe2 and s2 for LSW were 0.05 and 0.04, respectively.
The current estimate for direct heritability of LMWL was 0.11. Our obtained value was within the range of 0.09 (Mohammadi et al., 2015) to 0.19 (Vatankhah et al., 2008). There is a high phenotypic correlation between birth weight and LSR; therefore, LMWL could be used for selecting lambs that will survive until weaning (Fogarty et al., 1984). In the current study, pe2 and s2 estimates for LMWL were 0.07 and 0.03, respectively.
The h2a for LMWLW (0.19) was higher than the value reported by Vatankhah et al. (2008) and Roshanfekr et al. (2015). However, a higher h2a (0.22) was reported by Mokhtari et al. (2010). The h2a estimate of LMWLW was higher than other studied traits, implying that selection for this trait would result in heavier lambs at weaning.
The ewe capacity to produce lamb weight at birth is measured by TLWB, without considering LSB. Estimated value for h2 a of TLWB in the current study (0.12) was congruent with that reported in LoriBakhtiari sheep. Higher values (ranged from 0.06 to 0.2) were reported in several studies (Mokhtari et al., 2010; Rashidi et al., 2011; Mohammadi et al., 2013). Similar to other traits, pe2 and s2 were lower than the corresponding h2 a for TLWB, being 0.06 and 0.05, respectively.
Total litter weight at weaning measures overall productivity in terms of weights of lamb produced per parity, but it does not take into account conception rate. Total litter weight at weaning (TLWW) is the most appropriate criterion for selecting ewes, thus, an index is needed to achieve it. The h2 estimate for TLWW (0.15) was in accordance with that reported by Mokhtari et al. (2010). Lower estimates were reported as well (Van Wyk et al., 2003; Vatankhah et al., 2008; Rashidi et al., 2011; Mohammadi et al., 2015; Roshanfekr et al., 2015). For TLWW, the pe2 estimate was 0.05. A similar finding was obtained for the Kermani sheep by Mokhtari et al. (2010). However, a higher estimate was also reported (Mohammadi et al., 2015).
Repeatabilitiy values for all traits were moderate (from 0.17 for LSW to 0.23 for TLWB). Current repeatability for LSB (0.18) was in agreement with the findings of Vatankhah et al. (2008), Rashidi et al. (2011), and Mohammadi et al. (2013). Repeatability values for LMWLB (0.22), and TLWB (0.23) were similar to the estimated values obtained by Vatankhah et al. (2008). The obtained repeatability for LMWLW and TLWB was in accordance with the study by Mokhtari et al. (2010) .
Correlation estimates
Genetic correlations were low to high, ranging from 0.13 (for LSB-LMWL) to 0.91 (for LMWL- TLWW). Phenotypic correlations ranged from 0.18 (for LSB-LMWL) to 0.91 (for LMWL-LMWLW). Environmental correlations were modrate to high, ranging from 0.23 (for LSB-LMWL) to 0.93 (for LMWL-TLWB).
This study shows that LSB has a strong genetic association with TLWB, which is in agreement with reports by Vatankhah et al. (2008), Mokhtari et al. (2010), and Rashidi et al. (2011). The TLWB and TLWW had positive and relatively high genetic correlations (0.90). This suggests that genes underlying heavy birth weight of litters, through number and weight of lambs are also affecting milk production and maternal behavior of ewes during the pre-weaning period. Estimates of genetic correlations were positive and medium (0.56) for LMWLW-TLWW, showing that growth of lambs from birth to weaning, mothering ability was affected by individual genotype of lambs (Vatankhah et al., 2008). The environmental correlation estimates were positive.
Estimates of (Co)variance components and genetic parameters are necessary for genetic evaluation of sheep and also to choose the best selection program. This study indicated that genetic and non-genetic factors affect survival and ewe productivity traits. Although current results indicate that survival rate and ewe productivity traits have low heritability in Arman sheep, including environmental factors in breeding programs could result in increasing profitability at farm level. Consequently, both animal and maternal genetic effects should be considered in breeding programs to ameliorate viability at birth.

