


 English (pdf)
 Article in xml format
 Article references
 Send this article by e-mail
 Cited by SciELO
  Cited by Google
  Similars in
SciELO
Similars in
SciELO  Similars in Google
 Permalink
Introduction
The commercial production of soybean seeds aims to obtain healthy seeds with a high physiological potential. In order to aid the decisions process regarding the destination of seed lots and to identify differences in performance of the same, it is necessary an evaluation of the physiological potential of the lot. Such evaluation is usually performed through germination tests and measurement of the length of the seedlings and their parts (Medeiros et al., 2019).
Vigor tests require a strict control of the test variables, a more comprehensive interpretation of results and a more specific training by analysts (Marcos-Filho, 2015). These tests are susceptible to human subjectivity of the assessment and require a longer period of time for results to be obtained. Aiming to minimize such limitations, efforts in the development of specific computerized equipment have been made in search of standardizing vigor tests (Marcos-Filho, 2015). In this sense, image analysis techniques associated with vigor tests of seeds have an immense use potential.
In Brazil, the company Tbit Tecnologia e Sistemas has developed a system called GroundEye (GE), which evaluates the vigor of soybean seeds through the development of seedlings. This evaluation is made by analysing high resolution images obtained by the equipment, which allow the extraction of information on colour, texture and geometry, serving as a parameter for the provision of growth indexes, uniformity and vigor of seedlings.
The goal of this work is to verify the efficiency of the GroundEye equipment in characterizing the vigor of soybean seed lots in comparison to other tests recommended in the evaluation of soybean seeds, in search of a methodology which grants less subjectivity and that might be performed in a smaller period of time.
Material and Methods
Characterízation of lots
Sixteen lots of soybean seeds with a different physiological quality were used, being eight lots of the variety 1 (98Y12) and eight lots of the variety 2 (P98Y70). Both were provided by the company DuPont® -Pioneer Seeds Division (Pioneer®)- having a late cycle, determined growth habits and Roundup Ready® gene.
The study has been conducted at the Seed Laboratories of the DuPont Company, Pioneer Seeds Division, and at the Faculty of Agronomy and Veterinary Medicine of the Darcy Ribeiro Campus, University of Brasilia, UnB. Field experiments were carried out at Fazenda Água Limpa, UnB, located in the rural area of Vargem Bonita, Federal District, Brazil (DF).
Water content
We determined the seed water content by the greenhouse method at 105 °C ± 2 °C for 24 hours using two replicates and 5 g of seeds per treatment. The results were expressed as percentage (wet basis) (Brasil, 2009).
Germínatíon test
For the germination test, we used four replications with 50 seeds per treatment. They were germinated in germitest paper in rolls, moistened with distilled water with a volume equivalent to 2.5 times the weight of the dry paper, and placed in a germinator at 25 °C ± 2 °C, according to the criteria described in the Rules for Seed Analysis. A single reading was performed on the fifth day after sowing, where we counted the number of normal seedlings (Brasil, 2009).
Accelerated aging test
The accelerated aging test was performed using the plastic germination box method (AOSA, 2009). Seeds of each treatment were distributed over an internal stainless-steel screen in a single layer, so as to cover it completely and uniformly, and 40 ml of distilled water were added at the bottom of the box. The boxes were capped and kept in BOD (biochemical oxygen demand) regulated at 41 °C ± 2 °C for 48 hours for the subsequent germination test. A single reading was performed on the seventh day after sowing by determining the percentage of normal seedlings (Marcos-Filho et al., 2009).
Cold test
For the cold test, four replications of 50 seeds were used for each treatment. Sowing was performed in plastic trays using a 2:1 mixture of soil and sand moistened at 60 % of its water retention capacity. After sowing, the boxes were kept in a cold room at 10 °C ± 2 °C for five days. Subsequently, the boxes were conditioned in a plant growth chamber at 25 °C ± 2 °C for five days, when we performed the counting of emerged seedlings (Barros et al., 1999).
Tetrazolium test
To conduct the tetrazolium test, the methodology described by Franca Neto et al. (1998) has been applied, using samples of 100 seeds (two subsamples with 50 seeds) for each variety, treatment and repetition, in which the samples had been preconditioned between sheets of moistened paper towel, with a volume of water equivalent to 2.5 times the mass of the paper, for 16 hours at 25 °C. The seeds were then placed in plastic containers and submerged in a 0.075 % solution of 2,3,5-triphenyl tetrazolium chloride at 40 °C, in the dark, for 150 minutes. After this period, the seeds were washed under running water and analysed individually.
Seedling emergence in the field test
The sowing has been performed manually with four repetitions of 50 seeds per treatment. The parcels were randomly distributed with a 10 cm space between the lines and the counting of the seedlings has been done seven days after the installation (Brasil, 2009).
Image analysis
To obtain seedling images, we performed a germination test with four replications and 50 seeds per treatment using as a substrate a paper towel in the form of a roll moistened with a water content equivalent to 2.5 times its dry weight. Then, the rolls were conditioned in a germinator at 25 °C ± 2 °C for three days, when images were captured (Pinto et al., 2015).
Capturing the images
To capture images, the seedlings were carefully removed from the paper towel and placed on a transparent acrylic tray so that seedlings did not touch each other. Subsequently, the tray was inserted into the capture chamber of the equipment for image capture and analysis. Germination test images were captured by a professional high-resolution camera contained in the GroundEye capture chamber (Pinto et al., 2015).
The background colour calibration was HSV colour space, hue between 198.4 and 278.4, saturation between 0.389 and 1.000, and brightness between 0.000 and 1.000. The type of recognition parameter was seedlings with three days, depth fill not selected, and minimum object discard size of 0.3 cm2.
Seedling and root length
After the image capturing of seedlings of the germination test on the third day, we carried out a manual measurement of seedling length (SL) and root length (CR) (Nakagawa, 1999) to later compare them with the results obtained by the software. To carry out measurements, a ruler fixed to the table was used (reading in centimetres). For dead or non-germinated seeds, a zero value was assigned. The result was expressed in mean seedling and root length, by manual measurement and software measurement (Nakagawa, 1999).
Automatic calibration
The automatic calibration process performed by the GroundEye (GE) software consisted of capturing images of soybean seedlings three days after sowing in the germination test and the later association with vigor value obtained by accelerated ageing test for the same lots.
We used 38 lots with approximately 100 seedlings per lot for image capturing. Variation in vigor was 44-97 %, according to the accelerated ageing test. These lots were different from those adopted for data collection.
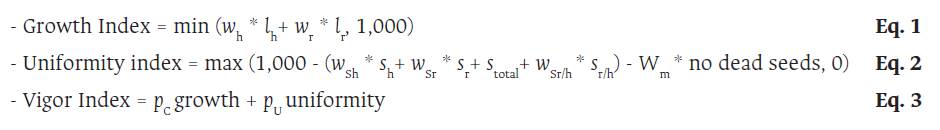
After this process, the value obtained by the accelerated ageing test was associated by the system to its respective image, so that, by multivariate regression, the weight of the parameters contained in the formulas described below was defined, according to Pinto et al. (2015):
Where: lh and lr: sample means of hypocotyl and root length; sh, sr, stotal and sr/h: standard deviation of hypocotyl and" root length total length and ratio between root and hypocotyl; pC and pu: weight of growth and uniformity indexes; w: weight of the parameters.
Experimental design and statistical analysis
The experiment has been conducted in a completely random design with four repetitions, with each sample containing 50 seeds, both in the first stage of the characterization of the lots (water content, germination, emergence of seedlings in the field, accelerated ageing, cold test and tetrazolium), and in the second stage of the evaluation of efficiency of the GroundEye. In the second stage new tests have been conducted (accelerated ageing, seedling length and root length), following the same methodology of characterization of the lots, denominated as manual tests, and its results were compared to the results obtained through the GroundEye (automatic vigor, seedling length and root length), denominated as automatic tests. Thus, such evaluation has been accomplished in an 8x2 factorial scheme for each of the varieties isolated, being 8 lots of seeds and 2 types of tests (manual and automatic). We performed an analysis of variance, and means were compared by a Scott-Knott test at 5 % probability. The software used was ASSISTAT version 7.7 (Silva & Azevedo, 2009).
Results
The water content of the eight lots of both soybean varieties was similar. For the lots of the variety 1, there was a variation from 10.6 % to 11.9 %, and for lots of variety 2, there was a variation from 11.2 % to 12.2 %.
In all lots of the variety 1, the values were above 80 % by the germination test. The lots 1, 2, 5, 6 and 7 had the highest values, and the lots 3, 4, and 8 had the lowest values (Table 1).
Table 1 Mean results obtained by evaluation of the physiological quality of soybean seeds from eight lots of the variety 1
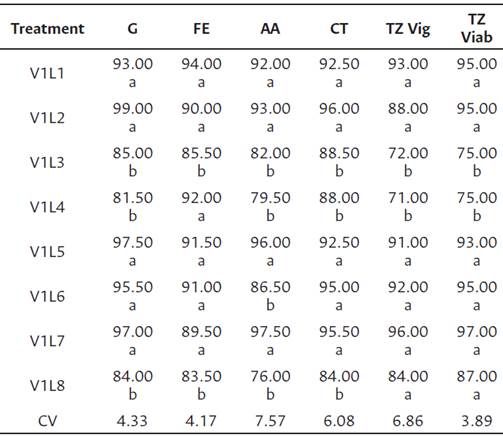
Means followed by the same lowercase letter in rows belong to the same group, according to the Scott-Knott test at 5 % probability; V1: variety 1; L(n): lots from 1 to 8; G: germination standard test; FE: field emergence; AA: accelerated aging; CT: cold test; TZ Vig: Tetrazolium vigor; TZ Viab: Tetrazolium viability.
For seedling emergence in the field test, the lots 3 and 8 differed statistically from the others, obtaining the lowest emergence in the field percentages. By the accelerated ageing test, there was a potential of experimental lots, allowing the classification of lots into two levels: lots 1, 2, 5, and 7 were the most vigorous lots, and the lots 3, 4, 6, and 8 were the less vigorous lots. Such result is consistent with the high germination level under laboratory conditions and with field emergence observed for the lots 1, 2, 5, 6, and 7.
The results of the tetrazolium test (TZViab and TZVig) and the cold test corroborate those of the other tests: the lots 1, 2, 5, 6, and 7 had the best results, although they did not differ statistically from the lot 8 in the tetrazolium test. Such results demónstrate the high performance of such lots in a wide range of environmental conditions.
The results for lot vigour of this variety by accelerated ageing test, cold test and tetrazolium test were higher than 80 %, with the exception of the lots 4 and 8 in the accelerated ageing test and the lots 3 and 4 in the tetrazolium test. We were able to classify lots at different vigour levels (Table 1).
In the lots of the variety 2, by germination test, we could verify that all lots presented values above 80 %. In the same way as for the variety 1, it was possible to classify the 8 lots of the variety 2 into two levels, where the best results were observed for the lots 4 and 7. Such result is similar to the seedling emergence in the field test. The lots 4, 6, 7, and 8 obtained the best results. However, the emergence rate was lower, and all lots were below an 80 % average (Table 2).
Table 2 Mean results obtained by evaluation of the physiological quality of soybean seeds from eight lots of the variety 2
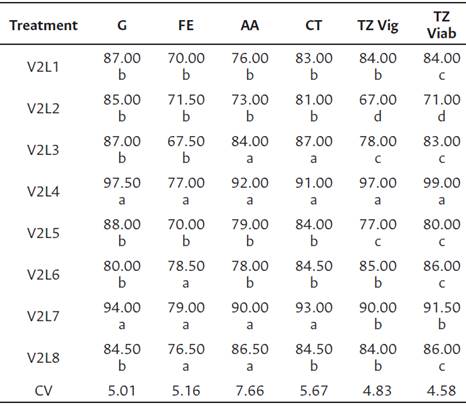
Means followed by the same lowercase letter in rows belong to the same group, according to the Scott-Knott test at 5 % probability; V2: variety 2; L(n): lots from 1 to 8; G: germination standard test; FE: field emergence; AA: accelerated aging; CT: cold test; TZ Vig: Tetrazolium vigor; TZ Viab: Tetrazolium viability.
By the accelerated ageing test, we classified the lots into two levels, where the lots 3, 4, 7, and 8 obtained the best results. In this test, the lots 1, 2, 5, and 6 presented a mean below 80 %, thus classifying it as presenting medium/low vigor.
For the cold test, we observed that the lots 3, 4, and 7 obtained the best vigor indexes. In the tetrazolium test, there was a great variation among results, both for vigor index and for viability, allowing a classification into four vigor levels, by which the lot 4 obtained the best result.
By a characterization of the physiological quality of the lots of soybean varieties, we could determine that (a) for the variety 1, the lots 1, 2, 5, 6, and 7 were classified as presenting a high vigour in all characterization tests, with the exception of the accelerated ageing test, and the lots 3, 4, and 8 were classified as presenting medium vigor; (b) for the variety 2, the lots 4 and 7 were classified as presenting a high vigor in all characterization tests, with the exception of the tetrazolium test for the lot 7. The lots 1, 3, 5, 6, and 8 presented a medium vigor and the lot 2 presented a low vigor.
The means of the results by manual tests and by the GroundEye software for variety 1 are shown in Table 3. As a result of the accelerated ageing test, it was possible to classify the lots into two groups, where the highest values were found for the lots 1, 2, 5, and 7. The result of the automatic vigor index also indicated lot 6 as more vigorous. This result was similar to that verified for the characterization of lots, where the lots 1, 2, 5, 6, and 7 were characterized as presenting a high vigor.
Table 3 Mean valúes obtained by traditional tests and via GroundEye for eight lots of variety 1
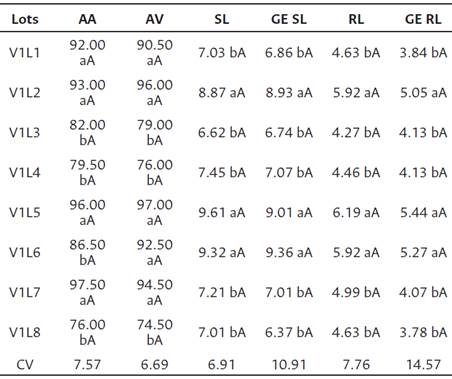
Means followed by the same lowercase letter in rows and upper-case letters in lines belong to a same group according to the Scott-Knott test at 5 % probability level; V1: variety 1; L(n): lots from 1 to 8; AA: accelerated aging; AV: automatic vigor; SL: seedling length by manual measurement; RL: root length by manual measurement; GE SL: seedling length by GroundEye; GE RL: root length by GroundEye.
Comparing the results of the accelerated ageing test with the AV values of the software, we noted that there were no differences between the two methods of evaluating lot vigor, that is, the evaluation performed by the software can be statistically compared with accelerated ageing test data (Table 3).
The results for seedling and root length, by manual measurement and GroundEye software, indicated the lots 2, 5, and 6 as the most vigorous. We observed that there is no statistical difference between the two types of analysis for all lots. This evidences the efficiency of the analysis performed by the GroundEye software.
The means of the results by manual tests and by the GroundEye software for variety 2 are shown in Table 4. The results of automatic vigor index indicate the lots 4, 7, and 8 as the most vigorous. We observed the same result for seedling and root length using the GroundEye software and for root length by manual measurement. These results were different from the results of the accelerated ageing test, as it also classified lot 3 as the most vigorous. By the manual measurement of seedling length, the lots 4, 5, 6, 7, and 8 obtained the best results.
Table 4 Mean values obtained by traditional tests and via GroundEye for eight lots of variety 2
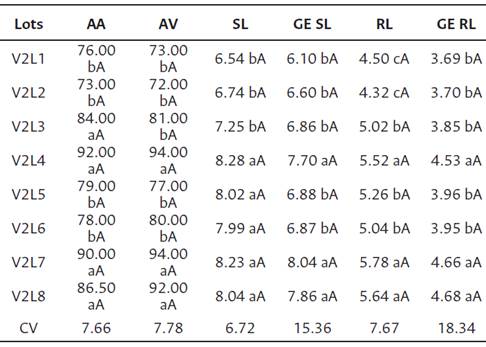
Means followed by the same lowercase letter in rows and upper-case letters in lines belong to a same group according to the Scott-Knott test at 5 % probability level. V2: variety 2; L(n): lots from 1 to 8; AA: accelerated aging; AV: automatic vigor; SL: seedling length by manual measurement; RL: root length by manual measurement; GE SL: seedling length by GroundEye; GE RL: root length by GroundEye.
Despite a greater variation between the results of the lots of the variety 2, all tests evidenced that the lots 4 and 7 presented the best results, confirming their superiority as described in the characterization of lots of the variety 2. This variation contributed positively to the evaluation of GroundEye efficiency, since its efficiency was observed even for medium/ low vigor lots.
In addition to the comparison between lots, a comparison was made between the types of test (manual and automatic). No statistical differences were shown variety 2.
Discussion
The uniformity of water content among seed lots is of paramount importance to obtain consistent results, since differences greater than two to three percentage points may interfere with the results of vigor tests (Marcos-Filho et al., 2009). This is because the rate of water uptake by seeds exerts an influence on such tests.
In both varieties, the results above 80 % for germination are within the minimum standards for the commercialization of soybeans in Brazil (Brasil, 2013).
Due to the proximity of field emergence and germination results (Table 1), it is possible to infer that the lots of the variety 1, besides having a high vigor, did not encounter adverse field conditions, expressing their full potential.
According to Franja-Neto and Krzyzanowski (2018), in the tetrazolium test, values above 85 % are for lots with a very high vigor, between 84 % and 75 % for lots with a high vigor, between 74 and 60 % for lots with a medium vigor, between 59 % and 50 % for lots with a low vigor, and below this, for lots with a very low vigor. In this context, the lots 1, 2, 5, 6, and 7 are very vigorous lots, the lot 8 has a high vigor and the lots 3 and 4 have a medium vigor (Table 1).
Considering the results obtained for the variety 1 in all tests, the lots with the lowest physiological quality values are lots 3, 4 and 8. These lots had the greatest variation among the results. This variation is more visible in lots with a medium and low physiological potential, since the process of deterioration of a seed lot affects each individual seed, making this variation more visible (Pinto et al., 2015).
For variety 2, the percentage of emergence of seedling in the field was smaller than the germination, which can be associated to the lower vigor of the lot once the means of the vigor tests of such variety were smaller and varied more when compared to variety 1. This data corroborates the documented information in the literature that associates the emergence of the seedlings in the field as a vigor test (Rodrigues et al., 2020). In the evaluation of the physiological potential of soybean seeds, Yagushi et al. (2014) found similarity between the data of emergence of seedlings in the field and the data obtained in the tetrazolium and accelerated ageing tests. Similarly, Wendt et al. (2017) found connection between the results of emergence of the seedlings in the field and the results of the tetrazolium test, accelerated ageing test, electric conductivity and the analysis of carbon dioxide concentration.
In spite of the great variation among the results of characterization of the lots of variety 2, we may observe that lots 4 and 7 had the best general performance, both by statistical analysis and by determination of the numerical value of each test results (Table 2), evidencing their superior physiological quality.
Rodrigues et al. (2020), using the Vigor-S equipment (Seed Vigor Automated Analysis System), concluded that such equipment is efficient in the evaluation of vigor of soybean seeds. Carvalho et al. (2020), also using the Vigor-S equipment, successfully obtained information of the root length and the hypocotyls, seedlings length, vigor index and uniformity to the evaluation of the phyto-toxicity in soybean seeds treated with phytosanitary products in different moments of application.
The use of the GroundEye, when compared to the accelerated ageing test and the measurement tests of seedling and root length, demonstrates the precision of the equipment and the speed in which results can be obtained. According to the methodology of the accelerated ageing test (AOSA, 2009), nine days are needed for obtaining the results. As for the vigor results from the GroundEye, the analyses of the images are accomplished in seedlings from the germination test with only three days, representing a great contribution to the quality control programs of seed producing companies once there is a constant need for rapid and accurate information regarding the quality of the seed during the production process.
Conclusions
The results obtained in this study show that the computer analysis of seedling images using the Ground Eye is efficient in determining the physiological potential of soybean seeds. Such evaluation can be performed on the third day after the germination test, thus reducing in six days the time needed to obtain the results, being indicated in the use of quality control programs of seed production companies.

