


Services on Demand
Journal
Article
 text in
  Spanish (pdf)
 Article in xml format
 Article references
 Send this article by e-mail
Indicators
-
 Cited by SciELO
 -
 Access statistics
Related links
-
 Cited by Google
 -
 Similars in
SciELO
Similars in
SciELO -
 Similars in Google
Share

 Permalink
Ingeniería e Investigación
Print version ISSN 0120-5609
Ing. Investig. vol.30 no.2 Bogotá May/Aug. 2010
Everardo Inzunza González1, Jesús Everardo Olguín Tiznado2, Juracy Soares López3, Liliana Cardoza Avendaño4, Claudia Camargo Wilson5 and Juan Miguel Hernández Ontiveros6
Abstract
This article presents the development of a personal computer-based AM/FM radio station operating on the AM/FM commercial band. Developing the graphical user interface for the software and the interconnection with an RF function generator by means of a GPIB is presented. Computer users can enter the desired transmission frequency within the commercial band as well as the transmission potency.
Key words: Amplitude modulation, frequency modulation, general purpose interface bus (GPIB), radio frequency carrier, modulating signal.
Received: feb 27th 2009 Accepted: march 27th 2010
Introduction
A brief history of radio
This communications' medium emerged from a succession of discoveries which began in the late nineteenth century. The first wireless telegraph communication happened on May 14th 1894 between Laverck Point and Fratholm Island in the Bristol Channel which are separated by a distance of about 5 miles. The author of this great discovery was Gugliermo Marconi, an Italian physicist (Tomasi, 2003).
This first wireless communication continued a series of technological advances which gradually improved communication quality and quantity. The origin of radio stations in different parts of the world has been very different (i.e. government, private, for cultural, commercial).
They were originally designed for information purposes only and then began to vary their range of action to provide information, music, culture, entertainment, etc.
General purpose interface bus.
Hewlett-Packard designed the Hewlett-Packard interface bus (HP-IB) in 1965 to connect their line of programmable instruments to their computers. This bus quickly gained popularity due to its high transfer rates (nominally 1 Mbytes / s). It was later accepted as IEEE standard 488 in 1975 and was involved in ANSI / IEEE 488.1 in 1987. The name general purpose interface bus (GPIB) is more used today than HP-IB. ANSI / IEEE 488.2 strengthened the original standard defining how controllers and instruments communicate in 1987; standard commands for programmable instruments (SCPI) took command structure defined as IEEE 488.2 and created a single comprehensive programming command which is used with any SCPI instrument.
Fundamentals of amplitude modulation (AM)
This modulation technique varies radio frequency wave amplitude. Amplitude modulation occurs when a low frequency (LF) signal controls the amplitude of a high frequency (HF) wave. Radio and television could not have been possible without such modulation.
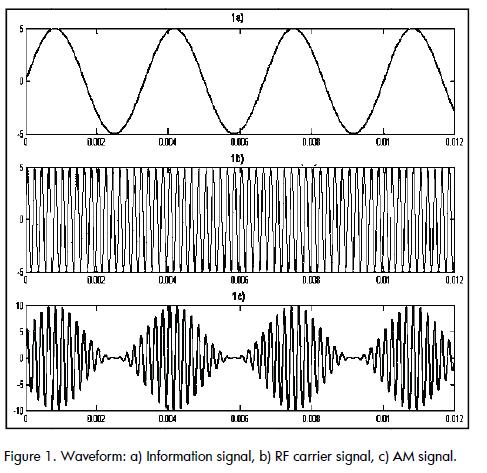
Transmission involves two fundamental processes. Low frequency (LF) information is mixed with the radio frequency (RF) carrier; this is called modulation (Jardon, 2002). Then there is the demodulation process (i.e. information retrieval, which is also called detection). Figure 1a shows an example of a 300 Hz information signal; Figure 1b shows the 5 kHz carrier signal. It can be seen in Figure 1c that amplitude modulation produces an envelope signal on the carrier.
Fundamentals of frequency modulation (FM)
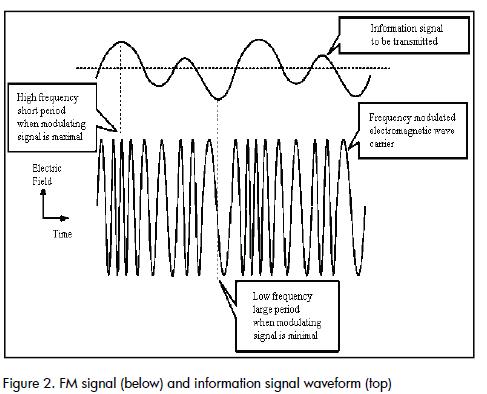
The carrier's peak amplitude remains constant in FM, while carrier frequency is changed by the action of the modulating signal (Ibarra et al., 2007). Since information signal amplitude varies, it produces proportional shifts in carrier frequency. Increasing modulating signal amplitude also increases carrier frequency. If the amplitude of the first decreases then carrier frequency also decreases, as shown in Figure 2Likewise, the inverse relationship can be implemented.
A crease in modulating signal amplitude causes an increase in carrier frequency above its central value whilst an increase in modulating signal amplitude causes a decrease in carrier frequency below its central value. As the modulating signal varies the amplitude, carrier frequency changes above and below its central or resting value when there is no modulation. The increase caused by the modulating signal in carrier frequency is called frequency deviation,fd. Maximum frequency shift occurs at maximum modulating signal amplitude. Modulating signal frequency determines the frequency deviation ratio (i.e. how many times per second carrier frequency deviates above and below its central frequency). If the modulating signal is a 500 Hz sine wave, then carrier frequency deviates above and below its central frequency rate 500 times per second.
Consider a 150 MHz carrier frequency; if modulating signal amplitude causes a maximum 30 kHz shift frequency, then carrier frequency will deviate up to 150.03 MHz and 149.97 MHz below. Total frequency deviation is 150.03 - 149.97 = 0.06 MHz or 60 kHz. However, in practice, frequency offset is expressed as being the amount of carrier frequency shift above and below centre frequency. The frequency offset for the 150 MHz carrier frequency is thus represented as being ± 30 kHz. This means that the modulating signal causes 30 kHz carrier frequency variation above and below centre frequency. It may be noted that modulating signal frequency has no effect on the degree of deviation which is, strictly speaking, a function of modulating signal amplitude.
The frequency shift (which is exaggerated in Figure 2,) is proportional to signal amplitude. An FM carrier signal of around 100 MHz is limited to ± 0.1 MHz modulation. FM transmitters normally modulate within ± 0.53 MHz.
The FM band's electromagnetic spectrum is between 88 MHz and 108 MHz; carrier waves for individual stations are separated by 200 kHz (up to 100 stations). These FM stations have a maximum 75 kHz deviation of centre frequency, leaving them 25 kHz above and below (guard bands) to minimise interference with adjacent frequency bands.
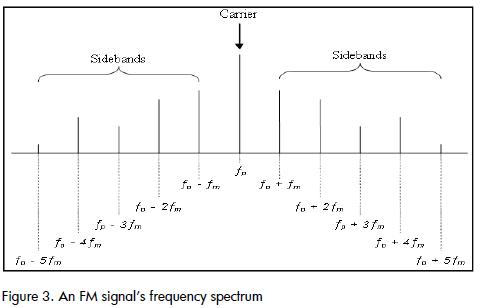
Varying modulating signal amplitude changes carrier frequency deviation. The number of sidebands produced, their amplitude and spacing depends on modulating signal frequency deviation. It should be remembered that an FM signal has constant amplitude. As an FM signal has the sidebands' frequency, then these bands' amplitude should vary with modulating signal frequency deviation and frequency. In theory, the FM process produces an infinite number of upper and lower sidebands and, therefore, a theoretically infinite bandwidth.
However, FM signal bandwidth is generally larger than that of an AM signal having the same modulating signal.
Bessel functions: Given the modulation index, the number and amplitudes of significant sidebands can be resolved in a basic FM signal equation (Frenzel, 2008). Such equation would thus be:

Where VFM represents the FM signal's instantaneous value and fm, represents the modulation index. The equation given as (1) is solved using a complex mathematical process known as Bessel functions (Frenzel, 2008). This approach does not need to be replicated; however, the result is expressed in the following equation (2):
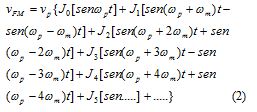
Where ωp=2πfp represents carrier frequency. represents modulating signal frequency. ωm=2πfm modulating signal frequency. Vp prepresents the peak value of the carrier without modulation.
The FM wave is expressed as a composition of sine waves having different frequencies and amplitudes so that when the sine waves are added they create an FM signal in time domain. The first term is the carrier with the amplitude given by the coefficient Jo . The next term represents a pair of upper and lower side frequencies equal to the sum and difference of the carrier frequency and modulating signal frequency. The amplitude of these sidebands is J1 . The term that follows is another pair of side frequencies equal to the carrier frequency ± 2 times modulating signal frequency.
Experimental development
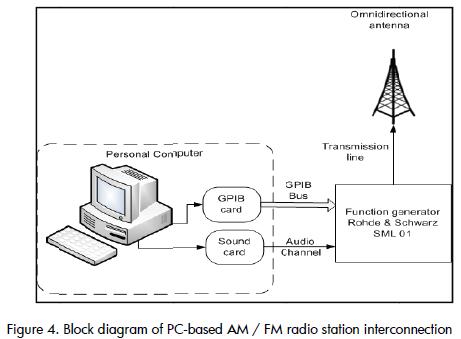
Figure 4 shows the block diagram for the AM / FM radio station developed here (Luna, 2005). The personal computer (PC) user would reproduce the audio signal with any commercial software. Broadcast audio would be fed into the PC via an ordinary microphone for sound card and audio signals mixed inside the PC. The PC would send the audio information through the sound card to the RF generator (Rohde & Schwarz SML01). Information about power frequency and transmission, modulation type selected, on / off modulation, RF signal on / off would also be sent through the GPIB bus. The function generator would mix the information signal with the RF carrier signal thereby producing the AM / FM signals which would be sent through a coaxial cable to an omni-directional antenna.
Software development
This software was developed using the Matlab Application Program Interface Guide.
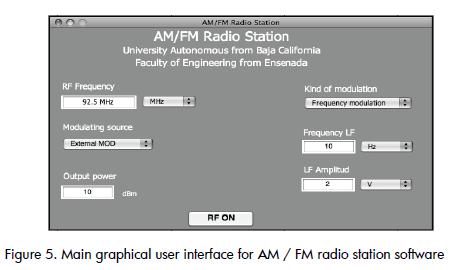
Figure 5 shows the software's main graphical user interface which controlled the RF function generator. The program window had four editable fields in which the desired frequency, power, modulation (AM/FM) values could be entered, considering that the parameters lay within the range allowed by the radio frequency generator. Such fields would have been RF frequency, LF frequency (internal signal information), LF amplitude and signal generator output power. The modulating source (internal or external), modulation type (AM / FM select the) and enabling or disabling the RF output could also be selected via a popup menu.
Results
Power RF signal
Several images of the electromagnetic spectrum of an FM signal transmitted during the course of this work are shown below. 90.3 MHz centre frequency was used in this case as there were no commercial radio stations adjacent to this frequency band in the port city of Ensenada, Baja California, Mexico.
Figure 6 shows that carrier signal frequency was centred at 90.3 MHz and its power was -46.9 dBm. There was a great loss in RF power despite the fact that it was at a distance of around 5m; there were leaks during propagation and in the transmission line, also because all power was radiated in many directions (via omni directional antenna).
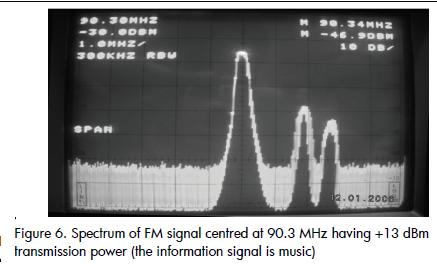
The other two frequencies observed in the spectrum analyzer came from two commercial radio stations in the city of Ensenada, Baja California, Mexico (92.1 and 92.9 MHz).
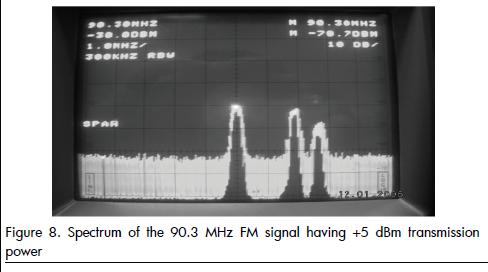
The pictures shown below are of the spectrum at different power transmission values used for testing the system. Figure 7 shows that the FM signal spectrum was transmitted at 10 dBm RF power.
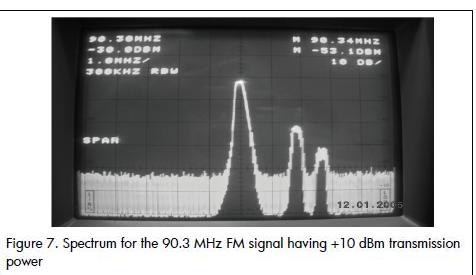
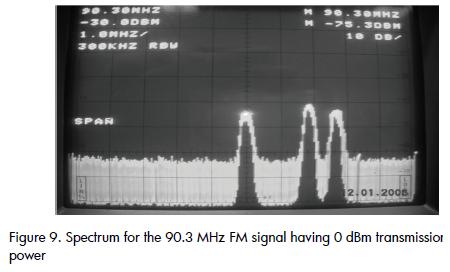
5 dBm and 0 dBm RF power were being used in Figures 8 and 9, respectively
Real bandwidth
Two equations were used for calculating the actual bandwidth of an FM signal:

Where N represented the number of sidebands, obtained from Figure 3 from the modulation index mf shown by eq. (4)
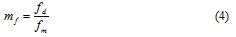
Where fd, represented FM signal frequency deviation and represented modulating signal frequency (information).
Another way of calculating the real bandwidth (Frenzel, 2008) was by using Carson's rule, shown in equation (5):

As shown in Figure 10, bandwidth was 250 KHz, taking N=8, and considering that the span was 50 KHz for horizontal box. The calculated bandwidth was 240 KHz using equation (3) ( Figure 10). In this case the modulating signal was a 15 KHz sine wave; this frequency was used because it was the maximum audio allowed in commercial FM radio stations at the time.
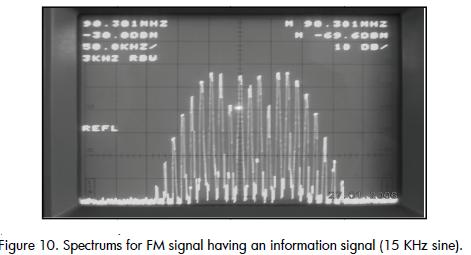
Figure 10 also shows an FM signal spectrum using a 15 KHz sine wave as modulating signal. Frequencies remained fixed in the spectrum because the modulating signal frequency remained fixed. It can be seen how the bandwidth was approximately 300 KHz because the spectrum analyzer displayed samples of the spectrum as the sound changed.
Figure 11 shows an FM signal spectrum, using audio pop music as modulating signal. The spectrum was constantly changing as the audio varied greatly in frequency and amplitude and because the spectrum analyzer displayed samples of the spectrum as the sound changed. If the measurement span were opened up, it could be seen that the bandwidth was around 150 KHz.
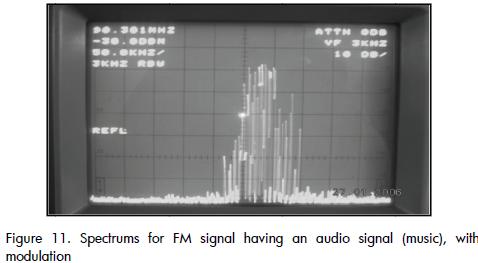
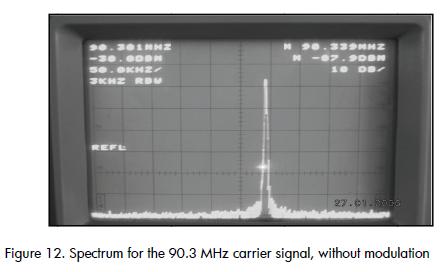
Figure 12 shows the spectrum for a carrier signal without frequency modulation; one can see how the bandwidth was less than when frequency was modulating.
Conclusions
This paper has presented the development of a personal computer-based AM/FM radio station operating in the AM (530-1600 KHz) and FM (88-108 MHz) commercial band. It has shown the development of a graphical user interface and interconnection with RF function generator for transmitting audio information reproduced on a computer or by an announcer's voice.
Radio frequency generator control was based on standard GPIB. Such AM / FM radio station may be used for transmitting internal events from universities, industry, shopping centres, sporting events, etc.
It should be mentioned that it is very important to obtain a broadcasting licence for the carrier's centre frequency from the government agency for the country where the system will be installed.
Nomenclature
AM: amplitude modulation
FM: frequency modulation
RF: radio frequency
GPIB: general purpose interface bus
HP-IB: HewlettPackard interface bus
SCPI: standard commands for programmable instruments
LF: low frequency
PC: personal computer
BW: bandwidth
Frenzel, L. E., Principles of Electronic Communication Systems., Glencoe, McGraw-Hill (ed.), 2008. [ Links ]
Ibarra Q. R., Serrano M. A., Principios de teoría de las comunicaciones., Limusa (ed.), México D.F., 2007. [ Links ]
Jardón, H. A., Fundamentos de los sistemas modernos de comunicación., Alfaomega (ed.), México D.F., 2002. [ Links ]
Luna R. J., Sistema de medición automatizado para la caracterización de dispositivos de baja frecuencia., BSc Electronic Engineering thesis, Universidad Autónoma de Baja California, Campus Ensenada, 2005. [ Links ]
Tomasi W., Sistemas de comunicaciones electrónicas, Prentice Hall (ed.), 4th ed., México, D.F., 2003. [ Links ]

