


Services on Demand
Journal
Article
 text in
  Spanish (pdf)
 Article in xml format
 Article references
 Send this article by e-mail
Indicators
-
 Cited by SciELO
 -
 Access statistics
Related links
-
 Cited by Google
 -
 Similars in
SciELO
Similars in
SciELO -
 Similars in Google
Share

 Permalink
Ingeniería e Investigación
Print version ISSN 0120-5609
Ing. Investig. vol.30 no.2 Bogotá May/Aug. 2010
Luis F. Marmolejo R.1, Rafael A. Klinger A.2, Carlos A. Madera P.3, Javier Olaya O.4, Carolina Marcos B.5 and José A. Ordóñez A.6
1 Sanitary Engineer. M.Sc., in Health Administration, Universidad del Valle. Cali, Colombia. Ph.D. candidate, Universidad del Valle, Cali, Colombia. Assistant Professor, School of engineering, Escuela EIDENAR, Universidad del Valle, Cali, Colombia. lufermar@univalle.edu.co2 Bachelor of Mathematics,, Universidad Santiago de Cali, Cali, Colombia. Statistical, Universidad del Valle, Cali, Colombia. Professor, Universidad del Valle. Professor, School of engineering, Escuela de Ingeniería. rafael.klinger@correounivalle.edu.co 3 Health Engineering, Universidad del Valle, Colombia. M.Sc., in Sanitary and Environmental Engineering, UNESCO-IHE, Holanda. Ph.D. Student, Universidad del Valle, Cali, Colombia. Assistant Professor, Universidad del Valle, School of engineering, Escuela EIDENAR, Colombia.cmadera@univalle.edu.co 4 Chemical Technologist, Universidad del Valle. Statistical, Universidad del Valle. MSc, Clemson University. Ph.D., Clemson University. Professor, Industrial and Statistics, School of engineering, Universidad del Valle, Escuela de Ingeniería. Colombia. javier.olaya@correounivalle.edu.co 5 Sanitary Engineer, Universidad del Valle. M.Sc., in Sanitary and Environmental Engineering, UNESCO-IHE, Holanda. Ph.D. Student, Universidad del Valle. Cali, Colombia. Assistant Professor, School of engineering, Universidad del Valle, Escuela EIDENAR. cmadera@univalle.edu.co 6Sanitary Engineer, Industrial Engineering, Universidad del Valle, Cali, Colombia. Fraunhofer IGB (www.igb.fraunhofer.de). joseabdonordonez@hotmail.com.
Abstract
A sampling and characterisation plan for residential solid waste (SW) produced in the city of Cali in Colombia was developed between January and September 2006; this required designing an undisclosed strategy in the country and the results showed the need for an adjustment to the current SW Colombian classification scheme. The available sampling frame made a two-stage sampling plan necessary, block side (BS) being the first stage and household BS the second. A 0.39 kg/(person-day) solid waste per-capita production (PCP) was found, which increased with socioeconomic status. Food waste was produced most, a large part consisting of cooked food. Waste from personal hygiene items was a third category, although this is not currently a category which is included in Colombian Technical Standard RAS 2000. Although characterisation techniques are used worldwide, the results showed the relevance of available sampling frame-based local characterisation, using local data for sampling methods and associated sample size selection.
Keywords: solid waste classification, block side, sampling framework, sampling plan, per-capita production (PCP).
Received: march 30th 2009
Accepted: april 15th 2010
Introduction
The growing generation of solid waste (SW) and potential utilisation loss of these residues have been identified as fundamental aspects associated with Colombia's environmental problems (Minambiente, 1998). The Colombian Government has laid down standards in the search for solutions to such problems, such as Decree 1713/2002 and resolution 1045/2003 committing all Colombian municipalities to formulating and implementing Integrated Solid Waste Management Plans (ISWMP). The SW management hierarchy has been defined in coherence with integrated solid waste management (ISWM) and in harmony with the intervention lineaments stated worldwide during events such as the Rio and Johannesburg summits; such hierarchy was aimed at integrating reduced generation, recovery and valuation, treatment and final disposal of SW (Minambiente 2002).
A fundamental element for intervention in any of the options included in the hierarchy is the availability of reliable information regarding waste generation and composition. However, researchers like Diaz (Diaz et al., 2002) have pointed out that, "in most developing countries there is a very limited amount of reliable information dealing with the characteristics of the waste generated," and moreover, that, "only a limited number of properly planned and executed waste characterisation programmes have been carried out." Authors like Hrivstosky (Hrivstosky et al., 2007) have pointed out that short-term characterisation studies may be an alternative for solving the lack of scientifically-valid data necessary for efficient solid waste management and, furthermore, that its execution does not require large amounts of funds or resources.
There was a lack of information about SW characteristics with regard to Cali (the second Colombian city in terms of population) information regarding residential SW quantification and composition was required to comply with planned ISWMP strategies, finding that the available data, besides having been obtained ten years before, showed limitations in elements such as the sampling framework and sample selection and did not include the required information for estimating sample size.
Cali's Planning Department (DAP) and the Universidad del Valle carried out a sampling and characterisation study in 2006 to solve this situation in which statistical sample criteria-based methodology was structured, unlike recent studies basing their conclusions on other sampling forms (Klinger et al., 2009). As a result, the need for enlarging the categories included in the classification scheme proposed nationwide in the Republic of Colombia's Technical Regulation of Potable Water and Improvement (RAS 2000) (Mindesarrollo, 2000) was identified; information on production and composition by economic socioeconomic stratum was thus obtained, indicating the need for establishing specific intervention strategies.
Methodology
Sampling plan design
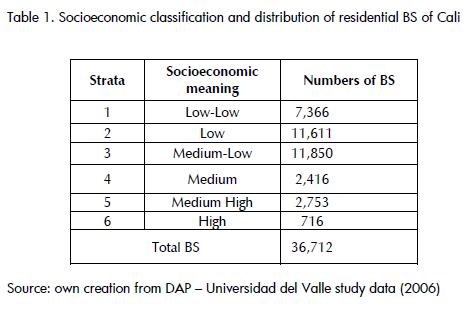
The sampling population consisted of households formed by block side (BS) found on DAP's database (sampling framework). BS information in this sampling framework was organised by community, classified by socioeconomic strata regarding the national classification of socioeconomic strata established by Law 142/1994 (Congreso de Colombia, 1994). A BS was defined as being a household set occupying one of the two opposite sides of a street, from one corner to the other (Klinger et al., 2009). Table 1 shows information about the number of BS by socioeconomic stratum in Cali.
A conglomerate bi-stage sampling programme had to be designed taking into account that households would be arrived at through the BS. The design included two populations: SW produced by the number of households in the urban area of Cali by socioeconomic strata and the number of inhabitants in the urban area, these being generators of the first population.
The following delimitations were taken into consideration for the two populations:
Space: Cali's urban area (geographical coverage).
Period: from January to September 2006
Each population's characteristics: households (residential classification) and people who were staying there during the sampling period, generating residential SW.
A sample was taken in each stratum using a bi-stage conglomerate probability model, with reasoning estimates. A conglomerate is the BS in this model and a number of households proportional to total BS was randomly selected from this (Klinger et al., 2009).
The variable object of study used for estimating sample size was per-capita production (PCP) associated with household j from side i of stratum h, represented as Yhij. The sampling plan was aimed at estimating the average amount of SW per person per day Y ̿, in the city. Each estimate carried out on each of the six socioeconomic strata had to be weighted according to each stratum's side proportion and households. Equation (1) shows the general expression used in estimating PCP.
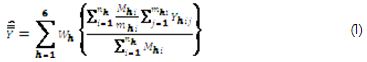
In equation (1), Wh represented weighting due to strata h; Mhi was the number of total households from side i of strata h; mhi was the number of households sampled from side I of strata h and nh was the number of sampled sides in stratum h. The defined estimator in equation (1) for determining PCP was used for estimations having 5% absolute error of average PCP and overall 95% confidence level which, in turn, determined sample size.
A 58-BS pilot sampling campaign had to be mounted in the six socioeconomic strata due to a lack of reliable information about parameters of interest in previous works, in particular about dispersion. The pilot sample size was established according to funds available and included all strata, allowing field work logistics to be improved. A final 214 BS sample size was obtained considering a 5% error for average pilot overall PCP and a 95% confidence level.
Developing the sampling programme and SW characterisation
This phase included selecting the BS to be sampled, their acknowledgment, household selection, awareness-raising activities for encouraging citizen participation and taking, weighing and sampling/processing data.
Selecting the BS to be sampled: the sample was randomly and systematically selected.
Block side acknowledgement visits: these visits were used for identifying such aspects as location, total number of households in the BS, number of inhabited houses, type of buildings or establishments, places for SW location or storage and access facilities.
Selecting households per side: a number of households proportional to the total side were randomly and systematically selected in each BS, seeking at least five households in all cases. Calculations were based on the average of households per side by socioeconomic stratum; this average was obtained from field visits. A room space of at least three households was established to control no answer situations.
Project presentation and awareness-raising; a social science graduate visited each household to be sampled, delivering a project presentation letter. This activity allowed corroborating the viability of including each selected household in the study, o its replacement to maintain BS representativeness.
Test sample (TS): once the availability of users to participate had been corroborated, previously-trained undergraduate students made a visit to familiarise residents with how the samples would be collected and delivered; a plastic bag was thus given to them. This sample was called "test sample."
Follow-up visits and sample collection: the use of the sample bag given during the first visit was verified during a second visit and, in some cases, adjustments were made to the first sample collection (change of household, supplying additional bags, timing and place of delivery of the sample). The test sample was not processed.
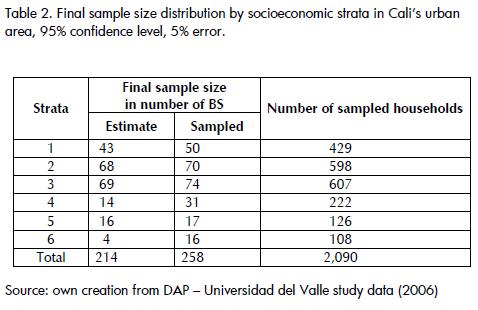
During this visit, bags were delivered for collection of the first sample to be processed. The bag corresponding to the first sample was picked up during a third visit and the bag corresponding to the second sample to be processed was delivered. The second sample was picked up during the fourth and last visit. The samples were collected prior to the local solid waste vehicle passing. Follow-up visits were made and samples collected to coincide with the collection days established for each BS by the local solid waste company, ensuring that the people did not deliver the samples to the company. Table 2 shows the distribution of estimated BS, sampled by socioeconomic strata and includes the number of households sampled.
SW sample processing: after collecting the samples from each household, they were identified and weighed. A sample collection form was filled in for the information obtained about SW management; data regarding the weight of the bags containing SW and the number of people who produced the sample during the respective period were recorded. Afterwards, the samples were transported to a suitably conditioned place for determining physical composition. This activity was carried out by BS, integrating all the samples collected in the same BS. There were no divisions by quartiles as the amount of SW per BS allowed total processing. The classification scheme adopted corresponded to that established in RAS 2000, adding to the Hygienic Waste category which includes diapers, sanitary towels, toilet tissue paper, prophylactics, etc.
Results and Discussion
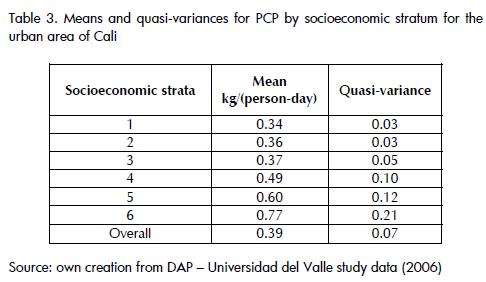
Table 3 shows the sampling quasi-variance of PCP for each stratum and for the total urban area of Cali. The 0.39 kg/(person-day) overall mean value for the city was lower than the average reported for Colombia by the Pan-American Health Organisation (PAHO, 2005) and that reported for the city in previous studies carried out by EMSIRVA ESP in 1996. Likewise, the overall PCP was lower than the minimum suggested by RAS 2000 for SW predesigned management systems (0.44 kg/(person-day)). This situation may be attributed to the fact that this project only referred to residential waste. However, it may also have been due to some modifications in consumption standards or in people's socioeconomic conditions. Another possibility could have been that the variations found occurred because of methodological differences in relevant technical aspects such as determining sample selection procedure and sample size.
Implementing the pilot sampling, besides facilitating fieldwork methodology refinement, contributed towards quantifying the absolute error assumed for overall PCP estimation, as well as in-stratum approximated variability. This data was used for computing final sample size. This procedure helped to avoid selection bias and also allowed getting a statistically rigorous determination of the final sample size. The selected sample size represented 0.7% of the city's total BS, equivalent to 0.4% of households, this being a significantly lesser number compared to that suggested by Nordest (1995) or that used by Ojeda-Benitez for Mexicali (Ojeda-Benitez et al., 2003). The main implication was a dramatic cost reduction, this being one of the main drawbacks in executing this type of project in developing countries, as pointed out by Hristovski (2007). Furthermore, two-stage sampling is appropriate for locally-available sampling frames, as may be the case in many other places and similar studies. In fact, house agglomerations can be identified in all large cities (blocks, suburbs, communes, districts, sectors, etc.), which would help to reduce sampling costs by easily ensuring sampling coverage. This happens because of the study units' grouping (houses, homes, etc.).
PCP by socioeconomic strata presented a similar pattern to that reported for Santiago de Chile by CONAMA and UCV (2006) regarding increases for this parameter as socioeconomic stratum grew. The PCP value obtained for the lowest stratum in that city (0.67 kg/(person-day)) was only exceeded by Cali's highest strata. It was also seen that the higher the stratum, the higher the data dispersion. In fact, for the lowest stratum there did not seem to be a significant difference in data variability, which may have indicated some type of homogeneity in these populations' behaviour patterns.
Table 4 shows the relative distribution of residential SW physical composition, organised by socioeconomic strata. It also shows the overall composition for the whole city. As reported by UNEP & Calrecovery Inc. (2005) for developing countries, organic waste predominated in SW composition in Cali. Food waste predominated in all socioeconomic strata and, although the study did not contemplate differentiation of this category into raw and processed food waste, significant amounts of the latter were observed in all cases, thereby justifying waste reduction awareness-raising campaigns. The differentiation of processed food SW category is important because, as pointed out by Marmolejo (Marmolejo et al., 2009), its composition is a conditioning factor for some technologies' application such as compost, which is the main application for municipal SW recovery in Colombia (SSPD, 2008).
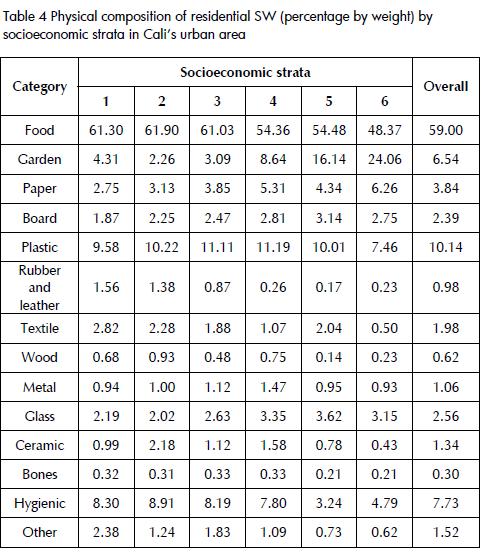
Just as important is the hygienic waste category which makes up the third relative category in generated SW (although not currently included in the classification scheme proposed by RAS 2000); it represented more than 3% in each socioeconomic strata. The study carried out by CONAMA & UCV (2006) in Santiago de Chile showed that diapers and sanitary cellulose accounted for 4.95% of the total. Given the amounts and characteristics of this type of waste, optional applications for reducing SW generation should be studied, as is the case of reusable diapers as experienced in Austria and the United Kingdom (Salhofer et al., 2008). Furthermore, bearing in mind the impact of hygienic waste on other wastes regarding recovery options, treatment and final disposal, separation at source should be stimulated. Likewise, it is recommended that this category should be included in the national classification scheme.
Potentially usable material like paper, board, plastic, glass and metal makes up 19.99% of total generated waste. Assuming that the city population's (estimated to be 2,075,380 people, according to the 2005 Colombian census) would generate the estimated PCP (0.39 kg/(person-day), the total generation of residential waste would reach 809.4 metric tons per day. It means that 161.1 metric tons per day would correspond to said materials, representing a potentially significant amount to be used by the production sector. In this respect, the Ministerio de Ambiente, Vivienda y Desarrollo Territorial MAVDT (2007) has pointed out that these materials have an established market in Colombia, having expansion possibilities.
Garden waste represented significant proportions of generated waste in strata 5 and 6 which was associated with the existence of residential green areas and gardens. This waste should be chemically characterised and its potential use in recovery options such as compost should b verified based on the analysis presented here.
Conclusions and recommendations
The overall estimate of residential SW PCP in Cali (0.39 kg/(person-day)) was less than that reported for Colombia and other Latin-American countries.
The occurrence of significant amounts of processed food in the SW suggested the need for designing and developing new action for stimulating reduction of SW at source.
Hygienic waste constitutes the third category of residentially-generated SW. Options aimed at reducing its production should thus be gone into in depth to guarantee adequate handling and disposal at source. Likewise, this category should be included in the national classification scheme.
Including the "testing sample", besides familiarising residents with how the samples should have been prepared and delivered, allowed materials accumulated in residences over long periods of time to be collected. In the absence of such testing sample, such material overweight may have introduced an error into the estimates, due to measuring bias. Although characterisation techniques have some degree of universality, this project showed the convenience of local characterisation based on locally-available sampling frames. It should lead to the proper choice of sampling methods and sampling sizes.
The available sampling frame for this project made it necessary to use a weighted two-stage sampling plan, designed for ratio estimators. Similar sampling frames may very likely be found in other cities given the administrative and fiscal use for these types of frames. It guarantees the quality of the information regarding houses and allows one to visualise the sampling strategy used for potential generalisations being made.
The sampling plan used here was chosen for being the one that best fit the local sampling plan at hand, allowing houses to be selected without bias. The reason for this was that the BS on the local sampling frame were permanently updated and the BS were made up of houses.
Acknowledgments
The authors wish to express their appreciation to the Departamento Administrativo de Planeación de Cali and the Universidad del Valle, these being institutions which financed this research project. They would also like to thank the many Universidad del Valle graduates and students, community leaders, recyclers and municipality officers who participated in the sampling and characterisation journeys. Special recognition should go to the referees whose comments have greatly improved the manuscript.
CONAMA RM (Comisión Nacional del Medio Ambiente Región Metropolitana), UCV (Pontificia Universidad Católica de Valparaíso), Estudio caracterización de residuos sólidos en la región metropolitana., 2006. [ Links ]
Congreso de Colombia, Law 142/11 July 1994 (establishing the domiciliary public services regime and other dispositions). [ Links ]
DAP (Departamento Administrativo de Planeación Municipal de Cali), Universidad del Valle., Diagnóstico de la composición y caracterización de los residuos sólidos residenciales generados en el municipio de Santiago de Cali., Informe final, 2006, pp. 76. [ Links ]
Diaz, L. F., Eggerth, G.M., Golueke C.G., The role of composting in the management of solid wastes in Economically Developing Countries. In: Appropriate Environmental and solid waste management and technologies for Developing Countries., en ISWA 2002 Conference, Vol. 2, pp 1353- 1362. [ Links ]
EMSIRVA (Empresa de Servicios Varios Municipales de Cali), Caracterización de los residuos sólidos residenciales de la ciudad de Cali., 1996, pp. 103. [ Links ]
Hrivstosky, K., Olson, L., Hild, N., Peterson, D., Burge, S., The municipal solid waste system and solid waste characterisation at the municipality of Veles, Macedonia., Waste Management, Vol. 27, 2007, pp. 1680-1689. [ Links ]
Klinger, R.A., Olaya, J., Marmolejo, L., Madera, C., Plan de muestreo para la cuantificación de residuos sólidos residenciales generados en las zonas urbanas de ciudades de tamaño intermedio., Revista Facultad de Ingeniería Universidad de Antioquia, No. 48, Jun., 2009, pp. 76-86. [ Links ]
Marmolejo, L.F., Torres, P., Oviedo, E.R., Bedoya, D.F., Amezquita, C., Klinger, R., Albán, F.; Diaz, L.F., Flujo de residuos. Elemento base para la sostenibilidad del aprovechamiento de residuos sólidos municipales., Ingeniería y Competitividad, Vol. 11, No. 2, Dic. 2009, pp. 79–93. [ Links ]
Minambiente (Ministerio del Medio Ambiente República de Colombia)., Política para la Gestión Integral de Residuos., 1998, pp. 47. [ Links ]
Minambiente (Ministerio del Medio Ambiente República de Colombia)., Guía para selección de tecnologías de manejo integral de residuos sólidos., 2002, pp. 183. [ Links ]
Mindesarrollo (Ministerio de Desarrollo Económico República de Colombia)., Reglamento Técnico del sector agua potable y saneamiento básico RAS 2000., Sección II., Título F., Sistemas de aseo urbano., Bogotá D.C., 2000. [ Links ]
MAVDT (Ministerio de Ambiente, Vivienda y Desarrollo Territorial). (2007)., Gobierno crea Mesa Nacional de Reciclaje., Noticias Mayo 02 de 2007., Available in: http://www.minambiente.gov.co/contenido/contenido.aspx?catID=433&conID=761 [ Links ]
Nordtest, Solid waste, municipal: Sampling and characterisation Nordtest method NT ENVIR 001, Finland., Available in: http://www.nordicinnovation.net/nordtestfiler/envir001.pdf [ Links ]
Ojeda-Benitez, S, Armijo de Vega, C, Ramírez-Barreto, M.E., Characterisation and quantification of household solid wastes in a Mexican city, Resources, Conservation & Recycling., Vol. 39, 2003, pp. 211-222. [ Links ]
OPS (Organización Panamericana de la Salud)., Informe de la Evaluación Regional de los Servicios de Manejo de Residuos Sólidos en América Latina y el Caribe., Washington. D.C., 2005, pp. 128. [ Links ]
Salhofer S., Obersteiner G., Felicitas S., Lebersorger S., Potentials for the prevention of municipal solid waste., Waste Management, 2008, Vol. 28, pp. 245- 249. [ Links ]
SSPD (Superintendencia de Servicios Públicos Domiciliarios), Diagnóstico sectorial plantas de aprovechamiento de residuos sólidos., República de Colombia, 2008. [ Links ]
UNEP (United Nations Environment Programme), CalRecovery Incorporated., Solid Waste Management., United Nations Environment Programme., 2005, pp. 524. [ Links ]

