


Services on Demand
Journal
Article
 English (pdf)
 Article in xml format
 Article references
 Send this article by e-mail
Indicators
-
 Cited by SciELO
 -
 Access statistics
Related links
-
 Cited by Google
 -
 Similars in
SciELO
Similars in
SciELO -
 Similars in Google
Share

 Permalink
Ingeniería e Investigación
Print version ISSN 0120-5609
Ing. Investig. vol.31 suppl.2 Bogotá Oct. 2011
Estimation of voltage sags patterns with k-means algorithm and clustering of fault zones in high and medium voltage grids
Estimación de patrones de hundimientos en tensión con el algoritmo k-means y agrupación de zonas de falla en redes de alta y media tensión
Miguel Romero1, Luis Gallego2 and Andrés Pavas3
1 Electrical Engineer and MSc. in electrical engineering, PhD student in National university of Colombia. Research assistant in the Research group-PAAS-UN. mfromerol@unal.edu.co
2 Electrical Engineer, MSc and PhD in electrical engineering, National university of Colombia. Researcher in the Research group- PAAS-UN. Associate professor, National University of Colombia. lgallegov@unal.edu.co.
3 Electrical Engineer and MSc in National University of Colombia. Candidate to PhD degree in the same institution. Researcher in the Research group- PAAS-UN. Associate professor, National University of Colombia. fapavasm@bt.unal.edu.co
ABSTRACT
This paper proposes k-means clustering algorithm to identify voltage sags patterns and group fault zones with similar impact in high and medium voltage electric. The proposed methodology comprises three stages. First, network modeling and faults simulation were performed in order to get information about voltage sags caused by faults in the transmission system. Voltage sags patterns were identified at the second stage by means of a k-means clustering algorithm, allowing the determination of fault zones. Using the power quality measurements data base of the major electricity utility of Bogotá, voltage sags were classified according to the previously determined voltage sags patterns. At the third stage of the methodology a comparison between simulated and measured sags is performed, allowing the identification of sags caused by faults.Keywords: Sags classification, patterns voltage sags, K-means algorithm.
RESUMEN
En este artículo se propone el uso del algoritmo K-means para identificar patrones de hundimientos en tensión y agrupar zonas de falla con impacto similar en redes de alta y media tensión. La metodología propuesta comprende tres etapas. Primero, se realiza un modelo de la red de transmisión y distribución y se simula un barrido de todo tipo de fallas, obteniendo información sobre los hundimientos en tensión. En segundo lugar, se identifican patrones de hundimientos en tensión usando el algoritmo k-means y se determinan diferentes zonas de falla para cada uno de los patrones. Finalmente, se usan los patrones encontrados para clasificar información real de hundimientos en tensión registrados en Bogotá y se establecen las zonas de falla para grupos de hundimientos en tensión.Palabras Clave: Clasificación de hundimientos en tensión, patrones de hundimientos en tensión, algoritmo k-means.
1. Introduction
Power quality (PQ) assessment is really important for utilities and users for identifying some critical areas in their systems and apply corrective actions to improve the PQ conditions (Bollen,2003). The identification of transitory disturbances such as voltage sags and swells requires continuous measurement of PQ and techniques for analysis of large amount of information. According to above, some methodologies for detection and classification of disturbances are proposed on (Biswal et al, 2009; Mokhlis et al, 2009; Romero et al, 2010).
On the other hand, power quality measurement and assessment has taken relevance since the publication of the CREG Resolution 024 in 2005 in Colombia (CREG 024, 2005). The resolution demands the realization of power quality measurements on bus bars with voltage levels greater than 1kV have to be performed. In Bogotá city 290 power quality measuring devices were installed on the above mentioned bus bars of the distribution system, which record disturbances like voltage sags, swells, unbalance and flicker, among others according to standard IEC 61000-4-30 (IEC 61000-4-30, 2009). That information is sent to a control center, processed and subsequently reported to the regulatory body CREG (PAAS-UN, 2009). This institution will establish the limits for voltage sags from these reports in the near future. The network operators are interested on assessing voltage sags to determine their cause, with the aim of exploring suitable solutions and establish responsibilities between customers and network operators (Cajamarca et al, 2006).
According to above, this paper proposes a methodology that consists of four stages:
- Network modeling. Network distribution system in 115kV and 220kV of the all Colombian system is modeled using symmetrical components. This model is made in order to simulate all possible faults. On this model, any possible localization of faults is simulated as well.
- Fault simulation. Different types of faults on several locations are performed. Information of voltage sags in the whole electric system of Bogotá is obtained for every
- simulated fault.
- Identification of voltage sags patterns. Voltage sags information is analyzed by means of principal components analysis, afterwards patterns of voltage sags are identified using the k-means algorithm. The results are clusters of voltage sags with a respective occurrence zone.
- Classification of real voltage sags. Real voltage sags recorded in Bogotá from 2008 to 2010 are classified resorting to the previously determined clusters. Finally, zones where real faults occur and cause voltage sags in Bogotá are determined.
2. Networking modeling
In order to simulate faults on the distribution system and find the relationship between voltage sags and faults, a symmetrical components model is developed. Network distribution system in 115kV and 220kV of the entire Colombian system (756 bus bars) is modeled in symmetrical components in order to get all possible localization of faults in the Bogotá's electric network (Romero, 2010). This model consists of positive, negative and zero sequence matrix.
The interested zone is defined like the zone in the Colombian distribution system where voltage sags occurred by faults are evaluated. In this case, interested zone consist on the bus bars of the distribution system on Bogotá city closed on gray contour in Fig. 1.
Not all faults in the Colombian distribution system cause voltage sags in Bogotá, therefore a disturbing zone is identified like the zone where the occurring faults can cause voltage sags on the bus bars of a specific zone. In order to identify the disturbing zone, a new matrix Voltage sags matrix is calculated from the symmetrical components matrices. This matrix has information about voltage of all bus bars when fault occurs on every bus, as described in (Goswami et al, 2008).
To calculate the matrix of sags caused by three-phase faults, the equation for theoretical faults in (Anderson, 1973) is used:
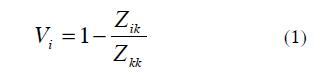
Where:
- Vi: Voltage on bus bar i when fault occurs on bus bar k.
- Zik: Mutual impedance between i and k bus bars.
- Zkk: Self impedance in k bus bar.
From (1), the matrix of sags is calculated as follow:
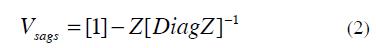
Where:
- Vsags: Matrix of voltage sags on all buses when faults occur on every bus bar.
- Z: Positive sequence impedance matrix.
The term [DiagZ] of the equation is a matrix calculated from the diagonal of the positive sequence impedance matrix Z. For unsymmetrical faults (single, dual-phase and dual-phase to ground) a similar procedure is performed, as explained in detail in (Romero et al, 2010).
The sags matrix is modified by removing the bus bars in which faults occur but do not cause voltage sags, especially at the set of bus bars of interest. The result of this procedure determines which bus bars of the Colombian system are in the disturbing zone. In the case of this paper, the zone of interest is Bogotá (gray zone), the disturbing zone are all bus bars in Fig. 1, including the bus bars in the gray zone. That shows that many voltage sags observed in the Bogotá's system may be caused by faults inside the city or by faults located in the nearby parts of Colombian system.
3. Fault simulation
To determine the voltage sags profile in every bus inside the zone of interest, simulations of faults in all bus bars and sections lines of the disturbing zone are performed. For this, in every 10% of line different types of faults (single, dual and three phase fault) are simulated in the disturbing zone. The simulation procedure is described in the following:
1. A vector with information regarding faults occurring on lines is generated (L), containing percentage of line (%T), type of fault (Tf) and impedance of line (Z).
2. Symmetrical components matrices are modified by removing the failed line between nodes A and B.
3. Impedance (Z) of faulted line is split into two (Z1$ and Z2) according to (%T).
4. Z1 is added to node A of matrices sequence generating a fictitious node C.
5. Z2 is added between the fictitious node C and node B of the sequence matrices.
6. Depending on the type of fault (Tf) voltages of all nodes are calculated when fault occur in fictitious node C.
7. The angles of voltages in symmetrical components are modified due transformer connections.
8. Values of voltage in symmetrical components are transformed to values of voltage in phase components.
The location of faults and voltage values obtained in each bus in the area of interest can be organized in two arrays: cause and effect, as shown in Table 1.
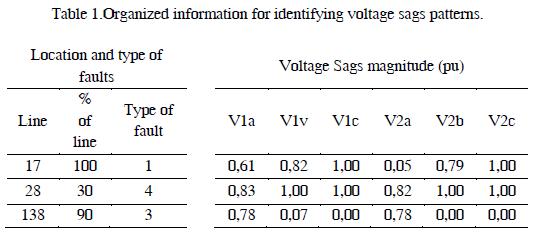
In the next section, simulated voltage sags are grouped according to the pattern identification. Because of the causal relationship between simulated faults and voltage sags, different obtained clusters are an indirect classification of faults. That is, faults that occur in different parts in the system and generate similar profiles of voltage sags are grouped in the same cluster.
4. Detection of voltage sags patterns by means of k-means algorithm
With the voltage sags information caused by faults, patterns of voltage sags are identified and grouped. Then, the relationship between the location of faults and the occurrence of such patterns is determined.
K-means algorithm is a tool to put observations into different clusters according to the level of similarity (Queipo, 2001; Ramos, 2009). Some advantages of k-means algorithm for clustering data were identified in previous works (Mora et al, 2009); (Camargo et al, 2009). An example of that algorithm is shown in Fig. 2, where observations on two dimensions (X,Y) are grouped on three different clusters.
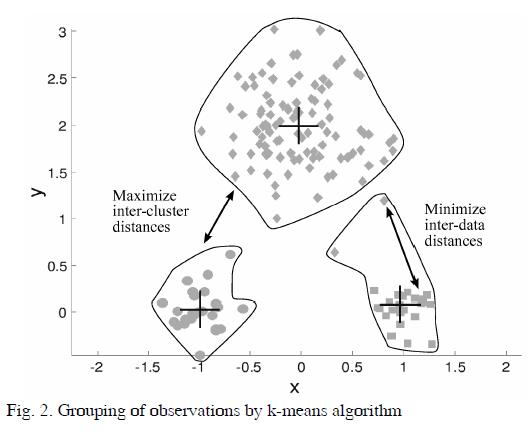
Fig. 2 shows the performance of k-means method, however axes units have not a quantitative or physic meaning.
K-means algorithm consists of the follows steps:
1. An initial k value of clusters is defined,
2. k centroids (+) are located randomly on the sample space,
3. distances between observations and centroids are calculated,
4. each observation is assigned to the nearest centroid,
5. the position of centroids is update to the average of the observations assigned to each centroid,
6. Several iterations are performed from step 2 in order to minimize the distance between observations and centroids.
In this case k-means algorithm is implemented to identify voltage sags patterns in matrices of Table I. In voltage sags matrix (144 x 6355) every row belong to an observation in the time of 144 voltage values (3 phases of 48 bus bars). For applying k-means algorithm to voltage sags matrix some limitations about the algorithm and high dimensionality of the matrix are evaluated:
The k-means algorithm has some important limitations:
- Iterative algorithms of classification like k-means are deficient for problems on a large scale.
- K-means algorithm needs a lot of time to optimize the clustering process.
- Because of high dimensionality of the matrix, the possible initial locations of centroids increase exponentially, so likelihood to stop in a local maximum increases correspondingly.
The utilization of the above mentioned algorithm has also limitation regarding to the high dimensionality of the voltage sags matrix:
- Matrix can have redundant information in the 144 variables.
- Matrix can have irrelevant information without capacity of discrimination in clusters.
- Matrix can have segmented information, its means useful information can be distributed on several variables.
According to these undesired characteristics, reducing dimensionality of voltage sags matrix is necessary before patterns are identified. For this purpose, principal components analysis is implemented in the next section.
A. Principal Components Analysis
The utilization of principal components analysis (PCA) is proposed to reduce the dimensionality of the voltage sags matrix. In this analysis, the information of n observations and p dimensions are represented with r<p dimensions. The new dimensions are lineal combinations (non correlated) of the initial ones (Meléndez et al, 2007).
An example of the principal components analysis (PCA) is shown in Fig. 3. In that case, the aim is reduce the dimensionality (p=2) of the observations4.
In Fig. 3 the aim is to find a sub-space with dimension smaller than p, such that by projecting each observation, this retains their structure with the least distortion as possible.
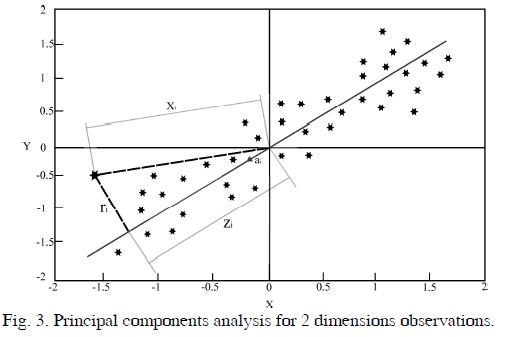
The subspace with dimension smaller is represented by a line which has the following condition:
The sum of the distances between the original observations and their projections onto the line should be as short as possible.
To explain the above, the projection of the observation Xi on the direction a1 in Fig. 3 is the scalar:
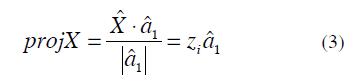
The vector zia1 represents the projection of Xi onto the line and ri represents the distant between Xi and the line. Then the purpose is to minimize the square of the sum of the distances
ri:
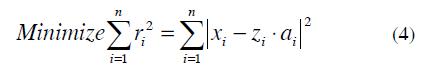
In Fig. 3 the projection of each observation onto line forms a triangle. By the Pythagorean Theorem, next equations are deduced:
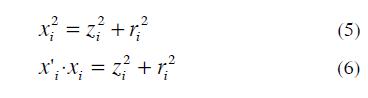
by the sum of all observations i=1 ... n
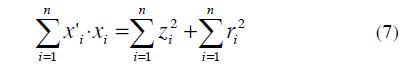
The first term of Eq. (9) is constant, thus minimize  is equivalent to maximize
  , which means maximizing the sum of the square of the projections. At the same time, it is equivalent to maximize the variance (Peña, 2002).
According to the above, the best line to represent the observations in a single dimension is one in which maximize the variances of the data. This criteria is extended to n-dimensional space, where n<p.
In order to find the main components of a voltage sags matrix from the covariance matrices, the Matlab function princomp is used. The result of this function is a matrix with 144 uncorrelated variables organized in a way that the first variables have the greatest variance. It means that first variables have the most information from the initial matrix.
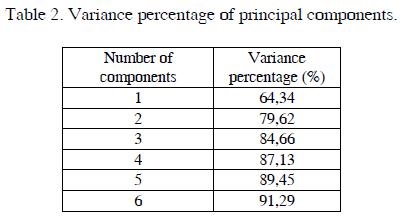
The Table II shows the percentage of variance according to the number of principal components. The first five principal components represent the 89.4% of the variance of the original data, it means nearly 90% of the total information. Finally, these five components are selected, so the initial matrix (6355 x 144) is reduced to its main components (6355x5) for applying k-means algorithm.
B. Clustering of voltage sags and fault zones for each cluster
The next step is to determine the optimal number of clusters for grouping the observations of voltage sags (Davies and Bouldin, 1979). For this purpose, some indexes are calculated for each value k of clusters, then the best value of the indicator shows the optimal number of clusters to group the information. For this case three different indicators are used and results are shown below.
1. Index 1. Square of the sum of the distances between observations and centroids. (Optimal result k=10). This index shows the variation of the sum of the distances between the data from each of the clusters and their centroids.
2. Index 2. Silhouette index. (Optimal result k=20, 55 y 85). In this index a value between -1 and 1 is assigned to each observation, which measures the similarity of the data in the same cluster and compares it with the similarity of data from other clusters. The closer the index to 1, the better the data are grouped together.
3. Index 3. Relationship inter-intra cluster distances. (Optimal result k=60). This index estimates the proportion between the average distance of the data to the respective centroids and the minimum distance between centroids.
The results of the proposed indicators obtain different k value for an optimal clustering. This implies the observations of voltage sags are not naturally grouped, it means there are not clearly differentiated clusters.
Given that the results of the indicators were inconclusive, it is possible to group the observations in an appropriate number k of clusters defined by the goal of the grouping. Therefore the goal of grouping is defined as follow:
Clustering of voltage sags represents an indirect faults classification (location and type) according to their impact (sags profile).
Thus, the number of clusters is related to the size of the zones where faults occur and cause similar profiles of voltages sags. Therefore, few number of clusters means few very big zones and is not possible to discriminate the place of occurrence of faults with different impact on bus bars. On the other hand, a lot number of clusters means very small zones and the classification is inefficient. After trying various amounts of clusters, the size of the resulting zones was evaluated for different number of clusters, finally 50 clusters are selected. With this number of clusters size of zones is considered appropriate. By applying k-means to the principal components obtained above, a vector C(6355 x 1) is obtained and it indicates which of the 50 clusters are classified each observation of matrix voltage sags and matrix faults.
By grouping the locations of faults by the vector C, zones in which faults have similar impact are determined. In Fig. 4 the location of faults that generate voltage sags with similar impact classified in cluster 48 is identified (gray zone).
Similarly, by grouping the types of simulated faults by the vector C types of faults of each cluster are determined.
5. Classification of real voltage sags ocurred on Bogotá.
Clustering of simulated voltage sags is now used as a classifier for real voltage sags occurring in the 115kV bus bars of Bogotá city. For this, the recorded information of voltage sags in each of the bus bars between January 2008 and December 2009 is processed in a centralized database.
For obtaining a matrix of N observations x 144 variables, the voltage sags information is processed taking into account the following assumptions:
- Voltage sags that occur within a time window of 1 minute are caused by the same event5. Several voltage sags in the same window in the same bus are caused by the same event.
- If voltage sags are not recorded in a bus in a time window, then voltage sags does not occur for the same time window.
On the other hand, according to the simulations, faults in the 115kV and 220kV transmission system not cause voltage sags only in one bus, or voltage sags in bus bars insulated from each other, so that information is excluded.
As a result, from 7580 measured voltage sags in all 115kV bus bars of Bogotá caused by 1955 events, 3509 voltage sags are filtered and they are attributable to 360 faults in the transmission and distribution system. It means a real information matrix with (360 x 144) dimensions.
The information of voltage sags attributable to faults in the transmission and distribution system is classified with the centroids of each cluster found in the previous section as follows:
1. Distances between the 50 centroids and every real observation of 144 dimensions are calculated,
2. observations are assigned to the nearest centroid.
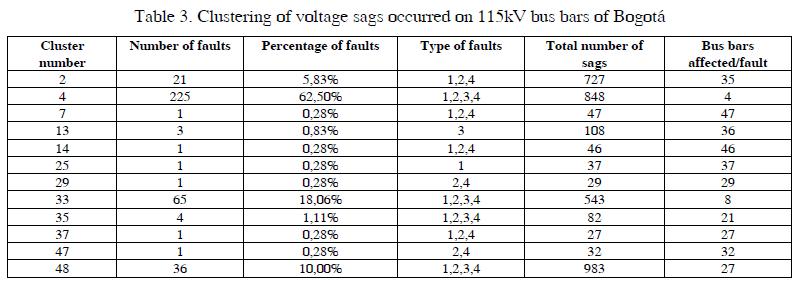
The final result of the classification is shown in Table III, which can be analyzed as follows:
Figs. 5 and 6 display disturbing zones for clusters 4 and 33;where more number of faults occurred, and caused voltage;sags in the city of Bogotá.- 360 events attributed to faults are classified into 12 different clusters, cluster 4 is the one with more events (225).
- For clusters 4, 33, 35 and 48 do not have evidence of the type of fault occurs.
- Faults that produce more voltage sags are grouped into clusters 48, 4 and 2 with 986, 848 and 727 voltage sags respectively.
- Faults in clusters 2, 7, 14 and 37 are not three-phase faults.
- Faults in clusters 29 and 47 are two-phase or two-phase to ground.
- Faults in Clusters 7 and 14 occur few times but their impact on the bus bars is the highest with 47 and 46 bus bars affected by fault respectively.
- Faults in cluster 4 occur frequently, buy they have the least impact with only 4 bus bars affected by fault.
6. Conclusions
This paper proposed a methodology for estimating patterns of simulated voltage sags by means of k-means algorithm and for determining the location of the faults that cause voltage sags in distribution bus bars of the system. The Colombian system was modeled and fault simulation was performed in all sections of the system to generate voltage sags. Subsequently simulated voltage sags were clustered using principal components analysis and k-means algorithm, allowing the identification of zones of faults occurrence for each cluster. Voltage sags clusters were used to classify real voltage sags occurred in the system. The methodology was applied to the 115kV and 220kV system of Bogotá and real areas where faults occur and caused voltage sags in Bogotá were identified.
7. Acknowledgment
The authors would like to thank CODENSA, COLCIENCIAS and the Universidad Nacional de Colombia for providing financial support for the development of this research project.
NOTAS AL PIE
4 An example of principal components analysis is illustrated in Fig 3, however axes units have not a quantitative or physic meaning
5 This is because the data records do not have a better resolution to provide a smaller time window size.
8. References
Anderson P. Analysis of faulted power systems. IEEE Press Series on Power Engineering. Paul M. Anderson series Editor 1973. [ Links ]
Biswal, B., Dash, P.K., Panigrahi, B.K, Power Quality Disturbance Classification Using Fuzzy C-Means Algorithm and Adaptive Particle Swarm Optimization, Industrial Electronics, IEEE Transactions on vol.56, no.1, pp.212-220, Jan. 2009. [ Links ]
Bollen, M., Understanding Power Quality Problems Voltage sags and interruptions. IEEE Press. 2003. [ Links ]
Cajamarca., Torres., Pavas., Urrutia., Gallego. and Delgadillo., Impact Assessment of Power Quality Limits in Colombia: a Regulatory Approach. IEEE Latin América Transm. and Distrib. Conference. Caracas (Venezuela). 2006. [ Links ]
Camargo, M.; Jimenez, D. and Gallego, L.; , Using of Data Mining and Soft Computing Techniques for Modeling Bidding Prices in Power Markets, Intelligent System Applications to Power Systems, 2009. ISAP '09. 15th International Conference on, vol., no., pp.1-6, 8-12 Nov. 2009 [ Links ]
CREG, Comisión Reguladora de Energía y Gas. Resolución CREG 024 abril 26 de 2005. Modificación de las normas de calidad de la potencia eléctrica aplicables a los servicios de Distribución de Energía Eléctrica. 2005. [ Links ]
Davies D and Bouldin D, A cluster separation measure. IEEE Transaction on pattern analysis and machine intelligence vol 1. 1979. [ Links ]
Goswami, A.K., Gupta, C.P., Singh, G.K. Area of vulnerability for prediction of voltage sags an analytical method in Indian distribution systems. Dept. of Electr. Eng., Indian Inst. of Technol., Roorkee. India Conference, 2008. INDICON 2008. Annual IEEE. [ Links ]
IEC, International Electrotechnical Commission, IEC. P-IEC 61000-4-30 Electromagnetic compatibility (EMC) - Part 4-30: Testing and measurement techniques, Power quality measurement methods. 2009. [ Links ]
Meléndez, J. Berjaga, X. Herraiz, S. Sánchez, S. Castro, M. Classification of voltage sags based on k-NN in the principal component space. Institut d Informatica i Aplicacions eXiT., Universitat de Girona (Spain) 2007. [ Links ]
Mokhlis, H., Khalid, A.R., Li, H.Y., Voltage sags pattern recognition technique for fault section identification in distribution networks, PowerTech, 2009 IEEE Bucharest, vol., no., pp.1-6, June 28 2009-July 2 2009. [ Links ]
Mora-Florez, J. Cormane-Angarita, G. Ordonez-Plata, K-means algorithm and mixture distributions for locating faults in power systems, Electric Power Systems Research, Volume 79, Issue 5, May 2009, Pages 714-721. [ Links ]
PAAS-UN., Innovación tecnológica en identificación y medición de clusters de calidad de potencia para Bogota. Proyecto de Investigación financiado por COLCIENCIAS, CODENSA S.A. E.S.P. y la Universidad Nacional de Colombia. 2009. [ Links ]
Peña, D., Análisis de datos multivariantes. Mc Graw Hill, Universidad Carlos III de Madrid, 2002. [ Links ]
Queipo, N. Pintos, S. Fundamentos de data mining y sus aplicaciones. Clasificación no supervisada, 2001. Publicación en diapositivas ppt link: http://www.ica.luz.ve/dfinol/ME/ME6.ppt [ Links ]
Ramos A. Análisis conjunto. Curso de doctorado, tutorial, 2009, Material en Diapositivas. Link: http://www.slidefinder.net/s/spss\_tutorial\_ángel\_ra\newlinemos\_domínguez/80590354 [ Links ]
Romero, M., Pavas, A., Cajamarca, G., Gallego, L., A new methodology for the comparative analysis of sags among substations in a distribution network in Colombia, Harmonics and Quality of Power (ICHQP), 14th International Conference on , vol., no., pp.1-8, 26-29 Sept. 2010 [ Links ]
Romero, Miguel F. Diseño de una metodología para el análisis de sags de tensión en redes de distribución. Universidad Nacional de Colombia. Maestría en ingeniería eléctrica. Tesis de grado 2010. [ Links ]

