


 English (pdf)
 Article in xml format
 Article references
 Send this article by e-mail
 Cited by SciELO
  Cited by Google
  Similars in
SciELO
Similars in
SciELO  Similars in Google
 Permalink
Introduction
Landslides are complex natural processes that constitute a serious natural hazard in mountainous countries (Malamud et al., 2004). This term includes a wide variety of slope movements, such as soil landslides, deep landslides, mud flows, debris flows, and falling rocks, among others (Cruden et al., 1996). Inventories of landslides are the simplest form of landslide mapping (Guzzetti et al., 2000). An inventory map registers the type and position of mass movements, leaving discernible signs in the landscape.
In order to obtain quantitative risk maps, the first essential step is to make a quantitative assessment of the threat, mainly focusing on determining susceptibility, which is a spatial probability indicator and can be obtained by different analytical approaches. The statistical evaluation of this threat has become a widely applicable method using Geographic Information Systems. This method requires an inventory map for landslides, used in combination with a series of environmental factors, assuming that mass movements are likely to happen under the same conditions as in recent past events (van Westen et al. , 2006).
There are many quantitative and qualitative techniques to analyze the relationships between conditioning parameters and landslides. The most common statistical models used for threat analysis include logistic regression, hierarchical analytical processes and frequency of relationships (Shahabi et al. , 2014).
Multiple logistic regression evaluates the multivariate regression relationships between a dependent and several independent variables. The advantage of logistic regression is that variables can be continuous or discrete, or a combination of both types (not necessarily normal), by adding a proper relational function to the usual linear regression model (Lee et al. , 2001). A logistic regression algorithm applies maximum reliability in estimation after transforming the dependent variable into a logit variable (the natural log of the odds of the dependent variable occurring or not occurring). Thus, logistic regression estimates the probability that a certain event will occur (Dai et al., 2002).
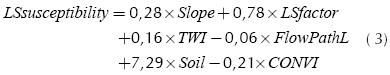
In this study on landslide susceptibility mapping, the aim of the linear regression was to find the best setup model to describe the relationship between the presence or absence of landslides (dependent variable) and a set of independent parameters such as slope, aspect and lithology. The independent variables in this model were predictors of the dependent variable and can be measured on a nominal, ordinal, range or relational scale. The model used for the logistic regression analysis is given by Equations (1) and (2).
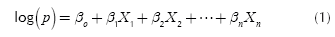
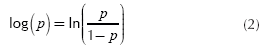
Where p is the occurrence odds of the dependent variable (Y), which is 1; p/(1-p) is the frequency ratio; β0 is the intercept and β1 to βn the coefficients that measure the contribution of independent factors (X1, X2,… Xn) to variations in Y.
A positive sign in correlations between landslides and each factor indicates that the explanatory variable increased the probability of change, and a negative sign implies the opposite effect. This statistical technique is a method of multivariate estimation that evaluates the relative strength and the significance of the factors.
This study analyzed the statistical distribution of the factors controlling landslides susceptibility, the DEM uncertainty, from which the terrain parameters were derived, and the combination of the factors with bigger contribution for predicting susceptibility.
Materials and methods
Study area
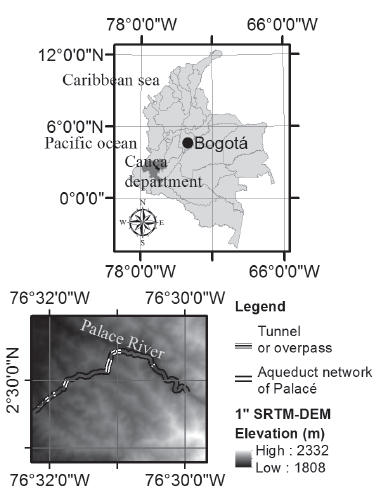
The study area is located in the basin of the Palacé river, between the coordinates 2°28'19,2" north and 76°32'16,8" west, and 2°30'57,61" north and 76°29'13,2" west. It covers a 4 m wide bank where there is a raw sewage pipe that is over a length of 5,72 km, with a pressure of 686 mm; and elevations between 1894 and 2012 m.a.s.l. The pipe passes over five viaducts, specifically a concrete pontoon and four tunnels with lengths of 13 m, 349 m, 170 m and 98 m. The target population that the aqueduct of Palacé serves is approximately 20,000 inhabitants in the northern sector of Popayan and the surrounding villages. Figure 1 shows the national and regional location of the study area.
Materials
The materials used for the quantitative evaluation of the landslide susceptibility processes are presented in Table 1.
Table 1 Materials used in research
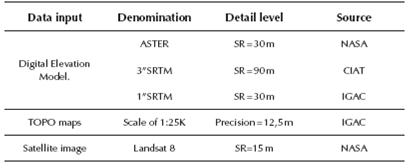
SR: Spatial Resolution - VA: Vertical accuracy - IGAC: Instituto Geográfico Agustín Codazzi of Colombia.
Source: Authors
General Method
State of the art review: Systematic review of pertinent literature, summarizing advances from different researchers on the methods and results in the subject of susceptibility to landslides processes.
Field trip: Observation of the study corridor to locate and describe pipe network elements and landslide processes in the main line.
Database: Building of a database with geo-referenced positions, types and descriptions of landslide processes in the analyzed corridor.
Procurement of materials: Gathering information from digital elevation models, satellite images from the Landsat 8 platform, topographic base maps, thematic maps of land use, failures and precipitation data for the period 1985-2013.
Data preprocessing: All spatial information was unified in an identical reference system and cut to the study area.
Generating a TOPO-DEM withy interpolation: Screen digitalization of vector objects, corresponding to drainage networks, roads, forest coverage and contour lines every 50m, with a topographic base map with a 1:25K scale and the Spline Interpolation method.
DEM-SRTM and DEM-ASTER accuracy: Obtaining altitude differences across the raster grid with spatial comparison of NASA DEMs and TOPO-DEM, which calculated the RMS error. These results, and a DEMs 3D visualization, allowed for the selection of SRTM 1" DEM to derive terrain parameters as model's input data.
Terrain parameters: Obtaining elevation parameters with numerical analysis by available algorithms from SAGA software, such as: slope (Zevenbergen et al., 1987), Index of convergence (Köthe et al., 1996), Topographic wetness index (Conrad, 2007), Flow path length (Quinn et al.,1991), and LS Factor (Moore et al., 1991).
Image processing of Landsat 8: Downloading January 2014 satellite imagery in bands, combined with ERDAS software and cut to the study area to calculate the index of normalized vegetation.
Processing of precipitation: Identification of weather stations next to the study area and calculation of the maximum monthly and daily precipitation during the 1985-2013 period. The spline interpolation resulted in continuous distribution maps for this variable.
Multivariate analysis of data: using the Principal Component Analysis technique for 10 factors: slope, distance to falls, distance to drainage, rate of convergence, length of the flow path, LS factor, topographic wetness index, maximum monthly precipitation, normalized vegetation index and elevation. We obtained six factors without redundant information for the logistic regression model.
Statistical method for susceptibility analysis: Implementation of the Arc-SDM (Spatial Data Modeller for ArcView 3.2) package which contains tools of logistic regression for analyzing weight evidence (Logistic Regression/Weights of Evidence) (Kemp et al., 2001). The inventory of landslide processes was a dichotomous independent variable for the study corridor, along with the following independent variables: slope, LS factor, topographic index of humidity, flow path length, soil units and index of convergence.
Information analysis and susceptibility model: Comparison of applied susceptibility models to existing studies to categorize the probabilities obtained in relevant ranges. We generated a layout of susceptibility results into categories and area elements.
Validation of results: Accuracy evaluation of DEM input from which we derived the ground parameters used in the model to infer the results' work scale, but as there are no semi-scale studies in the study corridor, we could not quantitatively evaluate the accuracy of the susceptibility. However, we did evaluate the performance of the classifier with the Receiver Operating Curve (ROC).
Results
Landslides processes inventory
Under the premise that future movements will occur under similar geo-environmental conditions that originated past events (Carrara et al., 1991), the inventory of landslide processes is essential for precisely identifying the locations and properties of previous landslides and determining the factors needed to predict future ones. 23 landslide processes were identified along the transmission system; 17 of them located in the first 2,8 km on the Palacé river slopes and only 6 in the remaining length. The types landslides, according to the classification of (Varnes, 1978), were rotational slides, landslides, rock fall, rock toppling and earth fall.
Accuracy of Digital Elevation Models
The SRTM DEM, 1" and 3", and the ASTER DEM were compared using vertical differences from the TOPO-DEM errors, and we found a RMS error of 21,1 m, 21,2 m and 25,8 m, respectively. The result of the SRTM1" DEM and the ASTER DEM were relatively close to the results, where an average error of 18,1 m and 33,1 m was obtained (Martinez et al., 2016) in a study area containing the region of this analysis. We selected the SRTM1" DEM as the most representative for the analysis of susceptibility, because recent studies have shown that, in terms of overall statistics, SRTM1" DEM is more accurate than ASTER DEM at one arc second resolution (Abbak et al., 2017;Abbak, 2014).
Principal Component Analysis (PCA)
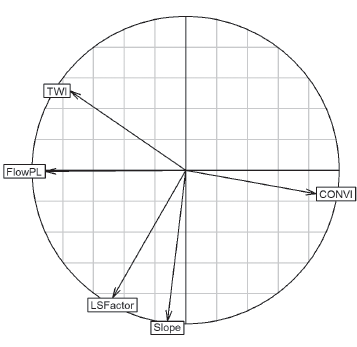
Remondo Tejerina (2001) used a reduced set of morphometric variables in a susceptibility model, because incorporating other variables led to little improvement and very similar results. Therefore, and within the principle of Parsimony, we performed a PCA according to the methodology and computational approach of Pardo & del Campo (2007) to incorporate independent variables into the susceptibility model with more representativeness and no correlation or duplicate information with others (Figure 2).
Terrain Parameters
Slope: Varies between 0 and 65°; the highest inclinations are located in the canyon of the Palacé river, where the pipeline has a 2,8 km long path from the water intake, impacting the geomorphology of the rugged and mountainous terrain (Figure 3a).
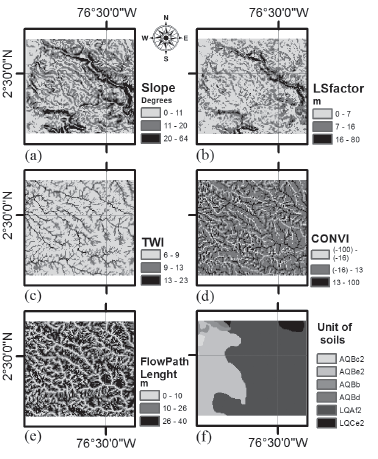
LS Factor: The specific topographic effects on soil erosion were estimated with the dimensionless topographic factor, LS, as the product of slope length and inclination at a point of interest (Van Remortel et al., 2001). This parameter varied between 0 and 80,3 m with a median of 8 m and a relative dispersion of 68 %. The highest LS values were found in the areas with highest slope gradients, such as the Palacé river canyon, in the initial 2,8 kilometers of the pipeline. This section had the highest speeds of surface flows, and therefore the highest rates of erosion because of a greater inclination and length (Haan et al., 1994) (Figure 3b).
Topographical wetness index: This parameter describes the effect of topography on the accumulation of water (Wilson & Gallant, 2000). We found values between 6,1 and 23,4, with a median of 9,8 and 19,5 %. The average value was very similar to the expected 10,1, obtained with the Montecarlo simulation by Martinez & Correa (2016) in the surrounding area of the study. The highest values were in the concave areas traversed by the Palacé River and its tributaries, between the K0 + 000 and K3 + 200 abscissas in the canyon over the Palacé river; and between K3 + 600 and K4 + 600 in areas where the pipe is crossed by smaller flows (Figure 3c).
Convergence Index: This index, proposed by Köthe et al. (1996), calculates the flow's convergence and divergence, departed from the appearance values of adjacent cells, without dependence on the absolute heights differences; negative values correspond to low ground convergence and positive ones to divergence in terrain crest points. This index ranged from -100 to 100, with a median of 0,011, and with symmetrical distribution similar to the results of Martinez & Correa (2016). In the first 2,8 km of the pipeline, we obtained negative values as expected; in the rest of the section, the index exposed the land's concave areas where water and convex shapes on the ground crests accumulated (Figure 3d).
Flow path length: The average distance along the flow path for each cell varied between 0 and 40 m with an average of 20,3 m and a relative dispersion of 66,7 °%. The longest distances covered by the flow to find the nearest drain was in the concave areas, mainly represented by the Palacé River canyon and its tributaries. In front of the K2 + 800 abscissa, the representative flow paths were seen with smaller streams, specifically located in the abscissas K5 + 100, K5 + 400, K5 + 800 and K5 + 900 (Figure 3e).
Geometric Parameters
Distance to drains: Euclidean distances to drains. Rivers have great effects on landslides: slope erosion or bottom material saturation in increased water levels (Dai et al., 2002). We found distances between 0 and 829 m, with a higher frequency in short distances, indicating closeness to drainage channels.
Distance to geological faults: The pipeline is crossed by two geological faults: La Estrella and El Crucero. They have uncertain activity in the abscissas K2 + 000 and K4 + 500 (IGAC, 2009). These failures generate areas of interest of up to 2,3 km on both sides.
Geo-environmental Parameters
Soil types: A study in the department of Cauca at a scale of 100000 (IGAC, 2009) highlighted the units LQAf2 and AQBe2. The first corresponded to soils with moderately coarse to fine texture, slightly corrugated to steep reliefs, derived from discontinuous volcanic ash layers of igneous and sedimentary rocks, and moderate to severe erosion. The second consisted of soils with moderately fine to fine textures, from undifferentiated igneous rocks and thick layers of volcanic ash, slightly corrugated reliefs and moderate erosion (Figure 3f).
Vegetation index: Shows the spatial distribution of vegetation cover. It had values between -1 and +1, indicating the strength of the vegetation (Deering et al., 1975). In the study area, this index varied between 0,12 and 0,61 with a median of 0,41, which is a good indicator of photosynthetic activity in the vegetation cover. The lowest rates were in the K0 + 200 to K1+ 600 section because of, the presence of exposed steep slopes with sparse vegetation, and between the abscissas K2 + 000 to K3 + 000, on exposed areas because of erosion in terracettes. In the abscissa K2 + 800, where a viaduct was built to mitigate rotational landslides, we found a NDVI corresponding to low vegetation cover in the area because of its sliding in a relatively recent move. In front of the K3 + 000, we observed high indexes, indicating higher density and vegetation strength, with the exception of the abscissa K4 + 800.
The variables: slope, LS factor, flow path length, topographic wetness index and index of convergence contributed to 81,4% of the information inertia, and were well represented in the first factorial plane, close to 1 radius. This indicated little correlation, ensuring the parameters extraction with little redundancy of intrinsic information between the predictor variables of ground instability.
The distance to faults and to drainage network did not have a good representation in the first factorial plane, indicating that their contribution was not significant to the predictive model of susceptibility, consistent with the study by Bonachea (2006), where distances of geometric proximity did not contribute significantly to the model. We found the same condition for vegetation index variables, maximum monthly precipitation and elevation. Figure 3 shows the independent variables within the susceptibility model.
Models of susceptibility to landslide processes
Applying WofE methods (Weight of Evidence factors), and Logistic Regression, implemented in the ArcSDM of ArcView 3.2 software, we found better correlation between slope and inventory of landslide, which measures spatial association between predictors and landslides (Thiery et al., 2005, 2007); when this value tends to zero, the presence of the parameter does not affect the distribution of landslides in the area, that means that the two variables are completely independent, and when the contrast value is larger than 2, the correlation is very significant (Barbieri et al., 2009). This same behavior is present in the other variables included in the prediction model: LS factor, topographic index of humidity, flow path length, soil units and index of convergence (Table 2).

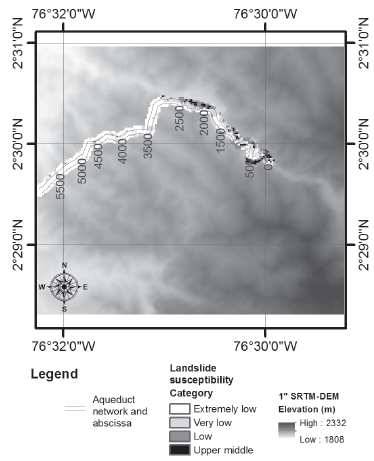
This confirms slope as an important terrain parameter in the statistical analysis of landslide threats, as observed by: (Brabb et al., 1972; Corominas et al., 2003; Turcotte et al., 2006). The prediction of landslide processes (Figure 4) shows that landslides will be more frequent in reliefs with average slopes of 48° (areas with a high slope and fractured rock), high LS values of 40 m (higher erosion rates because of increasing slope inclination and length) (Haan et al., 1994)), topographical indexes of humidity (17), indicating areas prone to soil saturation because of topographical tendency for water accumulation, indexes of convergence with a convergence of the water flow and flow path lengths of 29 m, and class 5 soils (LQAf2 type) and moderately coarse to fine textures and reliefs (from corrugated to steep), with layers of discontinuous volcanic ash over igneous and sedimentary rocks in the influence area of the transmission system.
Source: Authors
Figure 4 Map of susceptibility to landslide processes obtained by re-categorization of prediction, RLM method.
The susceptibility model with logistic regression resulted in the following prediction Equation (3).
Validation of Results
In this study, we did not see a comparison pattern in the strict sense of the term, so we could not produce a metric of evaluation of the model's error. We indirectly establish the uncertainty of the results with the following strategies:
Level of detail of the method: When comparing the degree of the slope algorithm information over the SRTM1" DEM, used to generate it, with a map of slope from an IGAC digital mapping, we observed a higher level of information of this parameter, obtained with the geomorphometry approach implemented in this study.
Comparison of drainage network: By comparing the drainage network, obtained by screen typing a topographic map (IGAC), with the flow accumulation algorithm over DEM-SRTM1", we obtained visual concordance on overlapping data, confirming the DEM potential to derive primary and secondary terrain parameters.
Receiver Operating Characteristic (ROC): A ROC plot measures the performance for a binary classifier. The curve showed the true positive percentage and the false positive percentage values for each class of the curve. The area under the curve (AUC) is the metric of the performance of the classifier (Robin et al., 2011). This was done with samples of training and validation in a proportion of 70/30 from landslide database. Finally, we obtained an AUC value of 0,66 which indicated a regular fit compared to a perfect fit when AUC is equal to 1.
Conclusions
We obtained a zoning map of susceptibility by landslides using the statistical method of logistic regression that related the inventory of landslide processes to independent variables derived numerically from a DEM-SRTM.
The PCA nonparametric method was used to analyse maximized variables related to terrain parameters, coverage, geometric parameters and precipitation, and found that a set of five parameters explained 80 °% of the total variability information, resulting in the maximum monthly precipitation with low representation in the first factorial plane.
It was not possible to quantify the accuracy of the prediction model because of the unavailability of a valid pattern of comparison. However, we evaluated the DEM RMS error used to derive terrain parameters, and we compared the level of detail in the contour line maps and the drainage network to those obtained in topographic base maps with screen digitization and the results of the AUC value of the ROC curve.
We combined all active landslides in a group to generate statistical relationships with terrain factors. Separate statistical models for different types of landslides, should be developed.

