


 Inglés (pdf)
 Articulo en XML
 Referencias del artículo
 Enviar articulo por email
 Citado por SciELO
  Citado por Google
  Similares en
SciELO
Similares en
SciELO  Similares en Google
 Permalink
Introduction
There is a growing interest in understanding the response of reinforced concrete slabs that are subjected to the effects of explosive (Castedo et al., 2015; Li et al., 2016). In addition, finding and characterizing retrofit mechanisms to mitigate the effects of blast continues to be of interest to private and government entities (Urgessa & Maji, 2010). One cheap retrofitting scheme is to use a foam with a long yield plateau for absorbing blast energy (Mendonça et al., 2017; Petel et al., 2013). A few studies have shown that foam retrofits increased the imparted impulse on the protected structures exacerbating total damage based on numerical simulation (Lee & O'Toole, 2004; Mendonça et al., 2017; Mullin & O'Toole, 2004). However, these studies lack direct comparison or correlations using field tests.
To address the gaps in the literature, multiple blast tests were conducted on reinforced concrete slabs measuring 1,0 m χ 1,0 m in plan and 0,08 m in thickness, at the Science and Technology Aerospace Department (DCTA) stand site in São José dos Campos, São Paulo, Brazil. This paper presents the description of the experimental test set-up, instrumentation and results from a sub-set of the blast tests conducted on four 50 MPa concrete slabs with reinforcement ratios of 0,175% in one direction and 0,37% in the perpendicular direction. In addition, two of the four slabs were retrofitted with 50 mm thick expanded polystyrene foam (EPS) on the upper surface of the slab, to determine whether the foam has the capacity to reduce or exacerbate the blast response of the slab. Figure 1 shows the setup of the full-scale test with a stand-off distance (R) of 2 m.
Experimental Setup
The explosive
The plastic bonded explosive used in this experiment contains 2,70 kg of equivalent TNT mass. The explosive was PBX (Plastic-bonded explosive) with 80% of HMX (High Melting point Explosive) and 20% of binder. More details about the explosive can be found in Kirchhof et al. (2016). The body of the explosive was cylindrical in shape measuring 20 cm in height and 10,5 cm in diameter as shown in Figure 2. This shape was chosen in order to generate pressure direction like a warhead. A booster on top of the cylinder was used to shelter the primary charge of explosive that was triggered by an electrical fuse. Non-confined explosives have been widely used for blast tests in order to measure blast wave effects (Netherton et al., 2014). The main reason is because records from blast effects are more reliable when there are no explosive fragments. The research team was housed in a bunker by 250 m far from the detonation point while conducting the experiment.
High explosives are standardized by equivalent TNT charges of weight (Draganic & Sigmund, 2012; Koccaz et al., 2008; Li et al., 2016; Zhao & Chen, 2013).
A scaled distance (Z) is defined by the equivalent TNT mass (W) and stand-off distance (R) as shown in Equation (1) (Brode, 1955; Draganic & Sigmund, 2012; Zhao & Chen, 2013). Table 1 shows the scaled distance values of the four tests.
Explosions near structures, such as the case in the experimental test described in this paper, will experience multiple reflected pressure (PR) (Li et al. 2016; Maji et al. 2008). Figure 3 shows an example of time-history curve recorded by pressure sensors during the first slab test. It is worth to note that more than one peak of reflected pressure were recorded during the shock wave positive phase. It was due the short scaled distance.
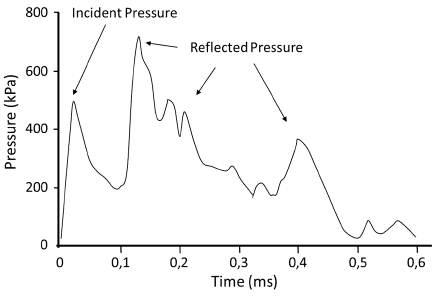
Integration of the area under the curve of the positive phase of the blast wave results in the specific positive impulse acting on the target (Ngo et al., 2007). Positive impulse is the main parameter that causes damage to structures in blast events (UNODA, 2011). The higher the reflected pressure, the higher the total impulse and it will cause more damage to the target. Multiple peaks of reflection increase the area under the curve and the total impulse as well.
The slabs
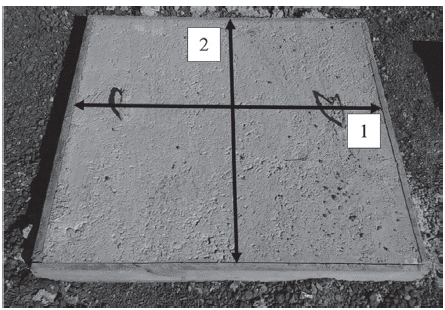
Each of the four slabs measured 1,0x1,0x0,08 meters in dimension. The slabs were made with concrete having 50 MPa of static compressive strength. The reinforcing steel had different ratios on the two main perpendicular directions as shown in Figure 4, and it was placed inside the bottom face of the slab to carry positive moment developed due the load direction and boundary conditions.
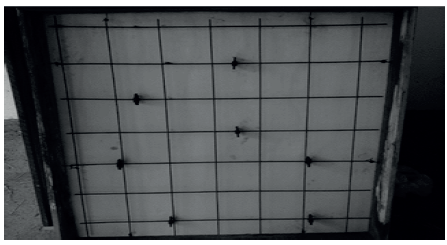
Both directions have 7 reinforcing steel with 5,0 mm in diameter, as shown in Figure 5. However, two more reinforcing steels of 10 mm were added along direction 1 to increase the reinforcement ratio in one direction of the slab, as shown in Figure 6. It was an option to verify the behavior of one more reinforcement ratio.
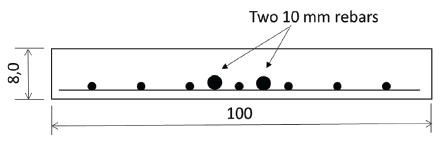
Equation (2) defines the reinforcement ratio in each direction as the ratio between the area of the reinforcing steel (AS) and the area of the concrete cross-section (AC).
For direction 1, AS was 1,4 cm2 and for direction 2 was 2,96 cm2. The area of concrete (AC) was 800 cm2. Using Equation (2), the reinforcement ratio for direction 1 is 0,175% and for direction 2 is 0,37%.
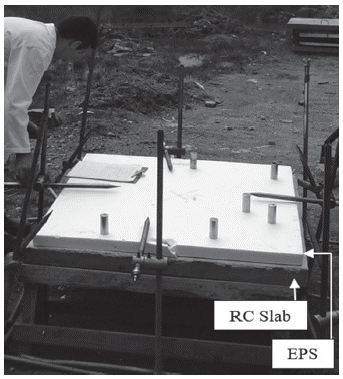
Two of the four slabs tested had 50 mm of expanded polystyrene foam (EPS) retrofitting on the upper surface (labelled as slab 2 and slab 4 in Table 1), in order to verify if the foam provides reduction of the blast wave effects on the slab response even without thermic protection. Figure 7 shows the EPS applied on top surface of slab 2.
Instrumentation
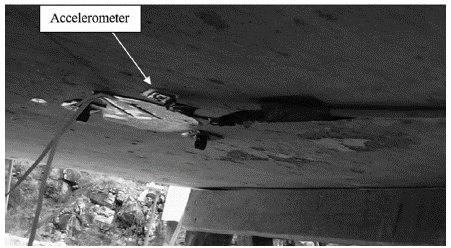
Accelerometers were assembled in the Electronic Engineering Laboratory at ITA (Aeronautics Institute of Technology) in DCTA (Science and Technology Aerospace Department). They were made with an Arduino System consisting of a circuit with 9V DC battery supply, a memory card, and an acceleration sensor MPU 6050. The accelerometers were calibrated using a turntable calibrator to guarantee that their recording was correct. MPU 6050 was attached to the bottom of the slabs to measure the acceleration due the shock wave as shown in Figure 8. The main circuit was placed inside a heavy lead box surrounded internally by foam where it was sheltered from shock wave and debris.
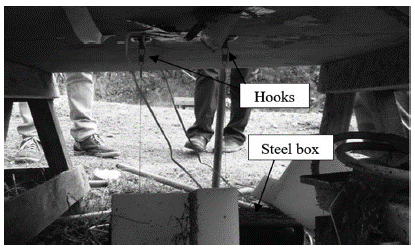
Two displacement meters were positioned under the bottom surface of the slab inside of a steel box. A tensile wire was fixed on a hook bonded at the center of the bottom surface of the slabs and connected to the displacement sensor. Whilst the slab deflects due to the blast, the wire moves up or down and the displacement sensor records the slab displacement. Figure 9 shows the hooks bonded on the bottom surface of the slab and the steel box where the sensors were sheltered.
Source: Authors
Figure 9 Hooks attached on the bottom of the slab and the steel box sheltering the displacement meter.
Eight pressure sensors were positioned around the slab at equal distances from the explosive in order to guarantee the same-scaled distance for all tests as shown in Table 1. Four sensors were placed at a higher position to measure incident pressure whereas the remaining sensors were positioned as close to the slab as possible to measure reflected pressure (Figure 1). An Olympus® high-speed digital camera captured still and video images from the explosion event, working with a Toshiba® rugged notebook, recording at 2 500 frames per second (fps). The camera was placed at a distance of 180 m from the explosion.
Results and Discussion
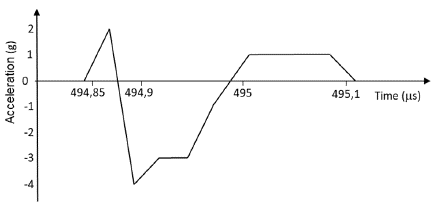
The accelerometer for slab test 1 failed. However, for the remaining three tests it worked well. The acceleration peak during the blast wave action against the slabs can be easily found. The acceleration data for test 2 is shown in Figure 10. The highest peak was 4,36 g (42,77 m/s2) after 0,05 x 10⁻⁶ s of the trigger.
For Slab 3, the accelerometer recorded a peak of 7,26 g (71,22 m/s2) after 0,024 x 10-6 s of the trigger. The recorded data for slab 4 was the highest with the peak of 8,089g (79,35 m/s2) after 0,024 x 10-6 s of the trigger. Further tests are needed to verify accelerometer performance with different values of Z.
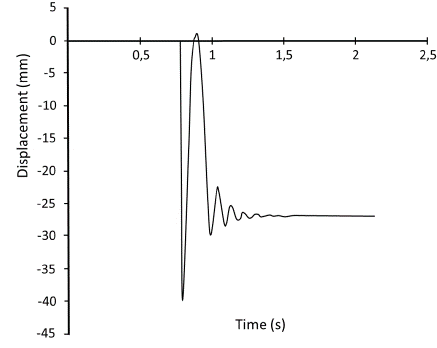
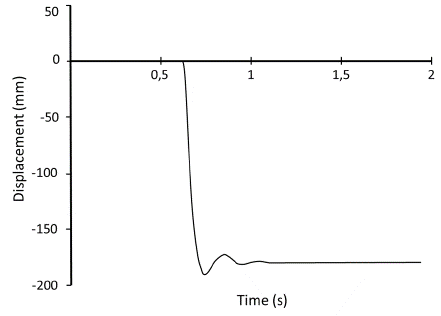
Displacement meters were fixed at the center of the bottom surface of the slabs. The displacement meters measured the mid-span deflection of the slabs. Figure 11 shows the displacement-time history recorded for slab 1. This slab did not fail and the peak measured displacement of the slab was 39,8 mm. The drop in displacement and the back up before stabilizing was because of the boundary conditions. The slabs retrofitted with the EPS foam (slabs 2 and 4) experienced a higher linear momentum and they failed. Therefore, the recorded displacement values were not reliable for slab 2 and slab 4. Slab 2 result is included for the sake of completion as shown in Figure 12.
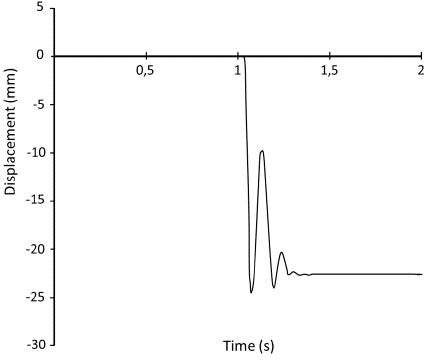
Slab 3 developed minor cracks but did not fail completely with a measured peak displacement of 24,6 mm. Figure 13 shows the displacement-time history data for this slab.
Integration of the displacement-time history of the slabs gives the velocity imparted during the action of the shock wave. The linear momentum developed in the slabs can be calculated once the velocity is determined. Table 2 shows the linear momentum developed in the four tests.
The piezoelectric pressure sensors recorded blast pressure-time history for all tests. Figure 16 shows the comparison of recorded to theoretical values of incident (Pso) and reflected (Pr) pressure given by the widely used Kingery and Bulmash curves (Kingery & Bulmash, 1984; Swisdak Jr, 1994). Recorded incident pressure was given by the results of sensors at the higher position. Sensors close to the slab gave reflected pressure. The difference between theoretical and recorded incident pressures was 7% for slabs 1 and 2, and 12 % for slabs 3 and 4.
Overalls slabs with EPS foam retrofitting experienced a higher linear momentum when compared to slabs without the foam retrofit. Slab 4 with EPS foam retrofitting developed the highest value of linear momentum, showing that the foam without thermic protection can increase the movement of the element retrofitted while the blast wave shocks the system. Slab 1 did not fail. Slab 2 failed as shown in Figure 14. Slab 3 developed the smallest linear momentum and did not fail as shown in Figure 15.
Theoretical value of reflected pressure was given by Kingery and Bulmash curves (Kingery & Bulmash, 1984; Swisdak Jr, 1994) as well. Slabs 2 and 4 showed the highest difference from theoretical predicted values, having predicted values 35% and 38% higher than the recorded respectively. Slab 1 had recorded value 6% higher than predicted value and for slab 3 the predicted value was 7% higher than recorded. We attribute these differences because of uncertainties involved in the physical system due to the small-standoff distances of the explosions.
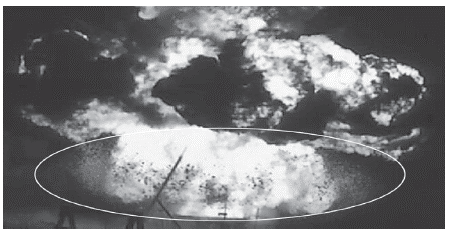
As the slabs had different reinforcement in mutually perpendicular direction, it was possible to verify that the collapse happened in the direction with lower reinforcing steel. The slabs with EPS foam without thermic isolation (slab 2 and slab 4) could not support the blast pressure and failed as shown in Figure 15. However, reflected pressure for slabs with foam was 40% lower in average. Post-video analysis revealed that the EPS foam burned during the detonation as shown in Figure 17.
Source: Authors
Figure 16 Comparison of theoretical and average of recorded incident and reflected pressures.
Source: Authors
Figure 17 Explosion of slab 2. The circle highlights the EPS being burned. Image recorded 9,6 m after trigger.
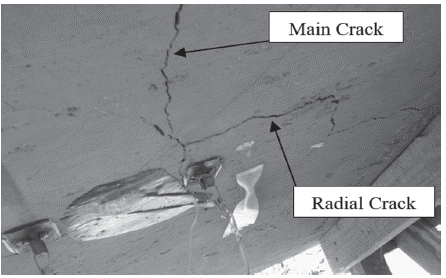
Slabs 1 and 3 (Figure 15) resisted the blast effect in a better way than slabs having EPS foam retrofits. These slabs did not fail and remained in the original position even if they developed some cracks. The main and radial cracks generated at the bottom surface can be clearly seen in Figure 18.
Reflected pressure can increase specific positive impulse. Due to this, impulse is the effect that brings damage to the slab in these tests.
Tests with larger slabs are being planned to confirm the response of a real size reinforced concrete slab.
Conclusions
Four reinforced concrete slabs having 50 MPa compressive strength and 0,175% reinforcement ratio in one direction and 0,37% in the perpendicular direction were subjected to blast effect of non-confined PBX explosive. The explosive was suspended at a stand-off distance of 2,0 m and had the same scaled distance for the four tests. The equation used for the comparison of theoretical and recorded values for blast pressure worked well within 7-12% for incident and reflected pressures. Two of the four slabs had EPS foam retrofit in order to investigate whether the foam helps absorb the blast energy or not. It was observed that EPS foam without thermic protection did not help resist the blast load, instead exacerbated the response by generating a higher linear momentum. This observation agrees with Lee and O'Toole research (2004) that shows the possibility of the foam retrofitted having an unwanted consequence in resisting blast loads. The slabs without foam retrofitting resisted the effects of the shock wave without collapse following a sound engineering design of reinforcing steel.

