


 Inglês (pdf)
 Artigo em XML
 Referências do artigo
 Enviar este artigo por email
 Citado por SciELO
  Citado por Google
  Similares em
SciELO
Similares em
SciELO  Similares em Google
 Permalink
Introduction
Comminution is commonly defined as the reduction in the average particle size of solid materials. It is usually performed via crushing, grinding, cutting, vibrating, among others (Martins, 2016). These processes are commonly used in the mining, pharmaceutical, food, chemical, recycling (Kruszelnicka, 2020), and ceramic industries.
The structural ceramic industry is dedicated to the procurement of bricks, tiles, and refractories (Cely-Illera, 2016). Most companies operating in this sector obtain their raw materials from quarries close to their installations, regardless of whether these quarries belong to them or to third parties. Untreated clay obtained from quarries is transported by truck to the company site, where it is unloaded and stored for later use (Regional Activity Centre for Cleaner Production, 2006).
During the grinding process, untreated clay acquired directly from the quarry is milled to obtain raw material with the necessary grain-size distribution and texture for subsequent shaping. Two methods can be used to achieve this: the dry method and the semi-wet method. This study focuses on the dry method, since hard clays are best prepared in installations by using it. This type of system ensures that a significant proportion of fine particles is obtained, which can then be moistened more easily and quickly, thus resulting in a highly homogenous mass with high plasticity. As a result, a better finish and a stronger product are obtained.
In the structural ceramic industry, crushers, box feeders, hammer mills, and conveyor belts are common machines used in the comminution process. Although it seems straightforward at first, the sheer number of combinations of all the parameters to consider makes it extremely likely that erroneous estimates will be made, as well as glossing over the best possibilities. There is a need to develop valuable tools to aid decision-making in real-world problems that are usually solved only by experience (Pradenas-Rojas and Passicot-Guzman, 2017). The aim of this study is to optimize the selection of the necessary equipment in the comminution of structural ceramics, considering the desired level of production at the lowest possible investment cost.
It is possible to find decision-making processes similar to those presented in this paper in the field of maintenance management applied to grinding processes (Barbera-Martinez, Viveros-Gunckel, Gonzalez-Prida-Diaz, and Mena, 2014), as well as in the equipment selection process (Musingwini, 2016). However, in the mining industry, much of this type of processes used to be carried out experimentally despite the costs derived from decision-making (Burt and Caccetta, 2018). Moreover, in the structural ceramic industry, it is difficult to find studies focused on the selection of equipment, perhaps because this kind of product has a lower added value.
To optimize a process, it is necessary to be able to simulate and evaluate the behavior of the industrial plant in order to ensure that there are no bottlenecks or unnecessary over-sizing. These simulations are common in other fields (Lin and Chen, 2015) and, although there are commercial programs for the crushing process, they are usually focused on the mining industry (such as JKSimMetTM, USIM PACTM, and ModSimTM) and are steady-state simulators. Even though they are adequate in several circumstances, they are unable to simulate transient states and may lead to erroneous estimates (Asbjornsson, Hulthen, and Evertsson, 2013).
Discrete event simulators have been proven to measure the efficiency of in-plant logistics (Seebacher, Winkler, and Oberegger, 2015). Recently, a modular system has been reported, developed using MATLAB/Simulink to simulate the comminution circuits applied to the mining sector (Legare, Bouchard, and Poulin, 2016). Negahban and Smith (2014) provide an excellent review of discrete event simulation publications with a particular focus on applications in manufacturing.
Later in this paper, it will be made evident that it is impossible to evaluate all feasible solutions in a short period of time. Therefore, it is necessary to look for optimization algorithms that allow finding an optimal solution in a reasonable period of time. Guerrero, Sotelo-Cortes, and Romero-Mota (2018) use a multi-objective model based on mixed integer programming, combining optimization and simulation techniques. We have chosen a genetic algorithm (GA) approach in this work. GAs are based on the mechanisms of natural evolution which were originally proposed by John Holland (Holland, 1975). A GA is a strategy that employs random choices to guide a highly exploitative search, striking a balance between exploration of the feasible domain and exploitation of good solutions. An example of the combination of GA and simulation applied for facility layout problems can be seen in the work by Wang, Yan, Zhang, Shangguan, and Xiao (2008), where the objective function is the material handling cost.
Note that a previous study applied GAs to optimization problems involving comminution processes and is closely related to the problem that affects the subject of this work (Farzanegan and Mirzaei, 2015). Another study applied it in a crushing plant using commercial machines from the Sandvik Company (Derpich, Munoz, and Espinoza, 2019).
This study improves upon existing methods in the literature by optimizing the entire design of a comminution process, rather than just the parameters that control a previously defined process. This design includes the selection of the equipment at each stage, as well as the values of its main parameters to facilitate optimal operation. Therefore, we have programmed a GA that designs the process and a simulator that evaluates the design proposed by the algorithm.
The aim of this work is to facilitate decision-making in the process of selecting equipment for the ceramic industry, looking for the optimal combination of machinery that meets the desired production and granulometry at minimum cost.
Description of the problem
Process description
Figure 1 shows the 5 stages of a basic dry grinding process. This type of process is used in the structural ceramic industry when the clay moisture is less than 10-12%. Comminution in a dry grinding process is typically performed in two stages, using a crusher and a hammer mill consecutively to achieve the optimum granulometry needed in the extruder. The extruder needs a continuous flow of material, while the crusher receives a batch flow. The raw material extracted from the quarry is dosed into the crusher via a dumper truck or wheel loader every time the hopper reaches a previously stipulated level.
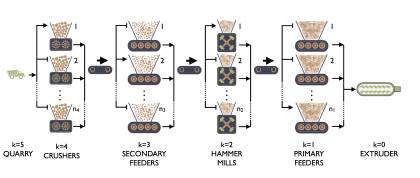
There are feeders with hoppers between these machines in order to avoid bottlenecks and homogenize material flow.
Each stage has a number of identical equipment (nk), and each equipment consists of one machine (Mk) and one hopper (Tfc). A particular machine model can be fitted with different types of hoppers. Storage capacity increases with height, but the total height (machine plus hopper height) is limited by the inside height of the factory. PSk is the stage production (t/h) and Pk (t/h) is the equipment production in stage k; thus PS k = n k P k .
Every machine has a short conveyor that feeds the main conveyor, which brings the material to the next stage. If there is more than one machine at this stage, another reversible conveyor is needed to feed the hoppers one by one. The main conveyor belt moves material between the stages. Their speed and inclination are design parameters and depend on the chosen model. The length is determined by the height of the equipment that receives material, and the width is calculated to ensure that the capacity is enough to carry the maximum output that the stage can produce. The value of material waste during transport between stages is typically 5% or less of the material moved at each stage.
The extruder or stage k = 0 is the process client. It kneads the clay with water to obtain the desired shape through extrusion and vacuum. This equipment needs a continuous and uninterrupted material flow with a fixed granulometry. The client determines both parameters: PSk=0 = PS0 (t/h) and Φk=0 = Φ0 (mm).
Primary feeders or PFs (M1) dose the exact production required in the extruder. Each feeder draws a variable production Pk=1(t/h) from its hopper. The total stage production must be equal to PS0, but the production of each feeder may vary within a range according to material availability.
Hammer mills, or HMs, (M2) break the material to decrease its granulometry. The diameters of screen holes are fixed to match the granulometry needed in the extruder (Φ2 = Φ0). HM model production is fixed, and the overall production sent to PFs is the result of multiplying the number of active HMs (the ones with material in their hoppers) by their nominal productions. They stop once PF hoppers are full and run again when some of their levels are below a reserve level, which is usually 40% of their capacity, and all available HMs send material to the corresponding PF hopper.
Secondary feeders or SFs (M3) feed HMs in a similar manner as PFs do, although they do not necessarily feed the exact amount of material that HMs produce. Once all the HM hoppers are full, the feeders stop and resume when a hopper reaches the reserve level. Material flow must be equal to or higher than the amount needed by the HMs in order to receive sufficient material in a timely manner every time they are set in motion. This parameter, called 'production multiplier' must be considered in the design process.
Crushers (M4) decrease the grain size of the raw material stored in their hoppers T4. The diameter of the raw material, Φ5, is an initial condition of the problem. Otherwise, the diameter from the material that goes out of the crusher, Φ4, varies between a set of values. This is important because the selected size influences the work done by the HM.
Stage 5 models the way in which trucks or wheel loaders directly transport the raw material from the quarry. Batch process size, number, and tempo depend on hopper capacity, T4. In this work, we have decided that the simulator should use the wheel loader when the capacity of the hopper is small, and dumper trucks in the rest of the cases. The average charge cycle time has been considered to be 5 and 20 minutes, respectively.
Process parameters
The main parameters that control the process are demanded by the client: extruder continuous production, PS0 (t/h), and extruder granulometry, Φ0 (mm). Other parameters affecting the performance of the plant are raw materials granulometry at the quarry, Φ5 (mm), and available height inside the factory, H (m).
Bulk density p is a significant factor because clay is a granular material, and its density depends on particle size. Equation 1 defines a linear relationship between Φ80 (the diameter below which 80% of material passes) and density based on a company experimental dataset. Therefore, density grows as grain size decreases, and the material becomes more compact. This indicates that the flow demanded by the extruder (m3/h) is lower than the flow of clay at the entrance.
Considering these parameters and available commercial models, the designer defines a set of machines and hoppers for each stage and chooses a specific one from these sets. Let Mk = {1...qk} be the set of feasible machines in stage k (k = 1... 4) with qk as the maximum number of selectable machines. Tik,k is the set of feasible hoppers for each machine in stage k, with ik Є Mk. Therefore, the problem is to select the machine and hopper model in each stage k, as well as their respective numbers. The decision variables are as follows:
xk i the machine model that equals 1 if the model that occupies position i in {Mk} is selected;
yk i,j, the hopper model that equals 1 if the model that occupies position j in {Tik,k} is selected;
and nk, the number of equipment (machines plus hopper) in each stage.
As comminution is generally done in two stages, it is necessary to define the output diameter at the crusher, Φk = 4. As the possibilities are many, a set {B} of bmax dimensions is defined with the most common values. The second variable is the production multiplier for the secondary feeder, which is limited to a set {A} of amax dimensions with values between 1 and 2. The production value given by these feeders is the theoretically necessary production at the extruder stage multiplied by factor a.
Optimization approach
Genetic algorithm
Design experts, depending on their subjective experiences, typically judge a huge combination of feasible solutions to select an optimal solution. But not all solutions are really feasible. Thus, some solutions tend to be over-dimensioned if the designer is focused on reliability, while some solutions lead to a lack of production if the designer is focused on cost. Hence, each solution needs to be simulated to evaluate its performance, but this is time-intensive and not feasible.
A GA has been developed to solve this problem. The goal is to find an optimal equipment set that minimizes installation costs while ensuring a feasible solution (extruder continuous production and granulometry, as well as maximum installation height). Each solution is codified as an integer 14-dimensional vector, and gene value indicates the positions of selected elements in the set. Thus, the chromosome structure is {n k =1, i k =1, j k =1, n k =2, i k =2, j k =2, a, nk=3, i k =3, j k =3, nk=4, i k =4=4, jk=4, b}, where nk is the number of equipment (machine and hopper) corresponding to block k; ik is the position of machine model in set {Mk}; j k is the position of the hopper model in set {Tik,k}; a is the position of the production multiplier parameter in {A}; and b is the position of the selected diameter k = 4 in {B}. All values range between 1 and 5.
The goal is to minimize all equipment costs, C equip , expressed by Equation 2. The cost of machines and hoppers at every stage k, is defined by Cm i k and Chj ik, where nk is the number of machines, Cck+i/k is the cost of the conveyor, and nck+1,k is the number of conveyors.
The flowchart of the genetic algorithm schema is shown in Figure 2. The GA starts with a randomly generated population, the Basic-Population (BP), of feasible Npop-solutions whose fitness is evaluated (Equation 3). Then, a new population is formed by selecting individuals from this BP to create the offspring of a subsequent generation. Every basic solution has a predetermined probability p c (p c = 0,8) to belong to a parent population. Subsequently, a best-worst crossover operator is applied to establish parent-chromosome pairs and generate two offspring from each couple. Each offspring gene is randomly selected from one of the parents. After the crossover, the mutation operation is carried out. A chromosome of the offspring population is selected for the mutation operation with probability p m (p m = 0,3), and the values of 3 genes change randomly. Each of these solutions is evaluated in a computer model specially designed to simulate its behavior. A solution is rejected if it is unfeasible.
The algorithm selects the best solutions (parents, offspring and muted) to survive, and it updates the BP. Additionally, a heuristic technique is applied to improve the quality of BP solutions. The method consists of randomly choosing a block or stage (k = 1... 4) and changing all parameters of the selected block. Finally, the last iteration step is to choose the best solution and finish the improvement method for this iteration. The best feasible solution is selected when the maximum number of iterations is reached.
Model simulation
Apparently, the problem and the solution proposed by the algorithm seem simple, given the fact that there are no components of variability in the system (it is assumed that, at the entrance, the clay has the same particle size, times are fixed, etc.). However, when the behavior of the different equipment is simulated and the evolution of hopper levels over time is evaluated, this behavior becomes dynamic and seemingly chaotic.
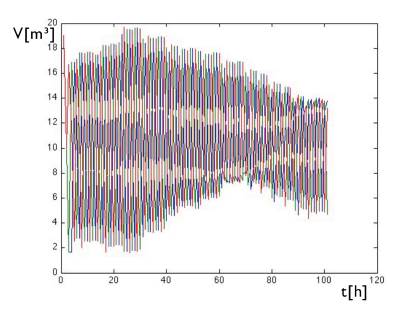
The operation of each stage is conditioned by both the anterior and subsequent stages, and the flows take time to stabilize. It is therefore difficult to predict where and when bottlenecks can be found, and the existence or not of oversized elements. Figure 3 illustrates the evolution of the capacity (m3) of a hopper of feeder. Initially, the hopper is full and begins to empty in a linear manner, but soon the behavior becomes chaotic when the material demand and filling cycle have different and chaotic periods. Some examples of this type of behavior can be found in the works by Legare etal., (2016) and Li, Evertsson, Lindqvist, Hulthen, and Asbjornsson (2018).
Therefore, we have designed a simulation model to evaluate the operation of the installation over a sufficiently long period of time, in order to ensure that the model reaches all states. The process starts with all the hoppers full at maximum capacity, and the extruder starts by requesting material from previous stages. The model continuously evaluates the flow of material that reaches the extruder, PR T (t/h), and compares it to PS0 (t/h), the design parameter. The relationship between PRT and PS0 is the Service Level (SLR).
The simulation model has been programmed in Matlab© and, in addition, another parametric model was built using WitnessPwF© to validate the results. The results of the two approaches are very similar, and the differences are not significant. Finally, the Matlab-based model was included because the computational time to evaluate each solution was lower.
Early results show that a cheaper installation cost can be achieved if constraints are relaxed by allowing production (PRT) to be below what is initially required (PS0) at certain times. Therefore, it has been decided to widen the search space with those solutions that were close to the desired level of service, SLT. We do not rule out solutions that fall short of it, but we penalize (PE) them proportionally to how close they are (Equation 3). This way, SL, far from being a restriction, became part of the fitness. Then, the fitness function became as the one defined in Equation (4).
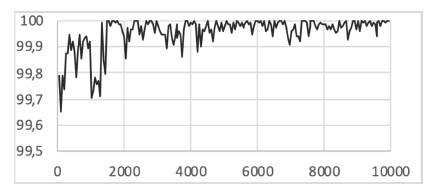
For example, Figure 4 illustrates the evolution of the SL (%) of a facility when PS0 = 100 t/h. Initially, the installation was perfectly balanced, but there were actually small imbalances caused by the excessive production of the crusher.
After several rounds of testing, the simulation time will be at least 50 hours for all states to appear; the necessary warm-up period is 5 hours. Thus, the computing time to simulate each GA proposal is 40 seconds.
Results and discussion
Computational results
The algorithm was implemented in the industry to validate its performance. Usually, the ceramic industry production values range between 50 and 150 t/h, so machines are sized to meet these requirements. However, there are cases where much larger productions are needed, where success business stories to compare are much more limited. Thus, 8 levels of extruder production (25-50-100-150-200-250-300-400 t/h) and 2 levels of particle size reduction (125,5/1 and 81,2/10) have been identified, and the number of experiments is 16.
Taking these requirements into account, available commercial models were selected. The models and parameters used in this study were based on the real-world equipment of a company located in Zaragoza Spain, dedicated to the design and manufacturing of machinery for the treatment and preparation of clay in the ceramic industry. Table 1 shows various parameters such as the range of flow rate, capacity, and cost of feasible equipment at every stage. To facilitate the comparison of results, the set of machines and hoppers for each stage was the same for all experiments. Note that the selectable models at feeder stages are identical. On the other hand, crusher machines have higher flow rates than hammer mill models because of the presence of waste material between stages, and because the material is compacted as the process progresses.
Otherwise, the caudal output at the crusher, QCRUSHER, is subjected on k = 4, and it increases with the diameter (the Qk = 4 interval in Table 1 is for the minimum diameter, k = 4 = 24 mm). The hammer mills caudal, Qk=2, is not directly influenced by particle size and production, but hammer velocity, inlet position, breaker gap, infeed granulometry, screen size, and others have minimum influences on this parameter. To simplify the model, a constant and independent production were considered.
The numerical experiments were performed on a Windows 7 PC with an Intel® CoreTM i7-6800K CPU@3.4GHz and 16GB RAM. The GA and code for the simulation model were written in MATLAB©.
To simulate each solution, simulation time was set to 50 h with a 5 h warm-up period; the computational time was around 38 s per solution. The average computing time to make the prescribed iterations prescribed was 6,7 h, and the algorithm evaluated approximately 630 solutions. Each test instance was solved 8 times, and the best results are listed in Tables 2 and 3.
Table 2 shows the best result's configuration and cost. The first three columns define the numeration and settings of the experiment. Column 4 refers to the cost (M€) of the best solution found among the eight solutions obtained. Columns 5 and 6 refer to the primary feeder stage (k = 1), listing the number of machines and unitary cost of the equipment (M€). The rest of the columns contain similar information for the hammer mills (k = 2), secondary feeder (k = 3), and crusher (k = 4) stages.
Table 3 displays the number of machines, flow rate, and capacity of the best solutions for all stages. The results suggest that the installation cost is strongly related to production, and the cost of all stages rise as PS0 increases. When scenarios with the same productions are compared, it is made evident that the value of the particle size reduction is not relevant. Hence, the algorithm proposes identical configurations (number and type of machine and hopper) for each level of extruder production, even when the particle size reduction changes, except in the case of crushers (PS0 = 150 t/h). The conveyors cause small differences (note that installation cost decreases, as expected, but only 0,5% of the maximum); as clay is more compact, conveyors are narrower and cheaper.
Analyzing the configuration of each stage, the algorithm proposes high production HMs and medium-low production crushers. On the other hand, hoppers of all stages and experiments are as small as possible, to ensure equipment height is as short as possible, which allows for shorter and cheaper conveyors to be used. Finally, note that size reduction in the first crushing stage, IN - k = 4, is the least possible. Moreover, k = 4 takes medium to high values, which are independent of the initial and final granulometry. In this way, the crusher processes as much material as possible, although the crushing is not so severe.
Figure 5 shows, for each production level, the individual cost (M€) of every stage including conveyors, calculated through Equation 2 and disaggregated by stages. As expected, the cost of all blocks increases as production rises.
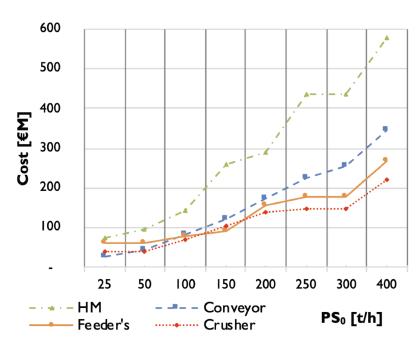
Figure 6 displays the cost relative to the global cost for each problem (%), and a particular emphasis is given to the relative cost of hammer mills. On the other hand, conveyors account for 20-25% of installation costs, although this cost is not considered during product design, given that they are considered to be an auxiliary system.
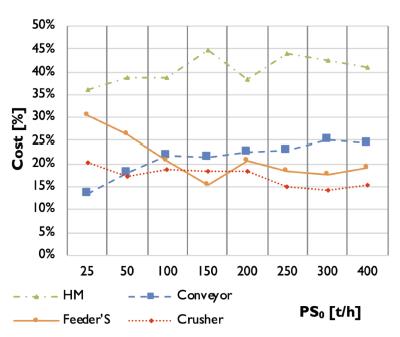
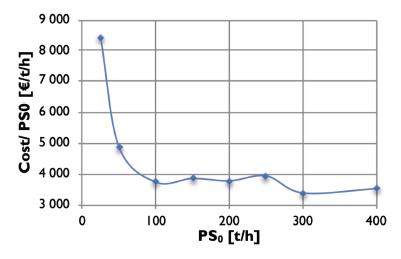
Figure 7 shows cost relative to PS 0 . Relative cost is very high for small PS 0 values because of oversized equipment; at higher productions, the relative cost does not change so much, and these small differences are due to the discretization of equipment parameters (capacity, flow, and cost).
Algorithm vs. industry
The solutions provided by the GA are similar to those adopted in ceramic industries, but some interesting alternatives appear in the design of facilities.
Normally, hoppers are placed as high as possible, except at the hammer mills stage. This decision is usually made because of doubts that the line is not balanced and properly dimensioned. This results in conveyor belts that are much longer and need a larger area for the comminution zone, thus increasing the cost of hoppers and especially belts, which can represent 40% of the installation investment. Additionally, this over-dimensioning also causes an increase in energy consumption.
Finally, it is worth noting that this work has been approximated in the most realistic way possible, using commercial equipment with sizes and prices related to the relevant industry. For large production cases, the capacities of hammer mills are insufficient, and a higher capacity model needs to be developed.
Conclusions
In this paper, we parameterized and characterized the comminution process of ceramics, where the dry grinding process was carried out with two machines: crusher and hammer mill. We proposed a simulation-optimization-procedure-based GA to obtain an economical solution to the problem of equipment selection. In this study, we considered the cost of all the installation equipment and the ratio between the actual and demanded production at the extruder during the considered period of time.
To assess the feasibility of the solution, it was necessary to develop a simulation model that, via time discretisation, calculated the obtained production and material granulometry, as well as the service level. Because of the high computation times needed to evaluate production, it was necessary to consider different strategies in the GA, including local improvement to select an optimal solution in a shorter time. Finally, the proposed method has been tested with a variety of real-world problems faced by the ceramic industry, evaluating how the cost of the plant and the type of equipment is distributed in each block or stage. Such calculations can be done for a wide range of combinations of machines and hoppers, with respect to both number and sizes.
Regarding the obtained results, it should be noted that the installation cost is strongly related to production, but not to the particle size reduction. We would also like to highlight the need for hoppers of all stages and experiments to be as small as possible, in order to ensure that the equipment is as short as possible, and, therefore, allows for the use of shorter and cheaper conveyors.
The capacity of the system presented in this article to design comminution plants has been proven. Finding the best possible solution that fits with the needs of the client presents possibilities of new ways of working that would allow companies to overcome the bias that an expert may have when designing new plants for the structural ceramic industry. Future work should incorporate more complex grinding processes and energy consumption into this method.

