


 Inglês (pdf)
 Artigo em XML
 Referências do artigo
 Enviar este artigo por email
 Citado por SciELO
  Citado por Google
  Similares em
SciELO
Similares em
SciELO  Similares em Google
 Permalink
Introduction
Urban drainage systems present alarming rates of aging and deterioration in both developed and developing countries (Osman et al., 2012). Essentially, most sewer networks are more likely to fail each day (Ward and Savic, 2012) due to structural deterioration. In turn, this impacts the level of service and quality of life (Osman et al., 2012; Micevski et al., 2002; Liu and Kleiner, 2013; Caradot et al., 2017).
Multiple factors affect pipe deterioration: physical characteristics (diameter, length, depth, material, joint type), installation-construction processes, external factors (soil fracture potential, soil use, and environmental characteristics), and other factors (e.g., age, sewer pipe use, and maintenance methods) (Davis et al., 2001). Recently, other factors have been reported, including climate change, land-use change, and demographic growth (Kleidorfer et al., 2013). Numerous investigations have shown that older pipes have been structurally under-designed and thus do not meet the demands of urban growth. Likewise, past construction practices have been inadequate. These two factors have led to frequent failures in sewer pipes (Sasgrov and Schilling, 2002). In short, underground urban service networks are considered to be complex systems due to the action and interaction of the aforementioned factors (Hao et al., 2012), which have not been thoroughly studied (Lee et al., 2013).
In light of the above, urban system stakeholders are faced with important challenges in order to achieve a rational, efficient, effective, and sustainable management and maintenance of this infrastructure, while also considering the diversity of actors involved (budget limitations, environmental regulations, and urban water infrastructure benefits) (Baik et al., 2006; Cardoso et al., 2012; Younis and Knight, 2012). Globally, some methodologies have been proposed for managing urban drainage systems, namely project CARE-S (Computer Aided Rehabilitation of Sewer and Storm Water Networks), which was integrated by and for various European cities. CARE-S entails methods and models for three levels of long-term sewage management (Sagrov and Schilling, 2002). Mashford et al. (2010) developed a methodology for the city of Adelaide (Australia) using information from CCTV inspections to classify the structural condition of pipes via Support Vector Machines (SVMs) and Artificial Neural Networks (ANNs). Machine learning tools have shown promise for predicting the service condition of sewer networks. These tools are based on a few physical pipe characteristics (diameter, pipe age, type of road over sewer pipelines, slope, and top of pipe level) (e.g., Mashford et al., 2010). Moreover, various studies have shown that classifying through SVMs is adequate, and robust variables with non-linear processes are used. All this, in comparison with conventional methods such as ANNs (Zhang et al., 2009) and Kernel independent component analysis (Zhang et al., 2008).
In many countries, including Colombia, stakeholders have traditionally addressed the maintenance and operation of assets with a reactive focus (that is, acting after the failure). However, reactive maintenance can be significantly costlier than proactive maintenance (Rodríguez et al., 2012). Wirahadikusumah et al. (2001) identify the primary reason for relying on a reactive approach: the lack of monitoring data. For example, in cities such as Bogotá and Medellín, more than 90% of the structural and operational sewer assets are unknown (Hernández et al., 2020). This lack limits the development of predictive models and assessments of the effects of changes in maintenance policies (Rodríguez et al., 2012). Despite the diversity of support models for the proactive maintenance of sewer systems worldwide (Sasgrov and Schilling, 2002; Mashford et al., 2010), the majority assume complete and timely information and, therefore, have only limited applicability in Colombia, given the scarcity and low coverage of sewer inspections, as well as the unsecured quality of any inspections performed (Rodriguez el al., 2012). Thanks to the great advantages of predicting through SVMs reported by the literature and the need to know the structural condition of the whole sewer network, this paper proposes a methodology based on Support Vector Machines to predict the structural condition of uninspected sewer assets. The methodology aims to provide support tools to the stakeholders' decision-making in order to plan rehabilitation and investment strategies. This contributes to developing more rational plans to invest in and rehabilitate the sewer network, leaving reactive maintenance aside and seeking to achieve sewer asset management (proactive maintenance).
Materials and methods
In 2001, a Colombian standard (EAAB, 2001 ) was developed to evaluate already inspected sewer networks via CCTV for the city of Bogotá. This standard assesses structural and operational conditions based on the failure types, as well as their severity, that are found during the inspections, thus assigning a defined score. According to the assessment of structural conditions, all failure scores are added and categorized into a grade for every single pipe. This categorization could be used for decision-making related to rehabilitation and preventive actions (Table 1).
Table 1 Structural states based on structural score NS 058 and description
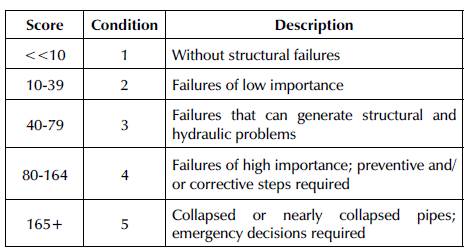
Source: Adapted from EAAB (2001)
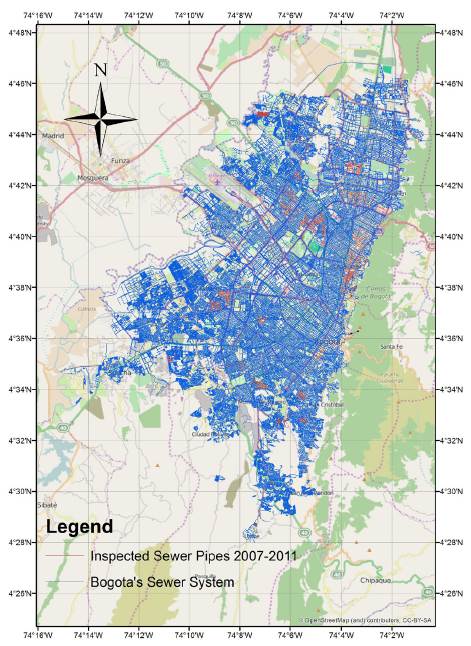
The CCTV data are related to inspections carried out between 2007 and 2011 by Bogota's water and sewerage systems company, (Empresa de Acueducto y Alcantarillado de Bogotá, EAB) (Figure 1). This database contains the following information on the pipe: physical characteristics, location, score (assessment), and structural condition (grade). In total, 3563 inspections of waste and storm water pipes (local and main network) were included in the database.
According to data from the database and the literature (Davis et al., 2001; Kleidorfer et al., 2013), the following variables may be related to the structural condition of pipes: (i) slope, (ii) diameter, (iii) material type, (iv) age, (v) ground level at the beginning of the pipe, (vi) ground level at the end of the pipe, (vii) depth at the beginning of the pipe, (viii) depth at the end of the pipe, (ix) surface type at ground level (x) sewerage, and (xi) geographical coordinates (longitude, latitude). An exploratory statistical analysis of the inspected pipe data was performed to determine the relationship between these variables and the structural condition variable (Kruskal-Wallis test). The variables chosen were categorized to perform statistical tests (e.g., the Wilcoxon test), which require categorical variables. Thus, each variable was categorized according to the 33 and 67 percentiles.
The data did not have a normal distribution or variance homogeneity according to the Shapiro-Wilk and Bartlett tests, respectively. Therefore, the Kruskal-Wallis test was performed. Kruskal-Wallis is a nonparametric alternative to ANOVA and was used to determine which variables significantly influence the structural score of the pipes. According to this test, the variables with significant influence (p-value<0,05) on structural score variability were age, material, slope, diameter, surface type, depth 2, pipe type, longitude, latitude, ground level 1, and ground level 2. With these results, the Wilcoxon test was applied for each chosen variable in order to determine significance difference (p-value<0,05) between variable factors and structural score (Table 2): (i) slope, with significantly lower scores for low slopes (<0,4113); (ii) diameter, with significantly higher scores for pipes with small diameters (< 0,2m) and significantly lower for pipes with large diameter (> 2,4m); (iii) ground level 1 and 2, with significantly higher scores for category "2_medium" ground levels (between 2555-2606 m above sea level); (iv) depth 2, with significantly lower scores for shallow pipes (<1,13 m); (v) age, with significantly higher scores for category "2_medium" (between 30 and 50 years) and significantly lower for category "3_new" (<30 years); (vi) longitude, with significantly higher scores for the city's west side (74,06-74,02°); (vii) latitude, with significantly higher scores for the city center (4,62-4,696°); (viii) surface type, with significantly higher scores for pipes under asphalt pavement; (ix) sewerage, with significantly higher scores for higher local wastewater pipes; and (x) material, with significantly higher scores for vitrified clay.
Table 2 Variable relationships that show significance differences (p-value < 0,05) in the Wilcoxon test.
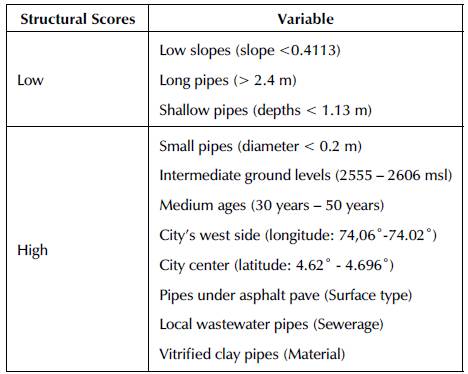
Source: Authors
These results confirm the findings of other studies that estimated variables directly influencing the structural state of pipes. For example, vitrified clay pipes with small diameters had greater structural scores, which is consistent with findings reported in Niño et al. (2012). Similarly, slope and ground level were the variables most closely associated with the structural state of pipes (López-Kleine et al., 2016). Nevertheless, certain tendencies were identified: the cause-effect rules given by the multivariate and nonlinear nature of structural scores cannot be formulated. Thus, tools that account for these characteristics must be utilized, such as SVMs.
SVMs are based on a supervised statistical learning method within the kernel family. This family consists of a class of algorithms for pattern analysis that finds and analyzes general types of relations (e.g., clusters, ranges, principal component correlations, and classifications) in databases (Shawe-Taylor and Cristianini, 2004). With the application of kernel functions, SVMs increase the data dimensionality to find a hyperplane that could separate them correctly (Jahed et al., 2020; Hernández et al., 2021). SVMs are used to solve nonlinear classification problems by means of pattern recognition and function estimation. The principal problem addressed using SVMs is the fit of a function describing a relation between an object X and response Y. Initially, SVMs are used for two-category classifications, where Y is the categorical vector (or binary variable), by using S (the dataset). If the objects are within the P dimension, the relationship is described by Equation (1):
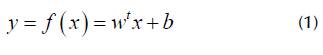
The hyperplane equation is defined by Equation (2):
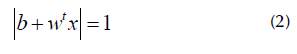
where b is the bias, w a weight vector, and x the support vectors. The distance between * and the hyperparameter is defined by Equation (3), and the hyperparameter margin is defined by Equation (4):
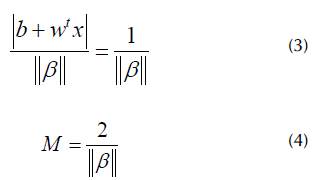
The minimization function that maximizes the hyperparameter margin is defined by Equation (5):
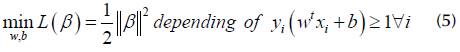
where y is each category, and Lagrange multipliers are used to find the values v," and b (Duda et al., 2012; Huang et al., 2018).
SVMs allow for classifications and regressions with parametric and nonparametric data (Lopez-Kleine and Torres, 2014). The kernlab library (Karatzoglou et al., 2004) was used with R (R Core team, 2019) to build the SVM models. This library has a function that optimizes the hyperparameters of the kernel functions automatically, and the soft margin parameter C is taken as the value default (1).
After statistically analyzing the database, an SVM was used to classify pipes based on variables identified by the Kruskal-Wallis method. Independent variables (slope, age, etc.) of the SVM model must be numerical, and the dependent variable must be categorical (structural state). Still, given that some independent variables are categorical (material and road type), it is necessary to develop analysis alternatives that can be included in the model. These alternatives are the combination of the categorical variables for all variables, so that the database can be divided, that is, two categorical variables (material and road type). In turn, these are constituted by two factors for each one (concrete and vitrified clay pipes for the material; concrete and asphalt pavement for surface type). By using pairwise combination of material and surface type, four possible alternatives were created: (i) vitrified clay pipes under concrete pavement; (ii) vitrified clay pipes under asphalt pavement; (iii) concrete pipes under concrete pavement; and (iv) concrete pipes under asphalt pavement. Doing so guaranteed that there were independent numerical variables and a categorical dependent variable for each alternative.
Furthermore, various structural grades were grouped into categories in line with the research done by Lopez-Kleine et al. (2016). For example, one way of grouping structural grades into two categories would be: Category 1 with grades 1, 2, and 3 representing piped with acceptable structural conditions; and Category 2 with grades 4 and 5, meaning pipes with critical structural conditions. These categories correspond to the dependent variable vector for calibrating SVM models.
Once the previously described four alternatives were defined, each database was randomly divided into data for calibrating each SVM model (2/3 of total data) and data for validation (1/3 of total data). With calibration data for each alternative, SVM classification algorithms were employed with kernel functions whose application is associated with database characteristics. For this study, the characteristics found were as follows: insufficient a priori information for the data (Gaussian and Laplace kernel functions), binary categorization of input data (Vanilla linear function), and a classification that approximates neural networks taken from Mashford et al., (2010).
To arrive at the best classification model for each alternative, two approaches were used: (i) leave-one-out cross validation technique (Greisser, 1993) and (ii) Cohen's kappa coefficient (Carletta, 1996). The first approach was used to train the model with the calibration data, and the second one was used to evaluate the performance of the trained model with the validation data.
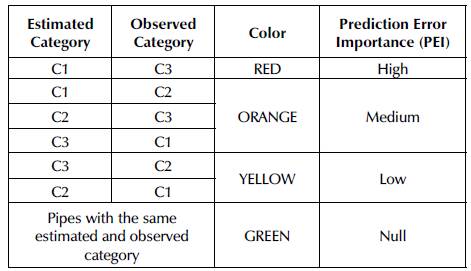
With the purpose of evaluating the performance of the prediction, comparing the estimated and observed categories, the authors suggest to classify the correct and wrong predictions by colors, as well as the Prediction Error Importance (Table 3). The latter (PEI) gives information about the severity of a wrong estimation compared to the observed information. According to Table 2, the percentages that are in 'GREEN' and Null-PEI are the percentage of pipes that were estimated correctly. The percentages in 'YELLOW' and Low-PEI show the percentage of pipes where the model underestimated the structural condition (it means that the model estimated the condition of the pipe in worse structural conditions than they really were). The percentages in 'ORANGE' and Medium-PEI represent the percentage of pipes where the model overestimated the structural condition, it means that the model estimated the condition of the pipe in better conditions than what they actually were. Finally, the percentage in 'RED' and High-PEI represents those pipes whose estimation was highly overestimated; it means that the model estimated those pipes to be in excellent conditions while they were actually collapsed. Table 3 illustrates the possible error importance and the corresponding table of colors if the analysis is divided into three categories (e.g., if C1 corresponds to good structural conditions, C2 to regular structural conditions, and C3 to poor structural conditions).
Table 3 Description of the Prediction Error Importance levels and their corresponding color.
Source: Authors
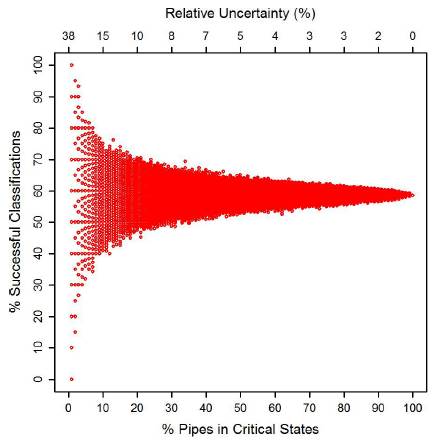
In light of the possible or inevitable financial limitations faced by the company in charge of sewer management, a minimum number or percentage of pipes classified by the tool was established in order to determine which of those were in critical structural conditions and required inspection or action. To this effect, a methodology was proposed to determine the percentage of pipes randomly selected over the total of those classified in a particular category by the tool to ensure that the expected percentage of proper classifications had a relatively acceptable uncertainty (e.g., less than 15%). The methodology consists of randomly selecting a certain percentage of pipes (between 1 and 100%) from those that received a given classification (e.g., good conditions or critical conditions) to apply the proposed tool and calculate the percentage of successful classifications using the inspection database. This process is repeated a given number of times for the same percentage of pipes, and the percentage of successful classifications is calculated each time. It is expected, then, that the dispersion of results obtained (percentage of successful classifications) is high for initial percentages, and that it gradually diminishes as more pipes are selected to finally achieve a null dispersion for 100%.
Results and discussion
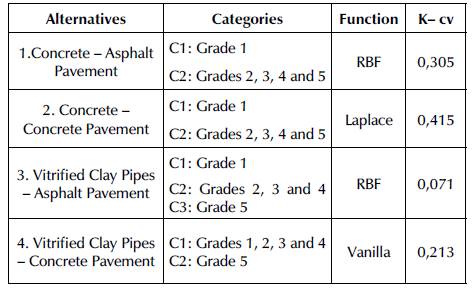
Table 4 shows the functions selected for each analysis alternative according to Cohen's kappa coefficient, which was obtained using leave-one-out cross-validation (CV). This Table also includes category division for alternatives with the highest predictability (higher Cohen's kappa coefficient obtained for the proposed CV). As the Table demonstrates, there are two or three categories for which predictability increases were observed, thus implying that the results are useful for classifying sections in three ways: (i) "excellent conditions" and "not excellent conditions" (C1 and C2, respectively, in alternatives 1 and 2, Table 4); (ii) "critical condition" and "not critical condition" (C2 and C1, respectively, in alternatives 4 and 5); and (iii) "excellent condition", "critical condition" and "nor excellent nor critical condition" (C1, C3, and C2, respectively, in alternative 3, Table 4). Furthermore, the Kernel functions that offer the best results in terms of predicting the classification of the categories of the pipe's structural states were RBF, Laplace, and Vanilla, which implies that the three functions rely on binary classification regardless of whether the function in the characteristic space is linear (Vanilla) or nonlinear (RBF and Laplace).
According to the confusion matrices (calibration and validation data) of the four analysis alternatives, it was found that:
For the first two analysis alternatives (Concrete-Asphalt pavement and Concrete pavement), the calibration data's confusion matrices had similar prediction results (classifying more than 81% of pipes correctly in category C1 and more than 79% in category C2), while the validation data's confusion matrices differ (60 and 68% of pipes were properly classified in C1 and C2, respectively, for the first analysis alternative; and 38 and 80% were properly classified in C1 and C2 for the second analysis alternative). However, the results from the calibration and validation data for the first analysis alternative (Concrete-Asphalt Pavement) are consistent.
For the third analysis alternative (Vitrified clay pipes-Asphalt pavement), according to the calibration data from the confusion matrix, the model correctly classified between 58 and 65% of the three categories; whereas, in the validation data, the best classified category was C3 (50% match), followed by C2 (18%) and C1 (0%). This means that the model overestimated pipes in category C3 (classifying all pipes in excellent condition when, in reality, they were in critical structural conditions), and underestimated pipes in category C1 (the pipes were worse than they actually were).
For the last analysis alternative (Vitrified clay-Concrete pavement), the results were similar to those of the first analysis alternative (Concrete-Asphalt pavement). The model classified approximately 70% of pipes in C1 and C2 in calibration and validation results.
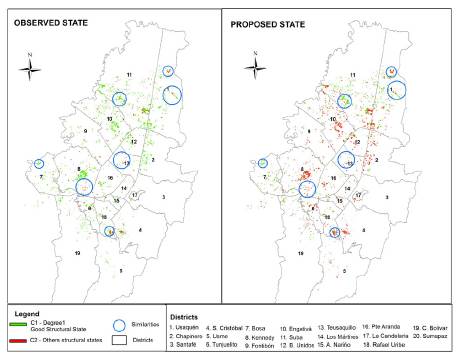
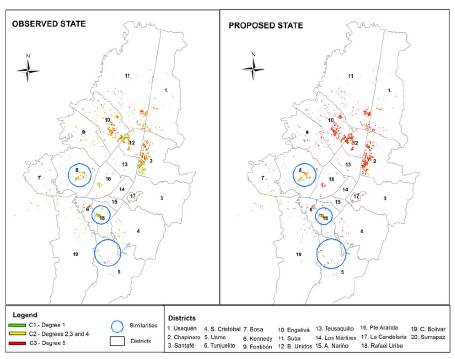
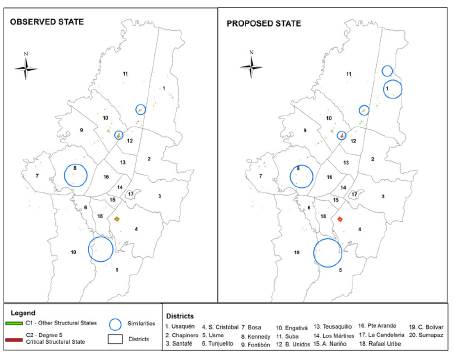
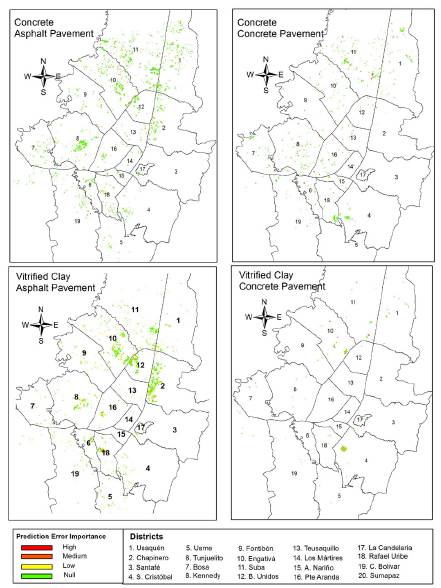
In Figures 2, 3, and 4, maps of the pipes inspected in Bogotá are shown. In these Figures, the observed categories are compared to those obtained using SVM models.
Source: Authors
Figure 2 Category classification maps for inspected sewer pipes in Bogotá for alternatives (i) concrete pipes-asphalt pavement and (ii) concrete pipes-concrete pavement. Left: classification map of observed condition. Right: classification map of results when using the proposed methodology.
Source: Authors
Figure 3 Category classification maps for inspected sewer pipes in Bogotá for vitrified clay-asphalt pavement. Left: classification map of observed condition. Right: classification map of results when using the proposed methodology.
Source: Authors
Figure 4 Category classification maps for inspected sewer pipes in Bogotá for vitrified clay-concrete pavement. Left: classification map of observed condition. Right: classification map of results when using the proposed methodology.
Figure 2 demonstrates that, for these two alternatives, the structural condition of several pipes was underestimated by the proposed methodology. However, in certain parts of Bogotá (namely in the districts of Suba, Usaquén, Teusaquillo, Kennedy, Puente Aranda, and Bosa), the sewer's SVM-estimated overall condition matched the observed state. Moreover, in general terms, there were greater matches for categories classified as C1 by the proposed SVM. This finding suggests that the proposed methodology has potential applications for sewer system management in that it indicates which pipes are in excellent structural condition (category C1, corresponding to grade 1 in the NS-058 standard) because management efforts (inspection, rehabilitation, replacement, etc.) can be carried out only on pipes that are not classified as C1 by the SVM models. A similar behavior was observed for the proposed SVM models for vitrified clay pipes (Figures 3 and 4).
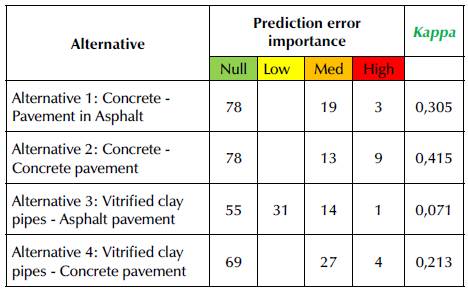
In Figure 5, the prediction error importance is seen to be generally null or low (green and yellow pipes). In other words, for the majority of pipes, the categories obtained using the proposed methodology matched the categories observed (green), or the methodology underestimated the condition of the pipes (yellow or orange). Few pipes saw their structural state overestimated (red). In short, the proposed methodology proves to be conservative (more underestimation than overestimation), which is a plus from a safety perspective when it comes to deciding which pipes require priority management action. Table 4 summarizes the results presented in Figure 5.
Source: Authors
Figure 5 Prediction error importance maps for sewer pipes in Bogotá for the four proposed alternatives. Upper left: (i) concrete-asphalt pavement. Upper right: (ii) concrete-concrete pavement. Lower left: (iii) vitrified clay pipes-asphalt pavement. Lower right: (iv) vitrified clay pipes-concrete pavement .
In Figure 5, the prediction error importance is seen to be generally null or low (green and yellow pipes). In other words, for the majority of pipes, the categories obtained using the proposed methodology matched the categories observed (green), or the methodology underestimated the condition of the pipes (yellow or orange). Few pipes saw their structural state overestimated (red). In short, the proposed methodology proves to be conservative (more underestimation than overestimation), which is a plus from a safety perspective when it comes to deciding which pipes require priority management action. Table 4 summarizes the results presented in Figure 5.
Table 5 Percentage of pipes per category for prediction error importance of each alternative
Source: Authors
Table 5 shows that more than 78% of sewer pipes presented a null or low prediction error importance. Low prediction importance is considered favorable for decision-making related to sewer management, provided that the percentage of pipes is not high. Despite the improper classification of some pipes, these were classified in the next most critical category. This suggests that, if these pipes were reviewed, they would likely be in better structural states than expected. It should be noted that low importance prediction error is possible when the selected model has more than two structural categories, as is the case for alternative 3 (vitrified clay pipes under asphalt pavement). Nevertheless, broadly speaking, satisfactory pipe classification was observed for the first three alternatives, with a successful classification between 78 and 86%. For the fourth alternative, this figure was 69%. Moreover, the percentage of pipes with high prediction error importance was less than 4% for all the alternatives studied, with the exception of alternative 2 (9%).
The results presented in Table 5 do not suggest a direct relation between proper classification with the proposed methodology for each alternative and the corresponding Cohen kappa coefficient, which implies that the latter is only useful for model selection.
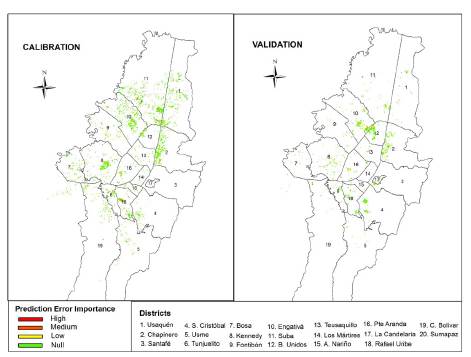
The previously mentioned results represent the combination of results obtained for both calibration and validation databases. To distinguish the results obtained for the two databases, as well as to judge the predictive capacity of the proposed methodology, readers are directed to Figure 6.
Source: Authors
Figure 6 Prediction error importance for the calibration (left) and validation (right) databases
Figure 6 evinces consistency among the results obtained for both databases (calibration and validation) in terms of prediction error importance. As was the case for the results shown in Figure 5, the majority of sewer pipes analyzed in both databases had null (green) or low prediction importance (yellow). Table 6 summarizes this information.
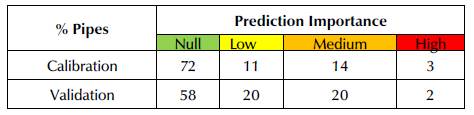
Table 6 Prediction error importance of the proposed methodology's classification in calibration and validation databases
Source: Authors
In Table 6, for the calibration data, 72% of pipes were properly classified (null prediction error importance-green), and 11% of pipes were improperly classified, but with a low prediction error importance (yellow). Therefore, it can be said that, for the calibration database, the proposed SVM classification methodology provided satisfactory results for 83% of the pipes. Similarly, for the validation data, satisfactory classifications were obtained for 78% of analyzed pipes, thus opening the possibility of utilizing the proposed SVM classification methodology for sewer management decision-making to improve inspection processes, as well as maintenance, rehabilitation, and replacement. The validation data (78%) represent the proposed tool's performance concerning classifying the structural state of uninspected concrete or vitrified clay pipes.
Although the results obtained are satisfactory for managing of Bogotá's sewer systems, it is essential not to lose sight of the limited public resources available for developing these activities. Rodríguez et al. (2012) discuss the budget for actions related to sewer pipe management, attributing the low inspection coverage in Bogotá to a meager budget that is too low to inspect all of the city's sewer pipes. In light of these restrictions, it is crucial to determine the percentage of the minimum number of pipes that should be selected (e.g., those that the proposed methodology classified in a critical structural state) to ensure a percentage of proper classifications with a satisfactory level of uncertainty (e.g., relative uncertainty < 15%). This may serve a host of objectives, such as directing CCTV inspections as effectively as possible within budget constraints.
The proposed methodology was applied to a case study to select the minimum number or percentage of pipes classified via SVMs as being in critical structural states for purposes of inspection or action. Ten thousand random selections were performed for each percentage (1 to 100%, with 1% variations) of the total number of pipes in a critical structural state when applying the SVM classification methodology. The results of this case study can be found in Figure 7. This Figure demonstrates that (i) pipes in critical structural states were properly classified roughly 60% of the time by the methodology; and (ii) to obtain a relative uncertainty less than 15% of proper classifications, at least 10% of total pipes classified in this state must be randomly selected. According to the above, it is safe to say that decision-making regarding pipes that require inspection or action can be performed while meeting the budget assigned to these tasks. However, it must be clarified that the percentage of pipes selected is a decision to be made by stakeholders, and it requires the consideration of multiple variables (e.g., financial variables). Regardless, the results in Figure 7 offer an accurate depiction of the analyzed case study.
Conclusions
In this article, the structural state of sewer pipes in a specific case study (database of pipes inspected via CCTV in Bogotá between 2007 and 2011) is shown to be related to physical characteristics, location, and pipe age. These findings match the results of previous studies on the same database (Niño et al., 2012; López-Kleine et al., 2016).
A methodology for classifying the structural state of uninspected sewer pipes using SVMs was developed. The proposed methodology employed SVM functions, CV techniques, and an evaluation of results with Cohen's kappa coefficient. This coefficient proved to be especially useful for objectively selecting the best classification mode, for it emphasized model predictability and avoided overtraining.
When applied to the case study, this methodology correctly classified 78% of the inspected pipes (relative to validation data). Additionally, the results obtained were satisfactory; the methodology identified pipes in critical structural states with a low prediction error importance for 69% of the pipes studied. This provides an opportunity to develop more rational management strategies from a financial perspective for companies that provide sewer services and facilitate decision-making in system management for pipe inspection and action. Furthermore, this methodology identified which pipes require inspection or action based on the relative uncertainty of the expected percentage of proper classifications.
Comparing this methodology's results to those of López-Kleine et al. (2016), it can be confirmed that better results are achieved when grouping structural states in a few groups that discriminate extreme structural states in the pipes.
In this study, other types of materials present in sewer networks (such as masonry and PVC) and other types of road (green surfaces or non-paved firm surfaces) over the sewer network were omitted because pipes with these configurations were not found in the inspection database provided by EAB.
In conclusion, the authors recommend that future studies use complete information on the types of roads over sewer pipes that have not been inspected in Bogotá, seeing as the methodology proposed in this paper could incorporate this information to classify all pipes in the city's sewer system.

