Servicios Personalizados
Revista
Articulo
Indicadores
-
 Citado por SciELO
 -
 Accesos
Links relacionados
-
 Citado por Google
 -
 Similares en
SciELO
 -
 Similares en Google
Compartir
Revista Facultad de Ingeniería Universidad de Antioquia
versión impresa ISSN 0120-6230
Rev.fac.ing.univ. Antioquia no.78 Medellín mar. 2016
https://doi.org/10.17533/udea.redin.n78a12
DOI: 10.17533/udea.redin.n78a12
ARTÍCULO ORIGINAL
Adjustable spatial resolution of compressive spectral images sensed by multispectral filter array-based sensors
Resolución espacial ajustable de imágenes espectrales comprimidas muestreadas por sensores basados en arreglos de filtros multiespectrales
Yuri Hercilia Mejía-Melgarejo, Ofelia Patricia Villarreal-Dulcey, Henry Arguello-Fuentes*
Facultad de Ingenierías Fisicomecánicas, Universidad Industrial de Santander. Carrera 27 Calle 9. C. P. 680002. Bucaramanga, Colombia.
* Corresponding author: Henry Arguello Fuentes, e-mail: henarfu@uis.edu.co
ISSN 0120-6230
e-ISSN 2422-2844
(Received June 18, 2015; accepted January 20, 2016)
ABSTRACT
Spectral imaging systems capture spectral and spatial information from a scene to produce a spectral data cube. Technical progress has allowed developing multispectral filter array (MSFA)-based sensors in order to expand the reconstruction of more bands than RGB cameras. However, reconstructing the spectral image with traditional methods following a least squares or demosaicing approach is unfeasible. Some works in the literature implement multispectral demosaicing for reconstructing images with specific spatio-spectral resolution depending on the number of pixels in the detector and the filter mosaic. Recently, compressive sensing technique has been developed that allows reconstructing signals with fewer measurements than the traditional methods by using the sparse representation of a signal. The selection of neighborhoods pixels in the MSFA-based sensor to calculate the spectral response of a single pixel in the reconstructed spectral images could improve the reconstruction, based on exploiting the sparse representation of the spectral images. This paper proposes two models for spectral images reconstruction from the selection of MSFA-based sensor measurements neighborhoods using the principle of compressive sensing. The spatial resolution of the reconstructed spectral images is adjusted depending the size of the neighborhood. To verify the effectiveness of the reconstruction models simulated measurements for synthetic spectral images and real spectral images based on MSFA are used. Ensembles of random dichroic and random band pass filters are used. The two approaches with traditional scheme reconstructions of mosaic filters are compared. The proposed methods improve the quality (PSNR) of the image reconstruction up 7 dB for real spectral images.
Keywords: Spectral images, multispectral filter array-based sensors, compressive sensing
RESUMEN
Los sistemas de adquisición de imágenes espectrales capturan la información espectral y espacial de una escena para producir un cubo de datos. El avance tecnológico ha permitido desarrollar sensores basados en arreglos de filtros multiespectrales (MSFA, de su sigla en inglés) con el propósito de expandir la reconstrucción de las cámaras RGB a más bandas. Sin embargo, reconstruir la imagen espectral con los métodos tradicionales siguiendo una aproximación de mínimos cuadrados es inviable. Algunos trabajos en la literatura implementan interpolaciones multiespectrales para reconstruir imágenes con resoluciones espectrales y espaciales específicas que dependen del número de pixeles en el detector y el mosaico de filtros. Recientemente ha surgido la técnica de muestreo compresivo que permite reconstruir señales con menor cantidad de medidas que los métodos tradicionales usando la representación dispersa de la señal subyacente. La selección de vecindarios de pixeles en el sensor basado en MSFA para calcular la respuesta espectral de un único pixel en la reconstrucción podría mejorar la reconstrucción, explotando las características de dispersión en las imágenes espectrales. En este trabajo se proponen dos modelos que usan el principio de muestreo compresivo, para la reconstrucción de imágenes espectrales, a partir de la selección de vecindarios de pixeles de sensores basados en MSFA. La resolución espacial de la reconstrucción se ajusta dependiendo del tamaño del vecindario. Para verificar la efectividad de los modelos de reconstrucción se usan medidas simuladas de imágenes espectrales sintéticas e imágenes espectrales reales. Para obtener las medidas se usan un conjunto aleatorio de filtros dicroicos y pasabanda. Se comparan los dos enfoques con las reconstrucciones del esquema tradicional de mosaicos de filtros. El método propuesto mejora la calidad (PSNR) de la imagen hasta en 7 dB para las pruebas con imágenes espectrales reales.
Palabras clave: Imágenes espectrales, sensores basados en arreglos de filtros multiespectrales, muestreo compresivo
1. Introduction
Spectral imaging senses a scene where at every location of the image plane the spectral information is collected. The applications of spectral images are many and cover ocean research, food safety, geology, and medical. Some examples of these applications involve the characterization of phytoplankton in the ocean [1], quality evaluation in the area of food safety [2], plant stress assessment [3], characterization of different bacterial colonies [4], disease diagnosis, and image-guided surgery [5].
In some spectral images, the scene is beamsplit into the desired wavelength components by using a prism assembly, and each of these images is captured in a separate detector array. Although this method provides the highest resolution, the sensing devices have significant size and weight disadvantages [6]. Most of the spectral images acquisition methods are related to scanning operations where multiple exposures are used causing motion artifacts [7].
On the contrary, some sensing techniques use multispectral filters and collect multiple wavelength spectra from a single detector array [8]. Nowadays, optical coatings technologies have been miniaturized and optimized such as the creation of multispectral filter arrays (MSFA), with traditional design and manufacturing methods, is allowed [6]. The optical coatings production methodology combines modern optical thin film deposition techniques with microlithography procedures. This process enables micron-scale precision patterning of optical thin film dichroic coatings on a single substrate. A dichroic filter is an accurate color filter used to selectively pass light of a small range of wavelengths while reflecting other wavelengths.
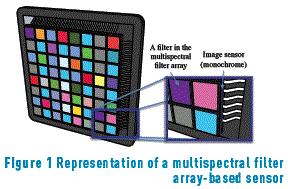
Figure 1 shows a schematic representation of an MSFA-based sensor, that is a monochrome image sensor covered with a MSFA; each pixel in the sensor measures only some spectral components in a specific spatial location.
Since there are only some wavelength elements available in each pixel, the missing wavelength elements must be estimated from the adjacent pixels. This process is called multispectral demosaicing, and in most cases, it is carried out depending on the specific acquisition process. For example, [9] generate a MSFA following a binary tree-based method, which starts from a checkerboard pattern. Then, they design a demosaicing algorithm based on the same binary tree. In [10] propose a MSFA that consists of color filter blocks of size 3×2 pixels, this configuration allows a fast bilinear interpolation to be used with a reconstruction up to 6 spectral bands. In [11] propose a five-band MSFA. For demosaicing, an adaptive kernel can be estimated directly from the raw data. Consequently, a common feature of these systems is that the MSFA design depends on application and the number of spectral bands. The maximum number of spectral bands achieved in the literature is at most 6.
Furthermore, Compressive Sensing (CS) has emerged as a rising research area that allows the acquisition of signals at sampling rates below the Nyquist-criterion. In CS traditional sampling is substituted by measurements of random projections of the signal. The signals are then reconstructed by solving an l1-l2 minimization problem. CS exploits the fact that spectral images can be sparse in some basis representation.
Mathematically, a multispectral image  on its vector representation
  , with M=N2L, can be expressed as f=Ψθ, where θ is the coefficients sequence with only S non-zero elements that represents f, and Ψ is a representation basis. Therefore, f is a linear combination of just S base vectors, with S << M. Here, N×N represent the spatial dimensions, and L the number of spectral bands in the data cube. Compressive sensing allows f to be recovered from m random projections when m≥S log(M)<<M.
Assuming that the MSFA-based sensor performs a linear measurement process that calculates m<<M internal products between f and a set of vectors {hj}j=1m, as yi= <f,hj>, then y=Hf, where the yi projections form the vector y of m elements, that is for i=0,…,m-1; H is the measurement matrix formed by the columns hj, with dimensions m×M; and f is the original signal of size M. For recovering f from y, there exist infinite solutions due to the size of y is much less than the size of f.
Following the sparse representation of the signal, and the MSFA-based sensor, measurements can be expressed as y=Hf=HΨθ=Aθ, where A=HΨ ∈  is the sensing matrix. This underdetermined system of linear equations can be solved if the measurement matrix H is incoherent with the representation basis Ψ. The data cube is then reconstructed as
  , where θ is an S-sparse representation of f on the basis Ψ, and τ is a regularization constant.
Recently, two works propose demosaicing process by CS theory. In [12] use a MSFA of 4 spectral bands (Red-Green-Blue-NIR), similar to the traditional RGB. The difference is that the two green filters have different transmittances. Also, a mixture of one color channel and NIR is captured at each spatial position on the sensor. For demosaicing task, they use a CS approach to separate the NIR of the color bands, after that, a traditional RGB demosaicing is performed. In [13] explore the problem of CS reconstruction of multispectral images acquired with a single sensor architecture. They propose random and uniform filter array designs. For reconstruction they use group-sparse optimization and Kronecker product between Fourier and Wavelet basis as CS formulation.
Traditional methods implement multispectral demosaicing for reconstructing images with specific spatio-spectral resolution depending on the number of pixels in the detector and the filter mosaic. The selection of neighborhoods pixels in the MSFA-based sensor (measurements) to calculate the spectral response of a single pixel in the reconstructed spectral images could improve the reconstruction, based on exploiting the sparse representation of the spectral images. The size of neighborhoods leads to an adjustable spatial resolution in the reconstruction preserving the filters spectral resolution, reconstructing a spatial decimated data cube. This information can be used in applications demanding higher spectral than spatial image quality, also for a quick view of the scene, for instance, in transmission and communication applications.
This paper proposes two models for adjustable spatial resolution reconstruction of multispectral images from the selection of MSFA-based sensor measurements neighborhoods using the principle of compressive sensing. These methods are based on measurements taken in an architecture that includes an MSFA-based sensor. Each spectral filter modulates the data before it impinges onto the sensor using a random dichroic or random band pass filter. CS theory is then exploited to recover the underlying 3D spectral data cube from the compressed data captured in a single shot. The quality of the reconstructions is analyzed based on the number of spectral bands, and the size of the neighborhoods. For that, the paper is organized as follows: in the section 2 the acquisition model is detailed, section 3 describes the traditional demosaicing reconstruction approach, section 4 shows two approaches for reconstruction with adjustable spatial resolution using compressive sensing theory, section 5 describes the multispectral filter design, section 6 presents the results.
2. Spectral image acquisition
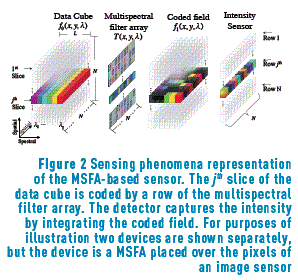
Figure 2 shows the physical sensing phenomenon in the multispectral filter array-sensor system for L=6 spectral bands and focusing in the jth-slice, that is, in a (x,λ) plane for y=j. For purposes of illustration the Figure 2 shows two optical elements separately, but the device is a MSFA placed over the pixels of an image sensor. First, the MSFA, represented as T(x,y,λ), modulates the spatio-spectral data cube f0 (x,y,λ), resulting in the coded field f1 (x,y,λ) where (x,λ) are the spatial coordinates, and λ is the wavelength. Then the coded density impacts on the sensor. The coded density integrated into the detector can be expressed as (1)

where T(x',y',λ) is the transmission function representing the MSFA, and h(x'-x,y'-y) is the optical response of the system.
The source f0 (x,y,λ) can be written in discrete form as  where i and j index the spatial coordinates, and k determines the kth spectral plane. Let T(i,j,k) ∈{0,1} be the MSFA discretization. Then the discretized MSFA-based sensor measurements can be expressed as (2)

where Yi,j is the intensity at the (i,j)th position of the detector, i,j=0,1,…,N-1,  is an N×N×L spectral data cube, and ωij is the white noise of the sensing system.
The measurements Yi,j in (2) can be written in matrix notation as (3)

Where y is an N2-long vector representation of Yi,j,  is the vector representation of the data cube
  where fk is the vectorization of the kth spectral band.
The output y in (3) can be extended as (4)

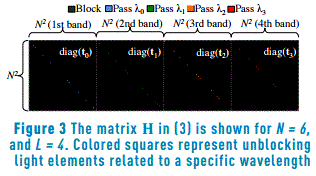
where tk is the vectorization of the kth MSFA plane, more specifically (tk)i=T(⌊i/N⌋, i-⌊i/N⌋N, k), for i=0,…,N2-1; diag(tk)_ is an N2×N2 diagonal matrix whose entries are the elements of tk. Figure 3 depicts a random MSFA based matrix H for N=6, and L=4.
3. Traditional demosaicing
Given the set of measurements, a traditional demosaicing algorithm estimates for each reconstructed pixel the intensities for all wavelength components. In traditional cases, measurements are taken for a mosaic of multispectral filters, where a mosaic comprises a particular arrangement of filters designed subject to the number of spectral bands to sense. The most commonly used configuration is the Bayer filter for RGB images [10]. For reconstruction, common approach minimizes the linear mean square error between the measurements and the vector estimation multiplied by the sensing matrix. More specifically, the estimated signal is given by (5)

A closed-form solution to (5) is given by (6)

where H† is known as the pseudoinverse of H, and HT is its transpose. For comparison purpose this approach is implemented in this paper.
4. Approaches for reconstruction with adjustable spatial resolution
Notice that the methods explained in this section are carried out after the sensing process. Thus, the resolution of the sensor remains fix; however, these methods allow reconstructing spectral data cubes with different resolutions. For exploiting CS theory and the measurements of the MSFA-based sensor two approaches are proposed for reconstructing a data cube with an adjustable spatial resolution. Both are related to selecting a neighborhood of q×q pixels for reconstructing a single pixel. The q parameter is selected at the time to reconstruct the data cube, q refers to the neighborhood side size. In the first model all the N×N pixels of the sensor (measurements) are taken for reconstructing a N×N×L data cube following of a spatial average decimation for the given size of the neighborhood. The second model selects neighborhoods of measurements and reformulates the CS reconstruction problem for reconstructing a  data cube.
4.1. Complete data cube reconstruction followed by a decimation operation
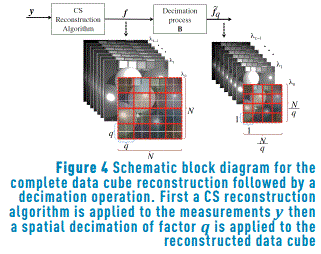
The trivial approach to adjust the images resolution consists of reconstructing a data cube with the highest resolution using the measurements y, after that performing a decimation operation over the reconstructed data cube. This process demands a very high computational cost since it is required to reconstruct a data cube with the highest resolution in the first step. More specifically, first a complete data cube is reconstructed solving the l1-l2 minimization problem given by  , where y is the vectorized measurements given by Eq. (3), H is the measurement matrix defined in the Eq. (4), θ is an S-sparse representation of f on the basis Ψ, and t is a regularization constant [14]. Then, for using the neighborhood approach the data cube spatial resolution is adjusted following an average decimation matrix operation. This operation is applied to the reconstructed data cube as
  , where B represents a block averaging of size q×q in each spectral band reducing the size of the vectorized reconstructed data cube to
  , and q is the side size of the neighborhood. Figure 4 illustrates a schematic block diagram of the process.
The spatial decimation matrix element-by-element can be expressed as (7)

4.2. Reconstruction based on neighborhood measurements selection
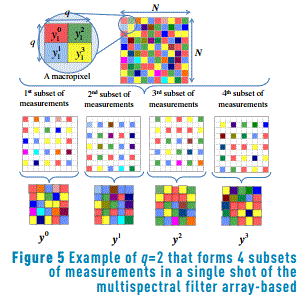
This model uses the assumption that q×q neighboring pixels, in a N×N×L spectral image, have the same spectral response. Unlike the previous method, this approach reconstructs the decimated data cube directly, exploiting the sparsity of the spectral image. Then q×q neighborhood measurement pixels in the sensor are regrouped for the reconstruction of a single pixel spectral response in a decimated reconstruction. For instance, Figure 5 shows the set of measurements taken for q=2, in total q2 subsets of measurements are grouped in a single shot of the MSFA-based sensor.
In the reconstruction model each subset of measurements is formed by the matrix product between a regrouping matrix and the total measurements, more specifically, each subset is given by (8)

where  does a selection in each q×q neighborhood of pixels for taken q^2 different subsets of the total measurements, and
  is the
  subset of measurements where
  ∈{0,…,q^2-1}. Notice that q is a parameter that can be selected by the user. Precisely, the function of the regrouping matrix
  is selecting in each q×q neighborhood of measurements the
  -element for forming the
  -subset of measurements. The regrouping matrix element-by-element can be expressed as (9)

where i=0,1,…, , j=0,1,…,N2-1, and
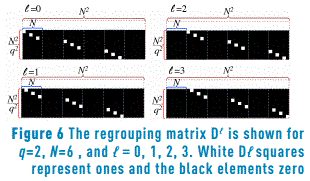
  =0,1,…,q2-1. Figure 6 depicts the regrouping matrix
  for q=2, N=6, and
  =0,1,2,3.
In this case, the complete set of measurements is rearranged as (10)

where the subjacent data cube projection is also reconstructed solving an l1-l2 minimization problem. However, in this case the regrouping process is taken into account. More specifically, the optimization problem is given by  , where y is given by Eq. (10), Hq is the measurement matrix defined as
  , θ is an S-sparse representation of a
  version of f on the basis Ψ, and τ is a regularization constant [14].
In summary, Figure 7 shows a block diagram of the three approaches that are compared in this paper.
5. Multispectral filter design
The quality of the reconstructed data cubes depends on the selection of the multispectral filter design used for sensing the spectral images. For developing this work, two MSFA were selected. First, a spectral response for pixel that can be selected randomly from a set of band-pass filters; and second, dichroic filters, that is a special case of random band-pass where its spectral response lets pass only one spectral band for each sensor pixel.
The spectral response of a  band-pass filter can be defined as (11)

for k=0,…,L-1, i=0,…,N2-1, and  =
= ∈{0,…,L-1}. For instance, L=4,
  =2, and
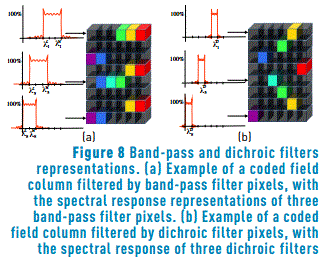
  =3 define the spectral response of the spatial position i=1 as (tk)1=[0 0 1 1]. Figure 8(a) depicts an example of a coded field column filtered by band-pass filters, with representations of the spectral response of three band-pass filter pixels.
Dichroic filters are a special case of band-pass filters that let pass only one spectral band. Then the spectral response of a  dichroic filter pixel can be defined as (12)

for  ∈{0,…,L-1}, and i=0,…,N2-1. For example, if L=4, and
  =3, then the spectral reponse of the spatial position i=5 in the vectorized MSFA is (tk)5=[0 0 0 1]. Figure 8(b) depicts an example of a coded field column filtered by dichroic filter pixels, with representations of the spectral response of three dichroic filter pixels.
6. Simulations and results
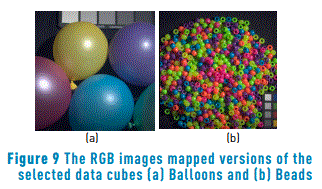
To verify the MSFA-based sensor reconstructions, a set of compressive measurements is simulated using the model of Eq. (2). These measurements are constructed employing two spectral images captured with a CCD camera Apogee Alta U260 and a VariSpec liquid crystal tunable filter, in the range of wavelength 400nm-560nm, with steps of 10nm [15]. The resulting test data cubes have 512×512 pixels of spatial resolution and L=16 spectral bands. The RGB images mapped versions of the selected data cubes are shown in Figure 9. The experiments were carried out using the images Balloons and Beads with a decimation processing for creating synthetic ones and in their real form. Compressive sensing reconstruction is implemented using the GPSR algorithm [16]. Simulations results are analyzed in terms of PSNR (Peak-Signal-to-Noise-Ratio) of the reconstructed images. The representation basis Ψ is a Kronecker product Ψ=Ψ1⊗Ψ2, where Ψ1 is the two-dimensional-wavelet Symmlet-8 basis and Ψ2 is the cosine basis. The simulations are performed in a desktop architecture with an Intel Core i7 3.6GHz processor, 32GB RAM, and using Matlab R2014a. Each experiment is repeated ten times and the respective results are averaged.
6.1. Synthetic multispectral data cubes
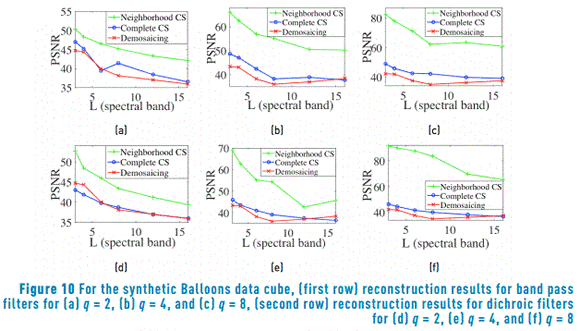
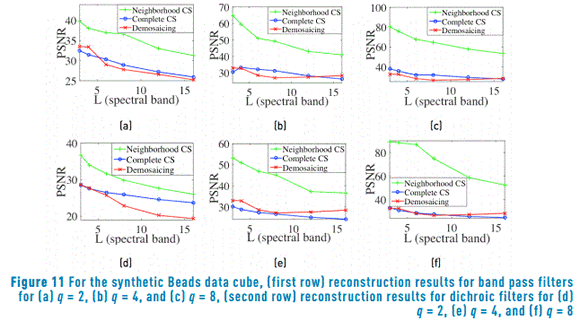
When the input data cube fits the neighborhood measurements selection model the reconstructions outperform the traditional demosaicing approach. To illustrate this phenomenon, synthetic multispectral data cubes based on Balloons and Beads images are constructed. For that, an average decimation of factor q followed of a duplication of q pixels is applied in each spectral band. Then the synthetic data cubes satisfy the assumption that some neighboring pixels attain the same spectral response. Ensembles of dichroic and band pass filters based on a random selection of spectral bands are used for obtaining measurements. For comparison, a demosaicing traditional process using dichroic filters mosaics is implemented, after performing the reconstruction an average decimation matrix is applied to the reconstructed data cube. Figure 10 shows a comparison of the average PSNR reconstruction, for the synthetic Balloons data cubes, as a function of the number of sensed and reconstructed spectral bands. The first row is related to the reconstructions of measurements sensed with an ensemble of band pass filters. The frequency response of the bandpass filter is selected at random. The second row depicts the results from random dichroic filters measurements. The columns are associated to the reconstruction varying the neighborhood size to q=2,4,8. For example, Figure 10(a) shows the results for band pass filters with a neighborhood of q=2, and Figure 10(f) the results for dichroic filters with a neighborhood of q=8. The PSNR evaluation is calculated between the reconstructed image and a spatial decimated version (of size N/q×N/q×L) of the test data cube. Figure 11 shows similar results for synthetic Beads. In all the cases, with increasing the number of spectral bands decreases the PSNR. Furthermore, it is possible to observe the improvement of the reconstruction based on neighborhood measurements selection method (neighborhood CS) compared to the decimation of a complete data cube reconstruction method (complete CS) and the traditional demosaicing method, when the data cube has the property of having similar spectral signature in a neighborhood q×q.
6.2. Experiment with real multispectral data cubes
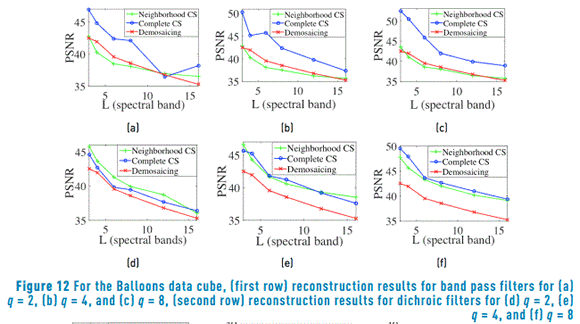
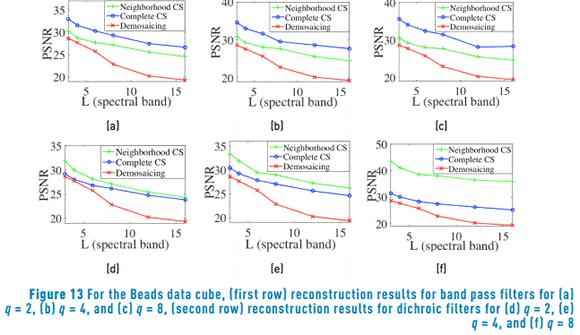
In this case, the measurements are simulated using L spectral bands of real data cubes. Ensembles of dichroic and band pass filters based on a random selection of spectral bands are used to obtain measurements. Figure 12 shows a comparison of the average PSNR reconstruction for the Balloons data cube. Figure 13 shows similar results for PSNR reconstructions in the Beads data cube. It can be observed in Figure 12 and Figure 13 that the performance of the CS proposed methods improves when the size of the neighborhood q is increased. Additionally, the reconstruction based on neighborhood measurements selection method (neighborhood CS) approach has a better performance than the traditional demosaicing approach with the measurements captured with dichroic filters. On the contrary, the decimation of a complete data cube reconstruction (complete CS) takes advantage of band pass filters.
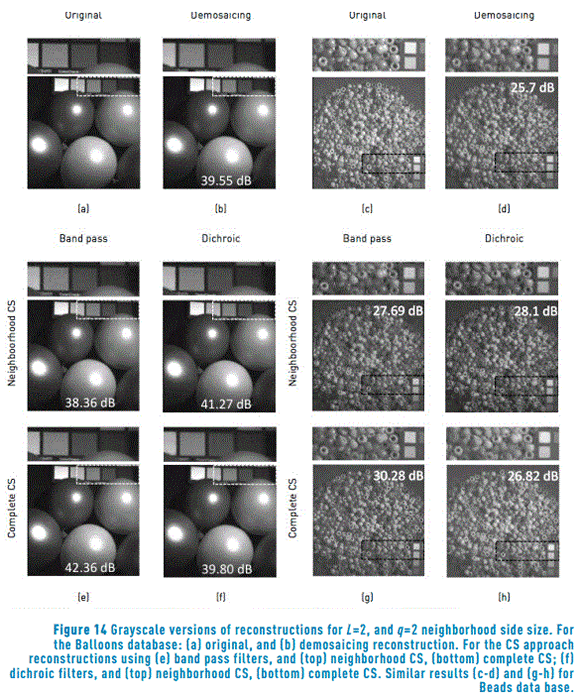
Figure 14 illustrates the whole reconstructed data cubes mapped in grayscale, for L=6, and q=2 neighborhood side size. For the Balloons database, it can be observed that the reconstruction of measurements taken for the random dichroic filter ensemble using the neighborhood CS approach provides an improvement of up 1.72dB in PSNR over the demosaicing approach. Furthermore, the PSNR reached by the complete CS reconstruction using band pass filters is 2.81dB higher than the demosaicing reconstructions. For the Beads database, the reconstruction of neighborhood CS using dichroic filters improves up 2.4dB over the demosaicing, and the complete CS using band pass filter up 4.58dB.
7. Conclusions
Two models for CS reconstruction of spectral images sensed by MSFA-based sensors using a neighborhood approach are presented. The first model reconstructs a complete data cube and applies neighborhood decimation. The second model performs a selection of measurements subsets to form neighborhoods that have spectral information of a single reconstructed pixel. The two CS reconstruction approaches are compared with a traditional demosaicing reconstruction method. For the CS reconstruction, the PSNR increases with the neighborhood side size. The improvements range from 0.5 dB to 7 dB with respect to the traditional approach in real data cubes. Results show that increasing the number of spectral bands decreases the PSNR for all reconstruction methods.
8. Acknowledgments
The authors gratefully acknowledge to the Vicerrectoría de Investigación y Extensión of the Universidad Industrial de Santander for supporting this research registered under the project title: Detección y Clasificación en imágenes espectrales obtenidas a través de un sistema de adquisición compresivo con un detector de un solo pixel, (VIE 1802 code).
9. References
1. J. Ryan, C. Davis, N. Tufillaro, R. Kudela and B. Gao, "Application of the Hyperspectral Imager for the Coastal Ocean to Phytoplankton Ecology Studies in Monterey Bay, CA, USA", Remote Sens., vol. 6, no. 2, pp. 1007-1025, 2014. [ Links ]
2. Z. Xiong, A. Xie, D. Sun, X. Zeng and D. Liu, "Applications of hyperspectral imaging in chicken meat safety and quality detection and evaluation: a review", Crit. Rev. Food Sci. Nutr., vol. 55, no. 9, pp. 1287-1301, 2014. [ Links ]
3. G. Bellante, S. Powell, R. Lawrence, K. Repasky and T. Dougher, "Aerial detection of a simulated CO2 leak from a geologic sequestration site using hyperspectral imagery", Int. J. Greenh. Gas Control, vol. 13, pp. 124-137, 2013. [ Links ]
4. M. Mehrübeoglu, G. Buck and D. Livingston, "Differentiation of bacterial colonies and temporal growth patterns using hyperspectral imaging", in SPIE Optics + Photonics (vol. 9222 Imaging Spectrometry XIX), San Diego, USA, 2014. [ Links ]
5. G. Lu and B. Fei, "Medical hyperspectral imaging: a review", J. Biomed. Opt., vol. 19, no. 1, pp. 1-23, 2014. [ Links ]
6. J. Barrie, K. Aitchison, G. Rossano and M. Abraham, "Patterning of multilayer dielectric optical coatings for multispectral CCDs", Thin Solid Films, vol. 270, no. 1-2, pp. 6-9, 1995. [ Links ]
7. Z. Frentress, L. Young and H. Edwards, "Field Photometer with Nine-Element Filter Wheel", Appl. Opt., vol. 3, no. 2, pp. 303-308, 1964. [ Links ]
8. P. Lapray, X. Wang, J. Thomas and P. Gouton, "Multispectral Filter Arrays: Recent Advances and Practical Implementation", Sensors, vol. 14, no. 11, pp. 21626-21659, 2014. [ Links ]
9. L. Miao, H. Qi, R. Ramanath and W. Snyder, "Binary tree-based generic demosaicking algorithm for multispectral filter arrays", IEEE Trans. Image Process., vol. 15, no. 11, pp. 3550-3558, 2006. [ Links ]
10. J. Brauers and T. Aach, "A Color Filter Array Based Multispectral Camera", in 12 Workshop Farbbildverarbeitung, Ilmenau, Germany, 2006, pp. 1-11. [ Links ]
11. Y. Monno, M. Tanaka and M. Okutomi, "Multispectral Demosaicking Using Adaptive Kernel Upsampling", in 18th IEEE International Conference on Image Processing (ICIP), Brussels, Belgium, 2011, pp. 3157-3160. [ Links ]
12. Z. Sadeghipoor, Y. Lu and S. Susstrunk, "A Novel Compressive Sensing Approach to Simultaneously Acquire Color and Near-Infrared Images on a Single Sensor", in International Conference on Acoustics, Speech and Signal Processing (ICASSP), Vancouver, Canada, 2013, pp. 1646-1650. [ Links ]
13. H. Aggarwal and A. Majumdar, "Compressive Sensing Multi-spectral Demosaicing from Single Sensor Architecture", in IEEE China Summit and International Conference on Signal and Information Processing (ChinaSIP), Xi'an, China, 2014, pp. 334-338. [ Links ]
14. H. Arguello and G. Arce, "Colored coded aperture design by concentration of measure in compressive spectral imaging", IEEE Trans. Image Process., vol. 23, no. 4, pp. 1896-908, 2014. [ Links ]
15. Department of Computer Science/Columbia University, CAVE | Projects: Multispectral Image Database. [Online]. Available: http://www.cs.columbia.edu/CAVE/databases/multispectral/. Accessed on: Feb. 24, 2015. [ Links ]
16. M. Figueiredo, R. Nowak and S. Wright, "Gradient projection for sparse reconstruction: Application to compressed sensing and other inverse problems", IEEE J. Sel. Top. Signal Process., vol. 1, no. 4, pp. 586-597, 2007. [ Links ]


