


 Inglés (pdf)
 Articulo en XML
 Referencias del artículo
 Enviar articulo por email
 Citado por SciELO
  Citado por Google
  Similares en
SciELO
Similares en
SciELO  Similares en Google
 Permalink
1. Introduction
Irrigation is a necessary part of human existence. Irrigation greatly facilitates the undertaking of a number of human activities. Nowadays, irrigation systems which use solar energy, i.e. solar photovoltaic (PV) energy, are quite often used in the field.
Figure 1 shows a typical irrigation system, using PV energy. PV cells forms the PV generator. The PV generator is used for the conversion of solar radiation into direct current electricity which is then converted by an inverter into the alternating current which is necessary to drive the pump. Available insolation E s , i.e., the electric energy P el , PV determines the appropriate uniform rate daily work period for the pumping station, T s [1].
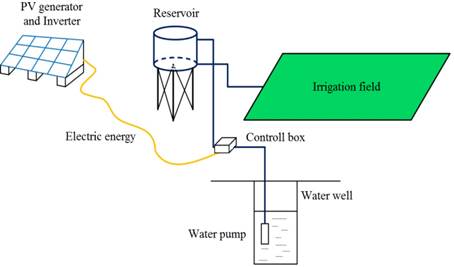
Pumping station pumps water into the water reservoir. From the water reservoir, water is distributed to the irrigation machine or to the irrigation pipelines on the green areas [1].
Such is a well-known and established technology, which is widely used. Advantages of this kind of irrigation systems versus irrigation systems which use fossil fuels include decreasing greenhouse gas emissions and achieving energy sustainability. Indeed, PV irrigation systems are often the only option for isolated and remote areas.
There are two basic problems related to the abovementioned type of PV irrigation systems. The First problem is the diseconomies of such systems. Despite the existence of these, the situation is improving because of trends leading to reductions in PV cell prices, increases in their efficiency, and the increasing price of the fossil fuels. The second problem is uncertainty inherent in this kind of systems: solar radiation has a stochastic nature. In other words, it is not possible to accurately predict the intensity and duration of solar radiation in any given period.
This problem can be solved by the use of any of a number of sizing methodologies and procedures, all of which are still in a process of development. This paper describes a new method called the Critical Period Method (CPM), which was created in order to assist the attainment of systematic sustainability in PV irrigation (and also water pumping) systems. Furthermore, a comparison between the CPM and the most commonly used method for sizing of the PV irrigation systems, Worst Month Method (WMM), will be presented: the last mentioned being one of the most widely used methods for the sizing of irrigation and water pumping systems. This comparison will be presented in the case study of the by the example of pitch irrigation for the local football club Obreš, located near Varaždin in Croatia.
2. Literature review
The most commonly used method for sizing is the Worst Month Method, which can be applied to any situation involving the use of PV energy to power water pumping equipment. This method has been presented in literature [2, 3 ] and many other references. WMM implies that the dimensions of the PV system should be calculated so that it can operate correctly during the month in which there is the greatest demand for energy relative to a comparatively low amount of available solar energy [3]. The WMM method consists of calculating the dimensions of the standalone system so it can work in the ‘worst’ month: the month with the biggest ratio of demanded energy to available energy. This method is widely used because it is simple and provides a satisfactory result [2]. In literature [2] and [3], this method is used for the sizing of a standalone PV system (water wells or irrigation) with a battery, and [4] has been used this for direct water flow for irrigation purposes.
Authors in literature [5] and [6] used dynamic programming to find the optimal sizing of PV irrigation systems. A simulation-optimization model in which the optimization is conducted by dynamic programming, a technique which adjusts well to a specific problem’s characteristics, while the required constraints are solved by simulation as shown in [5]. A specific objective function was set, which optimizes the relation between the output (hydraulic) and the input (solar) energy EH(i)/ES(i), because in such a way the demand for energy at the output of the PV pumping system can be correlated in the best way to the possibility of its production from the input radiated solar energy. It has been shown that this method is rather better than the more commonly used and simpler methodology for PV water pumping system sizing from [7]. There, the authors used a simple expression for the power of the PV system, which relies on simple meteorological and technological input parameters. The disadvantages of that simple method are a lack of systematic quality and static quality; these problems have been demonstrated in another paper [6]. In this paper, in addition to the above, these authors developed a model of the behaviour of soil as a water reservoir. Both Glasnovićand Margeta in, in their papers, used solar radiation intensity as estimated on a monthly basis, while Kenna and Gillet presented a methodology which could be used even on daily or monthly basis.
The same simple procedure as [7], here it is utilised in relation to olive grove irrigation, and associated with a model for calculating the required quantities of water amount with regard to agronomic and meteorological characteristics [8]. Authors [9] in their conference paper concentrate on the sizing of photovoltaic pumping systems accompanied by battery banks and water reservoirs in relation to the specific application of tomato field irrigation. The proposed algorithm sizes the photovoltaic panel and the battery capacity in relation to the way they significantly affect the production costs. The sizing strategy depends on the water needed for irrigation, which is to be stocked in a tank. Based on the water requirement, the site characteristics, the solar radiation and the panel type, the algorithm developed in that paper obtains the required panel surface and battery capacity. Studying the case of an alfalfa irrigation system shows that the sizing of a photovoltaic water pumping systems for irrigation is crucially affected by the dynamic character of the water demand and the available solar energy [4]. In order to define the worst conditions - on the basis of which the system is sized - the lowest ratio (on a monthly level) between the required hydraulic energy and the available solar radiation has to be found.
The Critical Period Method, which was presented by [10] determines the size and nature of all the design elements of the solution, the PV system, the pumping station and the water reservoir, based on the critical period of operation of each one. Photovoltaic, solar, energy, energy is produced and used for the operation of the pumping station. The pumping station pumps water into the water reservoir. From the water reservoir, water is distributed to the irrigation(s) machine or to the irrigation pipelines and on to the horticultural or agricultural areas. The period in which the water can be pumped and the water required for consumption is balanced (the water balancing period) is usually at least one day and may be several days, but usually no more than five days. Also, it has been proved that the reservoir, along with its primary, hydraulic, role of storing water also has the function of being a reservoir of energy. This is achieved through its proven functional connection with the source of the energy, which is in this case the PV subsystem. This relationship between the stochastic energy input and deterministic output energy is to be expected; the reservoir volume reduces the influence of extreme values in the time series (of solar radiation intensity, and water requirement) [10].
The application of CPM results in a more rational sizing of all the elements of an irrigation system: i.e., it achieves the sustainable and systematic use of water and energy. It is a deterministic approach which accommodates a large range of possible conditions. It is also a conservative approach, because, using it, the elements of the solution are potentially overdesigned. Such an approach provides a reliable irrigation system [10]. However, this methodology (CPM) so far hasnot been applied, in practice, anywhere in the world. Based on the values obtained via the method, the minimum size of the required PV system is determined - which provides the necessary energy to pump the required inflow of water in the identified critical period. The results obtained from the research so far show that the acceptability of the solution grows when the balancing period used for the sizing of the system is longest. A lower requirement for the PV generator output is obtained when applying an extended balancing period. The solution produced by using CPM is more reliable and is safer, regarding the operation of each subsystem (the PV system, the pumping station and water reservoir) and regarding the entire irrigation system, as compared to the more common water supply systems, using either conventional or renewable energy sources. CPM was examined in relation to the case of urban water supplies, [10] and [11], and also in relation to irrigation systems, [12]. A pilot irrigation project is in the preparation phase; all required project documentation is currently being developed.
As far as can be seen from this review of the literature, most projects involving a PV water pumping systems begin with the sizing of the PV subsystem. This is because, in most cases, it is necessary to determine how to provide a sufficient amount of energy to operate the pumps. A demand for the water normally generates the demand for the electricity, regardless of whether the system has an irrigation water reservoir or not. In all of the aforementioned sizing methodologies and procedures, the interdependence of the PV subsystem, the volume of the water reservoir and the power (capacity) of the pumps has not been described or elaborated upon. This represents the motivation for this research and for our presentation of the methodology of CPM and our comparison of CPM with WMM, where the last one is being one of the most common methods for sizing PV irrigation systems.
3. Methodology
3.1 Required equations and procedures for sizing
The power of a PV subsystem, P el,PV [W] which generates electrical energy for pumping water to a water reservoir for a certain period of time i, representing days of the year, i = 1, 2, …, 365 days, according to Equation (1) is equal to [10]:
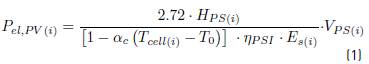
where H PS(i) [m] is the manometer height, V PS(i) [m3/day] is the daily amount of water pumped into the reservoir in a certain time period [day]i, α c is the solar cell temperature coefficient [°C-1], T cell is the solar cell mean daily temperature [°C], T 0 is the solar cell mean daily temperature in standard test conditions, which is 25°C, η PSI is the pumping station and inverter mean efficiency [%], E s(i) [kWh/m2] is the available mean daily average intensity of solar radiation for the time interval i.
The amount of electricity produced, E el,PV(i) [Wh], in period T i is expressed by Equation (2):

The mean daily temperature of a solar cell, T cell(i) , is obtained using Equation (3) [10]:

where T a(i) is the mean daily air temperature [°C].
The mean efficiency of the pumping station and the inverter η PSI is obtained by using Equation (4) [10]:
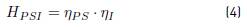
where η PS is the pumping station efficiency, while η I is the inverter efficiency.
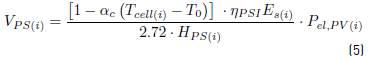
For a given power of a PV subsystem, P el,PV(i) , the possible amount of water V PS(i) [m3], pumped into the water reservoir during the time interval i, according to Equation (5) will be equal to:
The required area of the PV generator A PV [m2] is obtained using Equation (6) [10]:
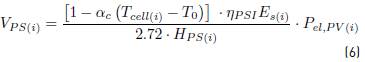
where η PV is the mean efficiency of the PV subsystem.
If all the available daily solar energy, E s , or all the electricity produced from this, is to be used for pumping V PS(i) into the water reservoir, the average capacity required for the pump station Q PS,available(i) will then be according to Equation (7) equal to:
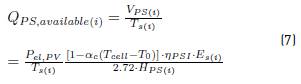
namely, according to Equation (8):

T s(i) is the daily number of peak sun hours or usable duration of insolation, which is obtained by using Equation (9) [3]:
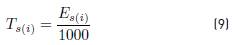
The number of peak sun hours is merely an estimate of the amount of time per day that the irradiance is equal to peak sun, and because PV models are rated for their output under peak sun conditions, the number of daily peak Sun hours indicates how many hours of each day the PV array will operate at its full power output [3].
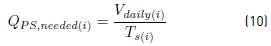
However, if all the water quantity V PS(i) does not necessarily need to be pumped over, namely if the water quantity V PS(i) is greater than the required amount of water for the needs of irrigation V daily(i) , then the minimal average required pump capacity Q PS,needed(i) according to Equation (10) is equal to:
Since the purpose of the pump is pumping (lifting) water into the water reservoir, the required capacity , using Equation (11) is:

The average power of the pumping station  is then according to Equation (12):
where η PS is average efficiency of the pumping station.
Water reservoirs are typically sized for single-day water equalization of supply and consumption for a day with maximum consumption, but equalization can also be done over more days, up to seven. The volume of the water reservoir, V, is defined for each day in the year by the method of the integral curve, i.e. the Ripley method, using Equation (13) [13]:
where t = 1, 2, … , 24 h.
Equation (13) applies if, within a period of t = 1 hour to 24 hours (one day), the water inflow of the water reservoir is the same as the water outfall from the water reservoir. This is a simple methodology based on the fact that within the period of exchange, which can be a period of from one to seven days, the total water inflow is the same as the total outfall from the reservoir [13].
3.2 Critical Period Method
The Critical Period Method [10] and [11] encompasses all the design elements of the solution: the PV system, the pumping station and the water reservoir, and is based on the critical period of operation for each one. The ‘balancing period’ taken for water pumping and water reservoir water balance, t b , is usually at least one day and may be several days, but is usually no more than five days (t b = 1 to 5 days). Based on the values obtained by the method, the minimum required size of the PV system is determined - to provide the necessary inflow of water for the critical period. The minimum required P el,PV is determined from established differences ΔVt b , i , using Equation (14):
where V PS,tb,i [m3/day] is the daily amount of water pumped into the water reservoir over a certain time period (a day) i and V daily,tb,I is the daily amount of water required in a certain time period (a day) i.
The critical day/period for the PV generator design is determined by statistical minimization, where ∆Vt b , i according to Equation (15) is a difference which is typically equal to 0:

The required volume for the water reservoir, V, is obtained using the common sizing procedures [13]. In general, the critical day/period for the design of the volume of the reservoir, V, is the day with maximum water demand and the shortest duration of solar radiation suitable for supporting pumping station operation, providing that on the available day insolation E
s(i)
is sufficiently high. Based on the above mentioned information, the required volume  for each alternative t
b
is obtained using statistical maximization, with the associated critical day. In other words, there is a need to calculate the biggest reservoir volume required for every day in the year using Equation (16):
for each alternative t
b
is obtained using statistical maximization, with the associated critical day. In other words, there is a need to calculate the biggest reservoir volume required for every day in the year using Equation (16):
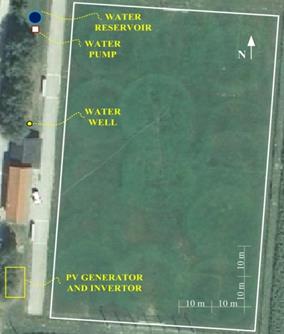
The same situation according to Equation (17) applies to the capacity of pumping stations :
:
3.3 The Worst Month Method
The Worst Month Method is defined very simply, the dimensions of the PV system are calculated so that they will work throughout the month with the greatest demand of energy in relation to a comparatively low amount of available solar energy [3]. Critical periods can be defined in the same manner as they were defined for CPM. However, instead of critical days, in this case critical months will be used. Calculation of the critical month for WMM follows the same logical sequence as the calculation of critical periods for CPM.
The minimum required P el,PV is determined from the established differences ΔVt b , m using Equation (18), where m are months in the year, m = 1, 2, ... , 12:

where V PS,tb,m is the monthly amount of water pumped into the water reservoir in a certain time period (one month) m and V monthly,tb,m is the monthly amount of water required in a certain time period (month) m.
The critical period/month for the PV generator design is determined by statistical minimization according to Equation (19):

The critical period for the water reservoir is defined according to Equation (20):

The same situation according to Equation (21) applies to the capacity of the pumping stations:

The ‘balancing period’ for water pumping and water reservoir outflow for WMM, t b , must be just one month. The use of a longer balancing period is not justified, technologically or operationally, because the WMM method is based on a time unit of just one month.
4. Case study
4.1 Location
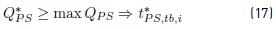
The Critical Period Method will be illustrated by the example of pitch irrigation for the local football club Obreš, located near Varaždin in the territory of the Sveti Ilija municipality, Figure 2.
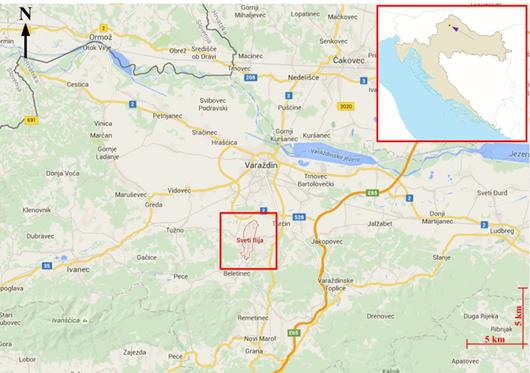
The football pitch covers an area of 105 x 70 m. The altitude of the location is 173 m asl. Figure 3 shows the position of all the elements of the system to be analyzed. According to the recommendations from [14] and the position of the available area, the azimuth (angle spread) of the PV generator will be angled to the south, while the angle of inclination will be equal 15°.
Groundwater, which is situated in shallow layers at a depth of 5 m, is used for irrigation, and the usage of the existing well shows that its capacity is sufficient.
Another favourable fact is that the level of the underground water in this case study is situated in the shallow area of the rich Varaždin aquifer [17]. Since there are current problems with the impracticality of the existing irrigation system using rubber hoses, with the expensive energy consumption, as well as the inadequate capacity of the existing lifting pump in the well, there is a plan to build a new, more modern and sustainable irrigation system.
4.2 Technology description
Water is drawn from the well by a submersible well pump into the water reservoir where water is collected and distributed to the areas being irrigated [Figure 3]. Such an irrigation system, with a water reservoir held on the top of a tower, would not be necessary in an urban area - there would be no need for the construction of a tower, since some other existing elevated structure could be used for the purpose, an office block for example, or the existing spotlight pillars on a football stadiums etc. These types of irrigation systems can also be used for enclosed areas (greenhouses) [1].
The distribution of the water from the water reservoir to the field is gravitational, since the water reservoir is situated at an appropriate height above the ground, thus achieving the required water pressure. It is necessary to provide the required volume for the water reservoir, namely the water required to meet the irrigation needs. This water will be provided by groundwater. It should be noted that in similar cases a certain amount may also be obtained by collecting rainwater [1].
The last part of the observed system consists of the output pipelines from the water reservoir. In this case, the irrigation of an area can be predicted based on the installed, connected pipelines and irrigation devices.
4.3 Input values
According to the recommendations from [18] and the actual requirements of the system, the daily constant water requirement (the consumption) V daily from May to August inclusive is estimated to be 30 [m3], Figure 4.
During system operation, over a period of 4 to 8 months, there will be an electric power surplus (or a water surplus), which can be sold within the power (or water) distribution system, or used for other purposes [1].
The football pitch is not irrigated at other times of the year. There is one daily regime of water consumption, i.e. the water inflow and outfall (input/output) across the water reservoir is as can be seen in Figure 5. Every hour, within the daily irrigation regime, the football pitch is constantly irrigated, at 3 [m3/h].
This regime of football pitch irrigation is undertaken for from 9 to 18 hours, Figure 5, i.e., for as long as is practical considering the possibility of the theft of the irrigation equipment, as well as the need to impose security measures for its protection (alarms, physical protection).It should be taken into account that irrigation is provided for an amateur football club, where players/members of the football club are or employed or they have their school or faculty obligations, so only after 6 PM they are available for the training. Of course, during football matches irrigation is not in operation.
Generally, precipitation should be taken into the account, but due to the scope and size of this paper, it will not be done. Another reason for this is testing of the presented model of CPM for possible using for the closed hothouses and water supply systems, where precipitation is not used as a possible water source.
Figure 6 shows the average daily insolation intensity, in peak hour periods (as calculated by Equation (9), when the angle of inclination of the PV generator surface is 15° and the azimuth (angle spread) is in the southern direction [19].
Figure 7 shows the mean values of the average monthly insolation from May until August.
Figure 8 shows the average daily air [20] and solar cell temperature, (as per Equation (3)) for the observed area. The data from [20], are expressed as mean values for a 10 year period: i.e., for the period from 2004 to 2013. Also, the data from [19], was available and expressed as mean values only for the duration of the two years, 2004 and 2005. Figure 9 shows the mean values of air and solar cell temperatures from May until August.
Based on common values from references [10] the following values for input parameters were adopted. The average inverter efficiency is ηI = 90%, while the average pumping station efficiency is η PS = 60%. Thus, the average inverter and pump efficiency, according to Equation (4), is η PSI = 54%. The solar cell temperature coefficient is α C = 0.005 [°C-1], and a solar cell’s temperature in Standard Test Conditions is T 0 = 25 [°C]. The adopted PV system efficiency is η PV =15%.
From Equation (9), the calculated value for the usable duration of insolation is 6 hours for each month.
5. Results and discussion
For this study, the sizing procedure was carried out by both of the methods in question: both CPM (balancing period, t b, = 1 day) and WMM (balancing period, t b, = 1 month). Critical days/months for the sizing of all parts of the system are shown in Table 1. The sizing will be performed according to the Equation (15)-(17) and (19)-(21).
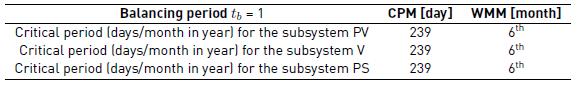
It can be seen that critical days/months are all in the same part of the year. Since the PV subsystem’s power and the amount of pumped water are functionally linked - Equation (1) and (5) - and the water consumption regime is constant, this explains the observed overlap. As for the critical period for sizing the system V and PS overlapping is also observed. According to the equations for CPM Equation (16-17) and for WMM (20-21), these critical periods depend on the water consumption regime and the time required to pump water into the tank: i.e., the duration of the pumping operation. In other words, they depend on the duration of solar radiation which is suitable for pumping water, T s .
Taking into account the estimated total pressure losses in all the pipelines, the secured height to prevent cavitation, as well as the required pressure of 3.5 bar for operation of the irrigation device (Buy Irrigation, 2015), the adopted height of the water reservoir is 50 [m], with an adopted diameter of 5 cm for the pipes to the water reservoir (as well as all other pipes). The total calculated manometer height of the submersible well pump (with total pressure losses included, as well as the secured height to prevent cavitation) is 10 [m] [1].
The required power and area of the PV generator, the required volume of the water reservoir and the required power of the pump, as calculated using the CPM and WMM methodologies are presented in Table 2.
Table 2 Required power and area of the PV generator, the required volume of the water reservoir and required power of the pumping station as calculated by CPM and WMM
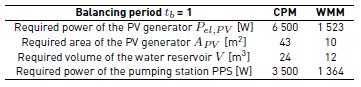
WMM gives smaller values for the required subsystem sizes. Compared with CPM, it can be seen that the required power of the PV generator and its required area are smaller by 77%, the required volume of the water reservoir is smaller by 50%, while required power of the pumping station is smaller by 61%. This is explained by the averaging of the input values to their level over a month, within WMM.
Smaller values for the subsystem sizes are apparently an advantage of WMM versus CPM. This implies not only larger investment costs, but also operation and maintenance costs. Also, it could be seen from Figure 6 that large deviations, i.e. extreme values in form of leaps and falls of the values of the solar intensity, affect sizes of the particular parts of the PV irrigation system sized by CPM. After the testing of the constructed irrigation system, it will be seen if there are any possibilities for the negligence (removing) of the mentioned extreme values and omission from input parameters. However, it is necessary to take into account that any deviation of daily inputs from the secondary input monthly value implies unreliability of the system of irrigation as sized using WMM. This means that CPM shows greater reliability than WMM.
6. Conclusions
It has been shown that both of these methods for the sizing of the PV water pumping irrigation system can be applied for this purpose. WMM is definitely more rational, given the sizes of the subsystems which are obtained, as compared to those obtained from CPM. These sizes affect the costs of the irrigation system, which will be much larger when using CPM. However, it has been shown that the use of CPM results in a more reliable irrigation system. Putting aside the fact that the primary purpose of the irrigation system is pumping water, the CPM method provides a larger surplus of generated electrical energy, which could be used for other purposes (lighting, operation of various electrical devices, etc.) or for distribution or for sale to the public electricity network.
Both of the solutions could be applied in urban areas, on local as well as regional scales for irrigation purposes as well as for the water supply of settlements. Also, these solutions can be used in combination with conventional sources of energy from the electricity grid. Existing irrigation systems and also water supply systems which use conventional (classic) energy are also appropriate for the application of both methods. It is necessary to take into account the long-standing trends of decreasing prices of PV cells, where the current average price is 0.4 US$ per 1 peak Watt of power [21,22] and [23]. An additional fact in favour of solar energy is the current increasing trend in the efficiency of PV cells, where currently the largest practical efficiency of the cells is for a single cell efficiency of 35.1% [24], while laboratory efficiency is 46.0% [25]. It is important to note that rainwater and purified wastewater can also be used for irrigation of grass areas, especially in rural areas without significant influence of industry. It is also shown that water reservoirs, apart from irrigation purposes and the hydraulic function of water storage, function as energy stores as well. The presented solutions are in accordance with global and European strategies and guidelines related to the reduction of greenhouse gasses, increasing the use of renewable energy sources and energy efficiency increases.
Further research would take into consideration an economic analysis: i.e., an economic comparison of the WMM and CPM methods. Moreover, final conclusions would take into account other criteria: i.e., environmental and social criteria (multi criteria analysis). A strong SWAT analysis should be used in future research work.

