


 English (pdf)
 Article in xml format
 Article references
 Send this article by e-mail
 Cited by SciELO
  Cited by Google
  Similars in
SciELO
Similars in
SciELO  Similars in Google
 Permalink
1. Introduction
The motivation of this study is the design of a shoe production line that is about to start production operations, considering the registered data and the estimated times as well as the estimated production. The company is located in the city of León, State of Guanajuato, Mexico, a city famous for its flourishing leather and footwear industry[1]. Like any process, the line will be subject to random events that will generate variability in the flow.
The objective of the company is to keep the cycle time at a low level and also keep the quantity of work in process in front of each operation under control; however, given that restricting the level of work-in-process inventory in any productive system has as the undesirable effect of limiting the quantity of finished product obtained, the assignment of spaces (in pairs of shoes) must be optimum; this is the Buffer Allocation Problem, a well-known optimization problem.
Regarding the management, the administrators must make decisions about the resources required to produce a particular model, which gives rise to a critical question: How should this type of industry be managed? To answer that question, decision-makers need to use tools and/or models to represent the system to analyze the different options available in the design and management of a production line. A model makes it possible for an administrator to understand how each one of the system's variables relates to each other and minimize the associated uncertainty by proposing changes in the operating conditions subject to randomness[2, 3].
2. Description of the process
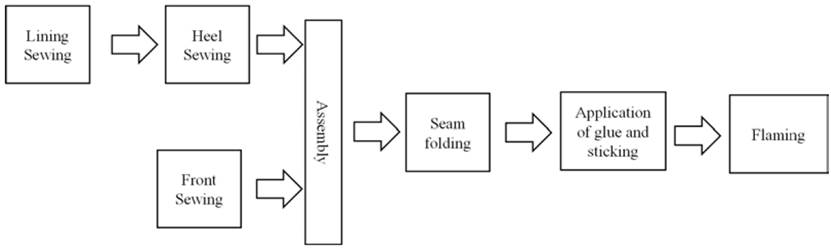
The line in question consists of 7 operations and produces a specific model of shoe. In the first operation, the parts that form the shoe lining are joined together by seams (Lining Sewing). On leaving this process, the parts that form the heel of the shoe (Heel Sewing) are joined together. In parallel, the front part of the shoe is joined to the heel by a seam (Front Sewing). In the stage known as assembly, the pieces are put together to give shape to the shoe. During the next phase, the seam created during assembly is folded (Seam folding), then glue is applied to the lining, which is turned over to be glued to the leather (application of glue and sticking), and it is finished by burning off surplus threads (Flaming). The pairs are put together and then sent to another section of the factory [Figure 1]. We must take into account that the stations have different operating times (unpaced).
2.1. Buffer Allocation Problem
Companies face the problem of controlling the quantity of work in process accumulated in the production lines, so the size of the queue (buffer) in front of each station (B 1, B 2,…,B n ) needs to be limited, which is a non-trivial decision for managers, administrators, and supervisors.
By limiting the quantity of work in process, there is a reduction in the problems of accumulation and lack of material at the stations resulting from the differences in processing times between consecutive stations or by machine failures[4]. The cycle time (CT), Throughput (Th), and the Work in process (WIP) are common performance measurements and are expressed as a function of (B 1, B 2, …, B n ). The BAP is posed as an optimization model and is an NP-Hard problem. At the present time, variants are recognized in accordance with the performance measure used. The first is[5]:
Maximize the Th of the line:

Subject to:

The value of Th must be maximized (1), the total number of spaces (N) all along the line is restricted (2), and there are upper (B i U )and lower (B i L ) bounds of number of spaces at each station (3). The second, which is known as a dual problem, is:
Minimize the number of spaces on the line:
Subject to:


It is necessary to minimize the total number of assigned spaces (4), constraint (5) specifies that the production must comply with a minimum requirement (Th T ), and (6) limits the number of spaces at each station. In this paper, the average cycle time on the production line is used as the objective function[6, 7]:
Minimize the Flowtime

Subject to:


Where (7) is the cycle time that has to be minimized; constraint (8) establishes that the production must be higher than or equal to a target while there is also a limited total number of spaces given by (9) and the number of spaces at each station is bounded (10).
Equations (1), (4), and (7) do not have a closed-form expression, so we resorted to a simulation model and a fractional experimental design to obtain the Equations as a function of B i ’s; these expressions are formally known as metamodels because they were obtained from the analysis of the simulation of the process being analyzed[8, 9]. A regression model might be linear:

If the statistical analysis indicates that the model (11) is not suitable for predicting the behavior of the system, then a higher-order model is recommended:
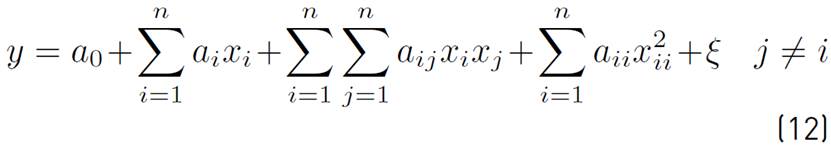
In expressions (11) and (12), coefficient a 0 is the origin ordinate, coefficient a i is the first-order effect of variable i; coefficient a ij is the effect arising from the interaction between factors i and j; coefficient a ii is the quadratic effect of factor i, and term ξ is the noise or effect resulting from factors that are not considered in the model.
2.2. Fractional experimental designs
In a complete factorial experimental design, K factors with 2 levels each and their respective combinations (2 K ) are analyzed. This is mainly used for determining the significant variables as well as the interactions between them. The results are expressed in a regression model, like (11) or (12).
A situation to consider is that as the number of factors increases, the number of experiments to be done grows explosively until it is impractical to perform all the experiments with all the combinations because of the time consumption involved. The alternative is resorting to fractional factorial to determine the main variables and their significant interactions, mainly when we suspect that there are lower-order interactions that could have an effect on the behavior of the system[10].
3. Previous work
The BAP has increasingly attracted attention as the recommendations about limiting the amount of work in process, derived from the Lean approach, for example, have motivated administrators to understand better how the flow of the entities on a production line behaves when the size of a queue is restricted.
Maximizing the Th is the most studied variant with results reported in serial systems up to 100 reliable stations as well as in systems with breakdowns or failures(4, 6); practical and real cases reported are from the automotive industry[11, 12].
Other performance measurements are also used: maximize the profit in a serial system with failures and with different service times[13]; minimizing the total number of spaces (variant two of the BAP)[14]; minimizing the assignment cost[15, 16] and minimizing inventory cost of assembly systems with failures[17]. Minimizing Cycle time is only reported for unreliable serial lines[7].
Several approaches can be found for obtaining the metamodels of performance indicators: neural networks applied to asynchronous lines in series and with failures[18]; 2K experimental design combined with simulation[19]; fractional factorial designs[20] to obtain the production rate of a line with assembly and failures; response surface methods to obtain a model for production in an unreliable system[21]. A general conclusion is that models with interactions between buffers predict Th, TC, or WIP more accurately than linear models.
In a comparison of regression analysis and artificial neural networks for modeling the production rate, neural networks showed a better fit of the data, although only the value of R 2 is used as a performance criterion[22].
To finish this review, it is important to mention that the BAP study was used to obtain properties of the production lines: the value of Th in reliable systems in series with equal service times follows a behavior of an inverted bowl in accordance with the number of stations and the number of assigned spaces; the WIP is gradually increased in accordance with the distribution of spaces on a line with N stations[23]. It was also found that the optimal buffer allocation is one in which more space is allocated to stations at the end of the production line with equal service times[24]; on the other hand, in assembly lines with non-balanced service times, the results indicate some benefits of asymmetrical buffer patterns[25]. The aforementioned is relevant since it will allow evaluating the solutions obtained in the Results section.
4. Materials and Method
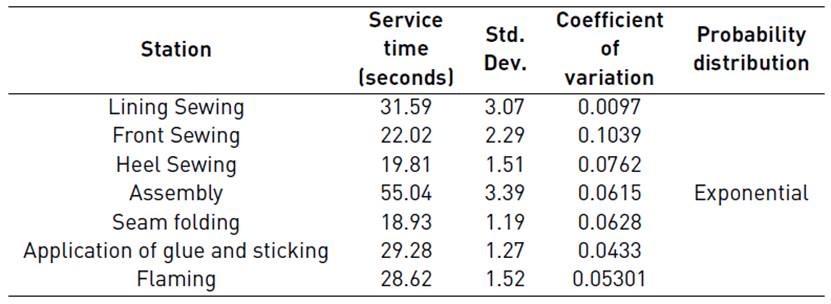
The average service time at each station was obtained from a sample[1]. The total data in each one was 20. Then the mean, standard deviation, and coefficient of variation were obtained [Table 1]. From the coefficient of variation, the operations were observed to have a low natural variability; the sample does not consider failures at the stations that interrupt the output of shoes and make a piece stay longer in the system: the absence of workers or failures of the sewing machines are the failures that are more often observed on this line; however, there are no data at the moment; in view of the above, we shall, as an approximation to a real process operation, assume a moderate variability with a coefficient of variation equal to 1 value that corresponds to an exponential probability distribution[26].
A simulation model of the production line was constructed using the Arena package, designed for the analysis of systems with a discrete-event approach. We assume that pieces are always available in the input operations (front sewing and lining sewing).
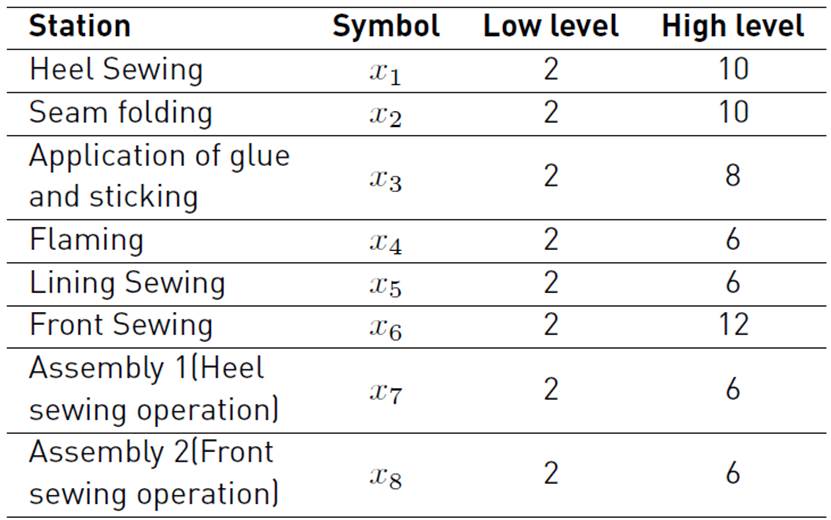
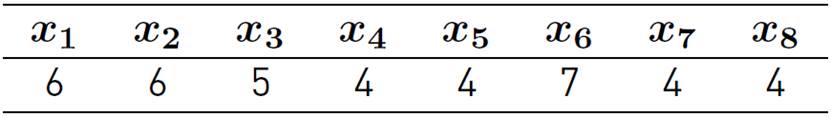
The blocking rule used is the one known as blocking after service; in other words, the piece does not leave the station until there is a place in the next queue[27]. There are 4 workers in the assembly operation, while there are two workers assigned to the rest of the operations. All the stations have a storage area for the work in process with finite capacity given in pairs of shoes [Table 2]; there are 8 storage areas in total that shall be called “buffers”.
It is worth mentioning that in the “Assembly” station, the total buffers are divided into two, half for the flow of pieces that arrive from “Heel Sewing ” and the other half are assigned for the entities that arrive from the “Front Sewing” station. All buffer levels are summarized in Table 2 and correspond to the space available in front of the stations.
A working day consisting of two 8-hour shifts each or 960 minutes is simulated, rejecting the first hour of simulation, which corresponds to the heating period. The recorded performance measurements were Cycle Time and Th; the WIP on the line was obtained by applying Little’s Law: WIP S = Th X CTS.
We resorted to an experimental design for constructing a metamodel of the cycle time and Th with the size of the buffers as variables; if running a complete factorial design, 256 experimental runs plus the central points for collecting information about the curvature of the region should be performed. Given that the number of experiments would require a huge amount of time, we resort to a fractional experimental design for the analysis. The study is divided into two phases: exploration and characterization.
5. Results and Discussion
5.1 Exploratory phase
This phase aims to obtain preliminary information about the behavior of the cycle time and production as a function of the quantity of work in process permitted at each buffer. A fractional experimental design 28-4 with 19 runs was used; the levels are summarized in table 2. This design does not consider interactions between factors and generates a linear model. The design and the calculations were executed with the support of Design Expert 12 package.
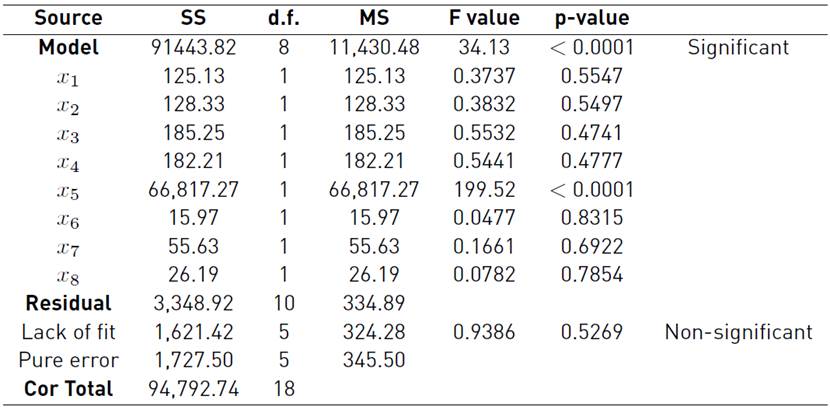
The ANOVA table for the cycle time [Table 3] shows that the linear model is significant for the cycle time; in other words, it contains the factors that explain the behavior of the cycle time.
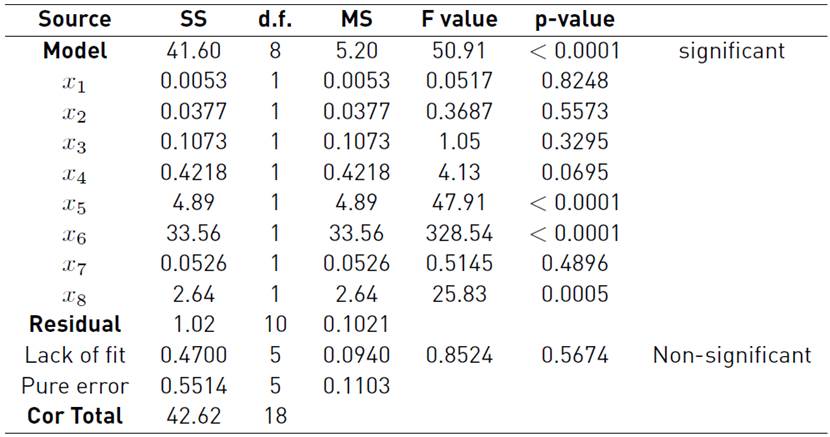
In the case of the cycle time, the buffers corresponding to front sewing (x 6) and lining sewing (x 5) are the ones that concentrate the highest effect, followed by the Assembly buffer 2(x 8). The curvature is not significant; therefore, the linear model would adequately explain the behavior in the experimentation region. The correlation coefficient indicates that the linear model explains 97.6% of the variability of the process.
In the case of production, the results in table 4 indicate that the buffer corresponding to lining sewing (x 5) is the variable that controls the production of the entire line. This model explains 96.47% of the variability of the process.
Both for the cycle time and for the production of the line, it is only viable with the current design to obtain the x 1 x 2, x 1 x 3, x 1 x 4, x 2 x 3, and x 2 x 4 interactions while the remaining 19 are confusing or masked. In earlier papers, interactions between the buffers have been found to have a significant effect on the performance measurements as well as on other properties such as the blocking probability for a station[4, 22, 24]. Although the correlation coefficient is high, we consider performing new experiments that will enable us to detect the significant interactions between buffers, so the second phase of runs is performed to characterize the region of interest.
5.2 Characterization phase
The original experimental design was increased with new runs to determine the coefficients corresponding to the interactions. Twenty-four points/combinations were added with two replications each to estimate the standard error, which gives 48 experiments. The curvature is not significant but, for the purpose of improving the precision, 6 additional runs were added with 3 central points, which generates a second block with 57 experiments. Adding the two blocks together, the design has 76 experiments. With the stepwise method, the non - significant interactions were rejected by employing the statistic p as a criterion, and thus a reduced model was obtained.
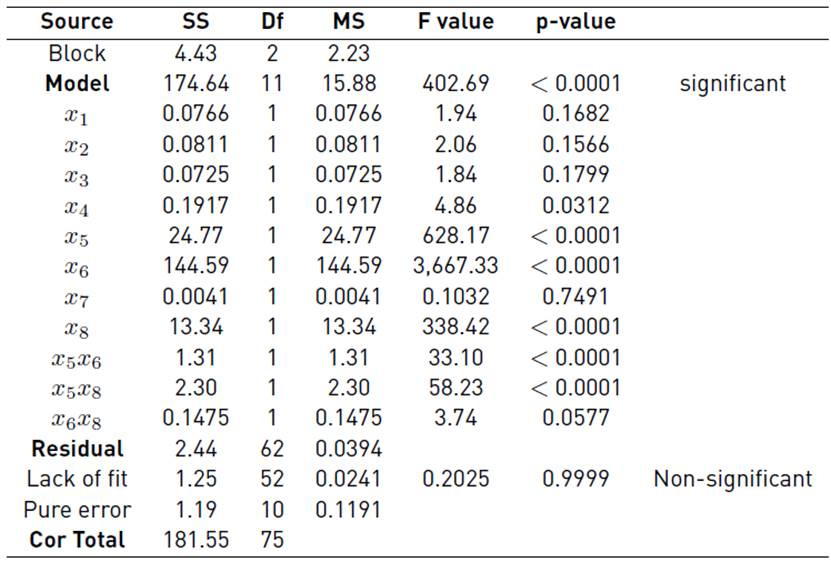
For the cycle time, the end result is a model with the 8 original variables plus 3 interactions: x 5 x 6, x 5 x 8 and x 6 x 8. In this model, the lack of fit is not significant; in other words, there is a curvature in the region, but the model’s predictions cycle time are adequate; the correlation coefficient is 0.9862, which indicates that the factors included in the model explain 98.62% of the variability, the value of the adjusted correlation coefficient is 0.9837, which indicates that adding new factors marginally lowers the ability to explain the variability of the process [Table 5].

Variables x 5(Lining sewing Buffer), x 6(Front sewing Buffer), x 4(Flaming Buffer), together with x 5 x 8(Lining sewing Buffer - Assembly Buffer 2), x 5 x 6 (Lining sewing Buffer - Front sewing Buffer ), and x 6 x 8(Front sewing Buffer - Assembly Buffer 2) interactions are the ones that explain the variability of the cycle time [Table 6].
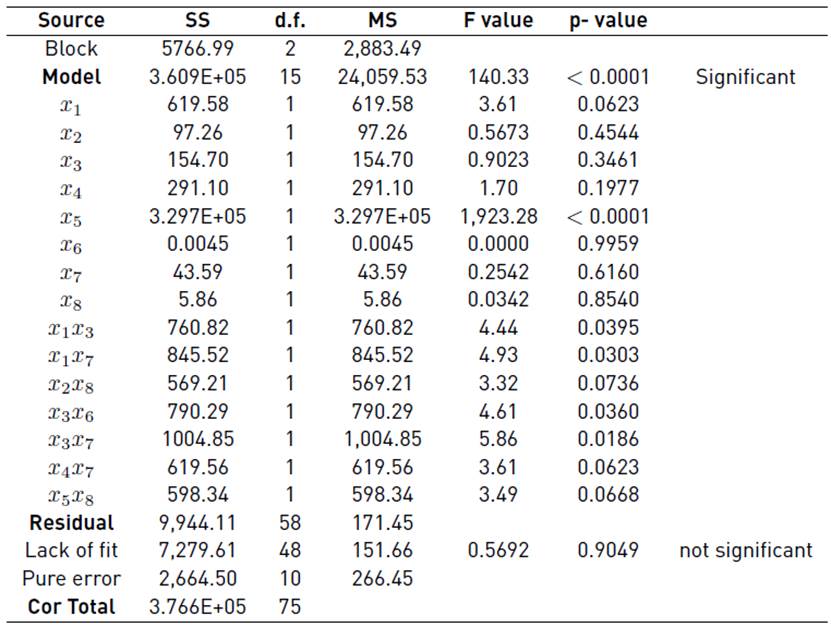
The metamodel corresponding to the production of the line explains 97.32% of the variability of the process. The effect of the curvature is not significant; therefore, the model is suitable for predicting the production of shoes.
We observe that the x 5 (Lining sewing Buffer ) and x 1 (Heel Sewing Buffer) variables are significant, followed by the x 3 x 7 (Glue and sticking Buffer - Assembly Buffer 1)interaction; finally, there are the marginal effects of the following interactions: x 1 x 7(Heel Sewing Buffer - Assembly Buffer 1), x 3 x 6(Glue and sticking Buffer- Front sewing Buffer), x 1 x 3(Heel Sewing Buffer- Glue and sticking Buffer), x 4 x 7(Flaming Buffer- Assembly Buffer 1), x 5x8 (Lining sewing Buffer - Assembly Buffer 2)and x 2 x 8 (Seam folding -Assembly Buffer 2)[Table 7].
Metamodels
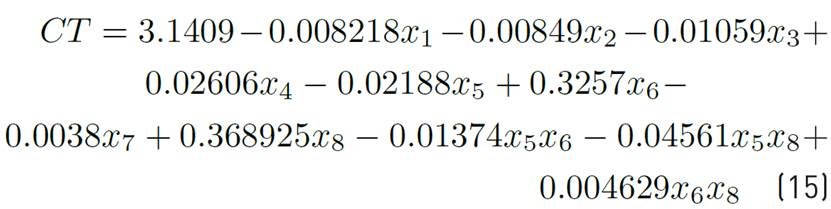
Equation (13) is the model of the cycle time:
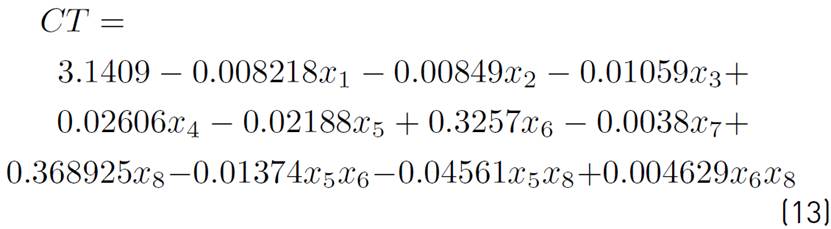
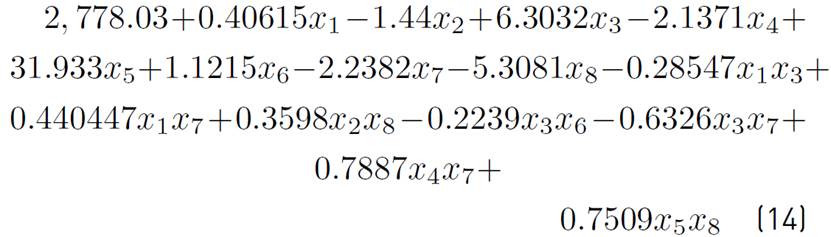
For Th, Equation (14) is the proposed model:
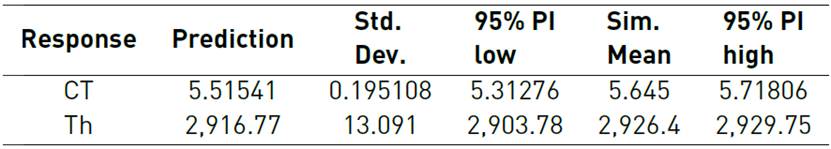
To verify that the metamodels possess an adequate degree of accuracy[28], 5 additional simulation runs of the central point were made, and the confidence intervals of Cycle time and Th were constructed. The respective confidence intervals are calculated below [Table 8 and 9].
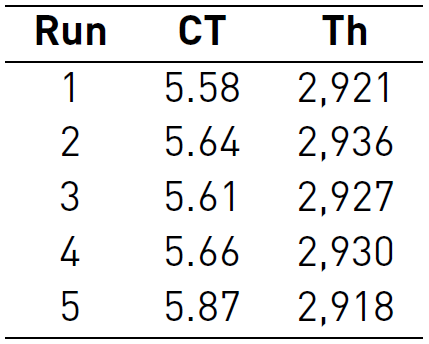
The metamodel predicts an average value for the cycle time of 5.51; the confidence interval is 5.31 - 5.71; the average of the five simulations is 5.645. In this case, the model predicts a mean cycle time within the confidence interval. Likewise, the model predicts a mean of 2916.77 pairs of shoes, the confidence interval is 2903.78 - 2929.75, the mean of the simulations is 2926.4, and equal is found within the confidence interval; This level of accuracy is enough for the purpose of the study [Table 10].
Assignment of spaces to minimize the cycle time
Once the models had been obtained, we proceeded to find the distribution of buffer spaces that minimizes the cycle time on the line, subject to the constraint of total available space, the desired production target, and the number of allowable spaces in front of each station. The optimization model is as follows:
Minimize
Subject to:

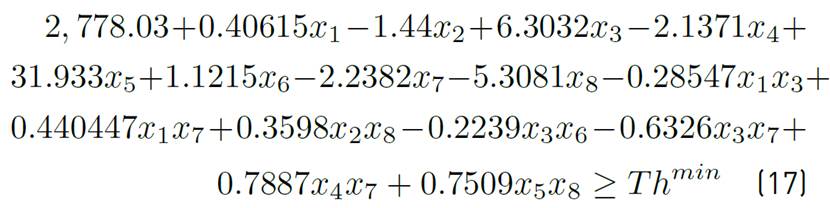

Where (15) is the objective function, (16) the constraint on the number of spaces available on the entire production line, (17) is the constraint on the Th required, and (18) corresponds to the range of spaces available in front of each work station and are integer variables.
A sensitivity analysis was made to quantify the effect of the total available space (N) on the assignment of places in front of each station (x i ). The maximum value of N is the sum of x i u ‘s that is 60 spaces; 5-unit decreases were used. The lowest level corresponds to the value of N with a feasible solution for the problem. The required Th min is 2900 pairs per working day.
The mathematical model is a non-linear integer optimization model and was programmed in the LINGO 13 package installed on a computer with an Intel Core i7 processor. The model has a total of 8 integer variables and 10 constraints; the runtime is reasonable and, in our case, was not a variable to be considered so, for the moment, the use of a metaheuristic method is not justified.
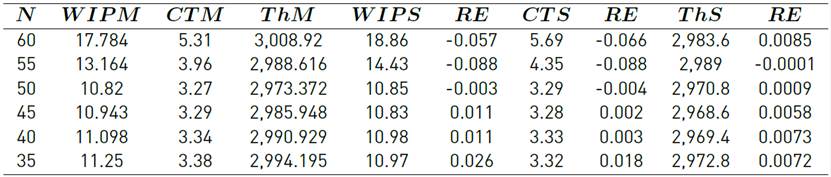
Furthermore, for each solution obtained, 5 simulations were performed, thus obtaining CT, WIP, and Th. In order to compare with the results of the metamodel, the relative error (RE) was calculated using Equation (19):
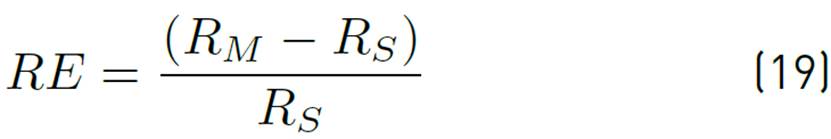
Where R is the mean of the performance measurement, the subscript M refers to the prediction of the metamodel and S to the result obtained from the simulation.
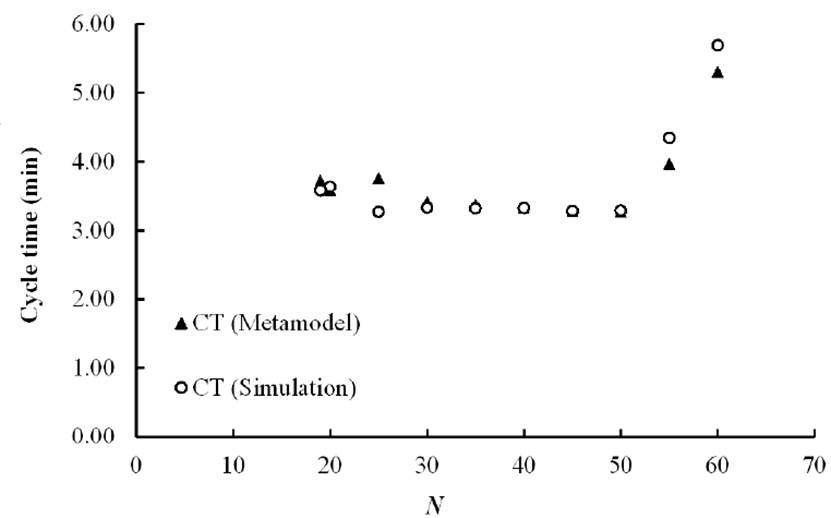
We observed that the cycle time has a non-linear behavior inasmuch as the number of spaces available in the line N decreases [Figure 2]. 4 scenarios were detected where the cycle time is found in the 3.25 - 3.28 range, each one corresponds to a distinct distribution of the available spaces in front of each station [Table 11].
In the case of the production, we observe a similar behavior to that observed in[24] and[25]: there is a maximum value of Th for every combination of vector B [Figure 3].
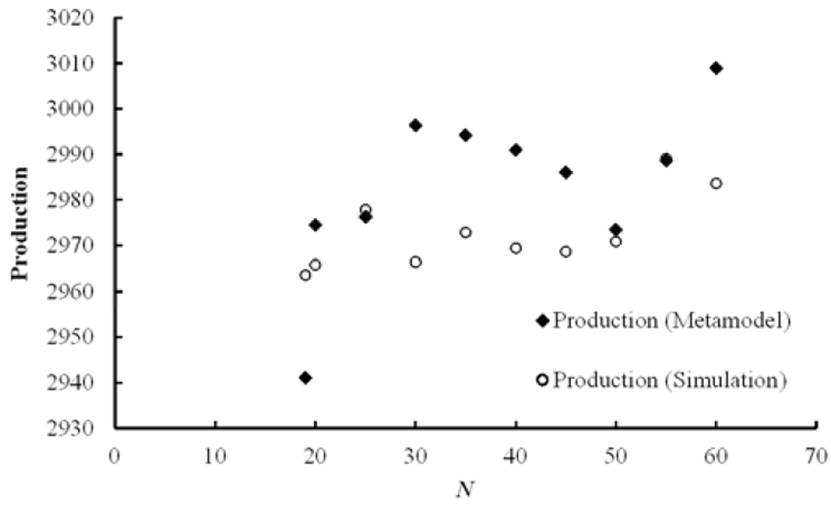
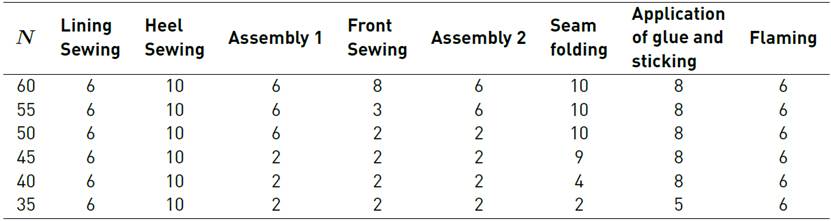
Regarding the distribution of the spaces, the inspection indicates that the optimal assignment consists of a non-uniform arrangement; the result is in accordance with the ones obtained in[25]: in production systems with different processing times, an asymmetrical buffer distribution can offer advantages [Table 12].
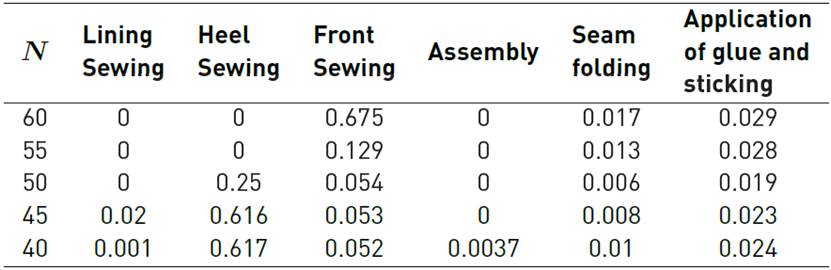
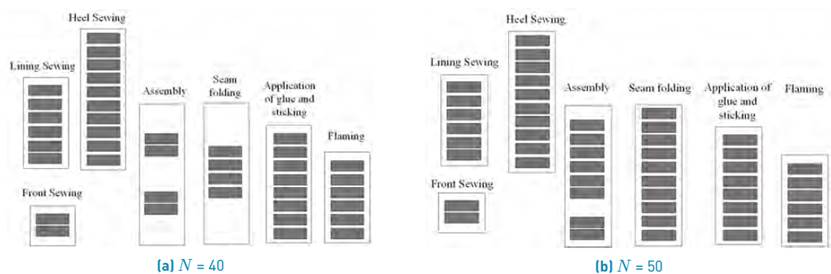
To complement the results, the average blocking probability of the stations was recorded for each simulated scenario. This gives us more elements to evaluate the quality and characteristics of each solution proposed. We found that when 40 spaces are assigned, the cycle time has a value of 3.34 minutes, and the required production constraint is fulfilled. Moreover, the highest blocking probability corresponds to the sewing heel station with 0.617 and is caused by the Assembly 1 buffer.
Another scenario that attracted our attention was the one corresponding to N = 50 spaces, where the cycle time is 3.27 minutes, slightly higher than the one obtained with N=40, but moreover, the simulation results indicate that the average blocking probability for the heel station is 0.25 [Table 13].
Analyzing both cases, we observe that the optimum solution for N=40 is Assembly 1=2 and Seam Folding = 4 spaces, and the optimum arrangement for scenario N=50 is Assembly 1=6 and Seam Folding =10; in the scenario N=50, a higher amount of material is allowed in the queue, which, will increase the average WIP in the operation and, in turn, increase the CT on the line, although the difference is marginal [Figure 4a and 4b).
6. Conclusions
Decision-making is a task that requires the use of tools that lower the associated uncertainty. The manufacturing system is subject to sources of randomness, and this makes the task more complex. If the analytical expressions are not available or are complex, one strategy is to apply the simulation-experiment design-optimization approach to get a metamodel that incorporates the variables of interest. This provides us with approximate information about the system in question. The buffer assignment problem (BAP) is an example of the need to resort to the use of metamodels. It is not common to find real case studies where the BAP is applied; the above includes the footwear industry.
In this work, the problem of distributing the available spaces in a shoe production line was presented, minimizing cycle time. In this case, it was necessary to obtain the cycle time and production models as a function of B i ‘s. Several interactions between stations were found to be significant; each interaction shows the effect of the buffer between pairs of stations.
The optimization model allows determining the best allocation of spaces in the line, reducing the associated uncertainty due to the stochastic nature of the system.
We observed that the cycle time follows a non-linear behavior vs. the total amount of work in process on the line (N). In the sensitivity analysis, a value of N was found where TC reaches a minimum value. Due to the fact that it is a process with unequal processing times, the optimal allocation of spaces (B 1, B 2, …, B n ) follows a non-uniform arrangement on the line.
Still, it is convenient to consider other factors to decide; in our case, assigning a certain amount of spaces will generate the phenomenon known as blocking; when analyzing the solutions, this parameter allows locating where an interruption of flow within the line will occur most frequently.

