


 English (pdf)
 Article in xml format
 Article references
 Send this article by e-mail
 Cited by SciELO
  Cited by Google
  Similars in
SciELO
Similars in
SciELO  Similars in Google
 Permalink
1. Introduction
1.1 Project description
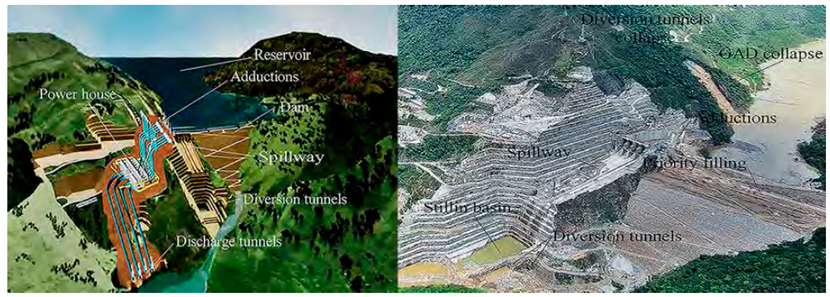
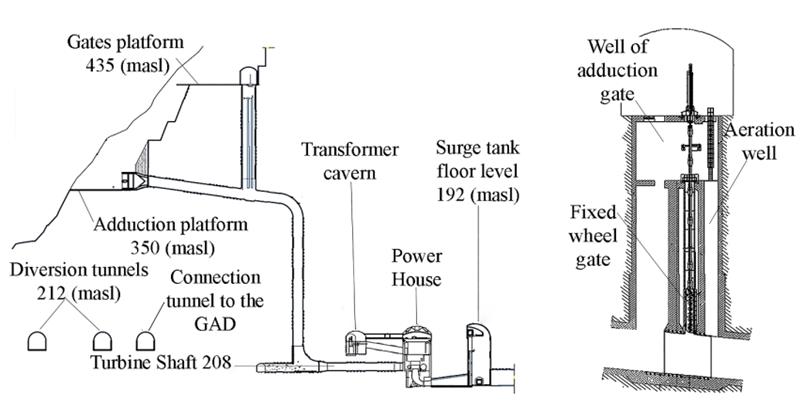
Hidroituango dam is a hydroelectric project constructed in the Río Cauca basin in the North of the Department of Antioquia (West of Colombia). It is a 220 m high Earth-Core Rock-fill Dam (ECRD) with the following design parameters: a reservoir of 2700 Mm3 with regular operation on 420.00 masl (meters above sea level); a spillway designed for a discharge capacity of 23,250 m3/s under four radial gates; an intermediate discharge tunnel with a capacity up to 450 m3/s; and three diversion tunnels (the last one is called theGalería Auxiliar de Desviación or GAD). The intake structure is made up of two submerged civil structures with four independent penstocks; each one of them has a diameter 6.6 m. Fixed trash racks allow the flow of water to the eight turbines/generator assembly fixed in vertical axes in the powerhouse, which are connected with two surge tanks downstream and four discharge tunnels. The flowing water returned back to the Río Cauca through the discharge tunnels. Figure 1. shows a general schematic diagram of the project.
1.2. Contingency context
On April 28, 2018, two months prior to the starting of the scheduled fill of the reservoir, a collapse occurred [1,2], and the Río Cauca was diverted through GAD during the dam construction. This tunnel had been in operation for about seven months until a landfall blocked the tunnel access. This blocking resulted in the anticipated filling of the reservoir, exposing the dam and the spillway to the risk of overtopping. At that time, the level constructed of the dam was 385.00 masl (77% of the total height). The level of the spillway is at 401.00 masl, and at the entrance of the intake structure, it is at 350.00 masl. Because of the existed adverse condition at that time, on May 10, 2018, it was necessary to divert the water through four of the eight adduction tunnels of the intake structure (1, 2, 7, and 8), aiming to prevent the overflow in the dam and the spillway. At that time, the powerhouse was not finished, the connection of penstocks and spiral cases of the turbines was not over and so the diversion lead to the flooding of the machines' room.
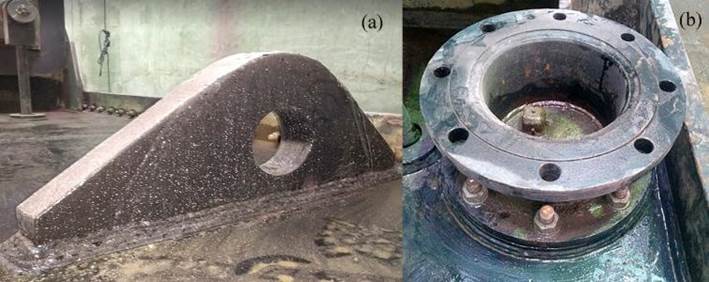
Further, the pressure wells 7 and 8 of the intake structure collapsed in the middle of May 2018 due to the damage caused by the free flow falling into these wells. This situation forced the closure of gates 7 and 8 with balanced pressure. As a consequence, the remaining flow passing through adductions 1 and 2 peaked at roughly 725 m3/s, which caused damage in wells 1 and 2 resulting in induced rock instability around those wells [3], making a cavity or rock hollow. These adverse events led to the immediate closure of gates 1 and 2 against the free flow. This situation warranted a high complexity in operation involving processes such as aeration, high water velocity with several energy levels, and hydraulic transients that act as multipliers of the dynamic forces occurring within the hollow rock [Figure 2].
1.3 Risks and potential failures related to the closure of the gates
Failure of the closing operation of the gates could have created other failures such as a fracture of stems due to high vibrations, excessive deflections or deformations on the gate structure, rupture or damage of the springs on counterguards wheels, damages on the aeration well due to unsteady flow during the closure, slide, and fracture of rocks into the mountain above the adduction structure, among others. All these potential failure modes mentioned could happen due to the abnormal fluctuation of hydrodynamic forces; these forces are affected fundamentally by phenomena such as vibration due to the forces induced by the instability and turbulence of free flow, by the movement of the gate itself, and by oscillations produced due to the strong interaction between the gate and the flow.
Many of these failure modes are found in technical reports and case studies related to hydraulic gates [4-11]. There is a special literature that highlighted the significant failure occurred in a fixed-wheel gate at Campos Novos Dam in Brazil in 2006 [12].
1.4. Gate Characteristics
Generally, a fixed-wheel gate for this kind of intake structure is designed to close underbalanced pressure, i.e., hydrostatic flow conditions, without any flow. But, given the unstable situation, these emergency-driven operations necessitated the need for the design of the gates and were constructed to resist closure against flows up to the turbine's runaway flow rate (177 m3/s). The nominal flow for the turbine is 168 m3/s.
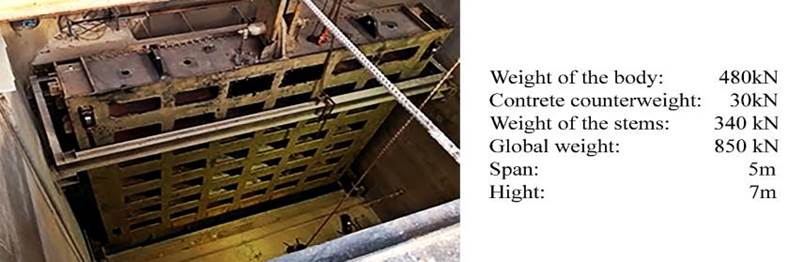
The gate was designed following the standard DIN 19704/1976. The closure operation was designed so that its ease of operation is facilitated by its weight, in addition to the stem system weight and a concrete counterweight [Figure 3]. The normal hydrostatic design pressure was estimated for a maximum level of operation of the reservoir at 420.00 masl, and its exceptional pressure was related to the probable maximum flow (PMF), which would raise the level of the reservoir to level 435.00 masl. The sill level of the gate is 342.65 masl.
1.5. Gate adjustments before the closure
Before the closure, it was necessary to implement some modifications on the gate, intended to keep all risks under control and withstand the challenges due to the uncertainties during the closing operation.
Original “Belleville” springs were replaced by stainless steel coil springs due to the deterioration that occurred in the original springs during the contingency time. Some of the characteristics of these elements are illustrated here [Figure 4].
The pressure capacity of the hydraulic power unit of the gate was set up near to the test pressure (from 23 MPa to 30 MPa), or in other words, the force at the servomotor was increased from 3200 kN to 4700 kN. This setting would allow to re-open the gate if at all it was stuck during the closure.
A pair of lifting handles with 2 in. thick was also welded on the top of the gate to install three steel core cables on each side of the gate. Every cable was 1 in. diameter and could lift 25 tons. Further, these cables were controlled by a jib tube and a 300 tons crane. The purpose of this modification was to momentarily lift the gate from the jammed side while the servo motor fully supported the weight of the gate. Moreover, a special steel chamber was welded in the same manner to install three accelerometers to measure vibrations in the three axes in the body of the gate [Figure 5].
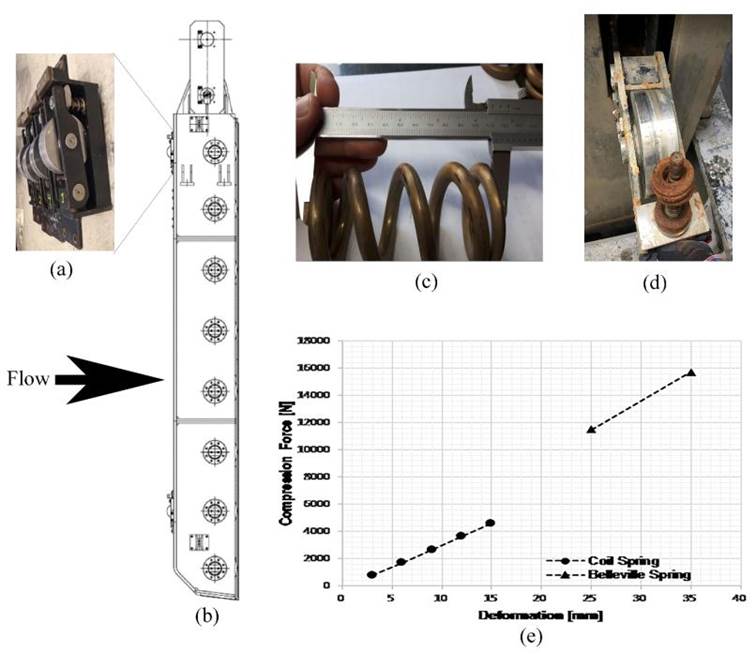
Figure 4 Counter guide wheels (a), Gate sketch (b), Steel coil springs (c), Belleville springs (d), and Strength-deformation curve for the springs (e)
2. Flow phenomena
2.1. Expected hydraulic behavior during closure operation
Water flows as a free surface flow through the tunnel before the closure the gate. Flow can be a mixture of air bubbles and sediments entrained at the intake adductions. The maximum flow velocities could be near 30 m/s for water and 70 m/s for air. When the gate is closed, the free surface flow is disturbed adversely, and the sudden fluid-structure interaction leads to sudden pressurization, with instantaneous pressure fluctuations due to transient flow behavior and highly turbulent air-water flows, thus leading to extensive stress on the reinforced gate.
During the planning and designing operations, several semi-analytical and numerical methods were used to predict the behavior of the complex system under study. The main variable under study here is the hydrodynamic force, or “downpull” force, which is generated due to the interaction of a manifold of fluid-structure interaction processes.
Based on these analyses and assuming very conservative factors, the estimated maximum force in the servomotor during the closure of the gate could be near to 3200 kN at 70% of the opening and 4000 kN at 20% of the opening if it was required to re-open the gate again.
2. 2 Aeration
According to previous studies [13-18], when a vertical gate is closed, that cross section becomes a hydraulic control point as the regime changes from free surface flow to pressurized flow. In the same manner, when the gate is closed, the height of the column of water contained within the aeration well is decreased until negative pressure has occurred downstream of the gate.
As considerable turbulent energy occurs during this process close to the free surface, aeration is expected to occur [19,20], leading to changes in macroscopic flow properties (compressibility and bulking). Challenges associated with air-water flows are significant scale effects [21], which limit the applicability of previous experimental, laboratory-based studies as well as the prototype data presented in this study.
Due to turbulence and the high velocity of the flow passing between the lower lip and the gate seat, sub-atmospheric pressures are produced downstream of the gate. These negative pressures could fall below the vapor pressure of the water leading to cavitation and inducing large fluctuations in the pressure field, generating strong mechanical vibrations on the gate. This latter generates serious problems, such as the collapse of structural elements of the gate and civil works. The expected range of air velocities through the aeration well can fall between 45 to 90 m/s [22-24].
2. 3 Downpull force
According to some authors [25-31], the analytical calculation of the downpull force in a fixed-wheel gate can be estimated through Equation (1):
Where F dp : downpull force (kN), K: downpull coefficient, γ: specific weight of water (kN/m3), B: width of the gate (m), d: thickness of the gate (m), H: operating head on the gate bottom (m)
Calculation according to Naudascher (1991)
Equation (2) shows Naudascher proposed the estimation of the downpull force as a sum of three different terms:
F 1 stems from the difference of the integrated distributions of the piezometric head on the top surface (KT) and the bottom surface (KB) of the gate. As per the most common arrangement with seals and skinplate on the downstream side, F 1 may be expressed as Equation (3)
F 2 y F 3 is the residual part of the downpull and stems from the pressure difference acting on the extended skinplate (Equation (4)] and such horizontal protrusions of the gate as the top seal (Equation (5)]:
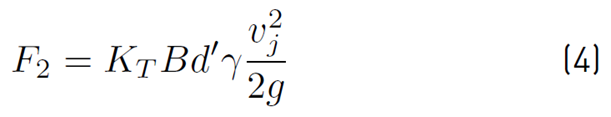
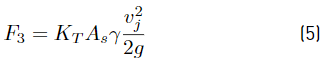
Where d’: thickness of the skinplate (m), V j : velocity in the contracted jet emerging from underneath the gate (m/s), g: gravitational force (m/s2), A s : area of the horizontal projection of the top seal (m)
Calculation according to Knapp (1960)
This author proposed Equation (6) for calculating the downpull force:
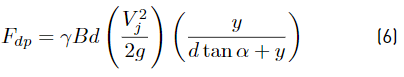
Where y: Opening of the gate [m], y 0 : Maximum gate opening [m], α: angle of the bottom lip of the gate
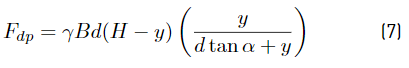
Calculation according to Kulka (1928)
This author proposed the Equation (7) for calculating the downpull force:
Proposed method
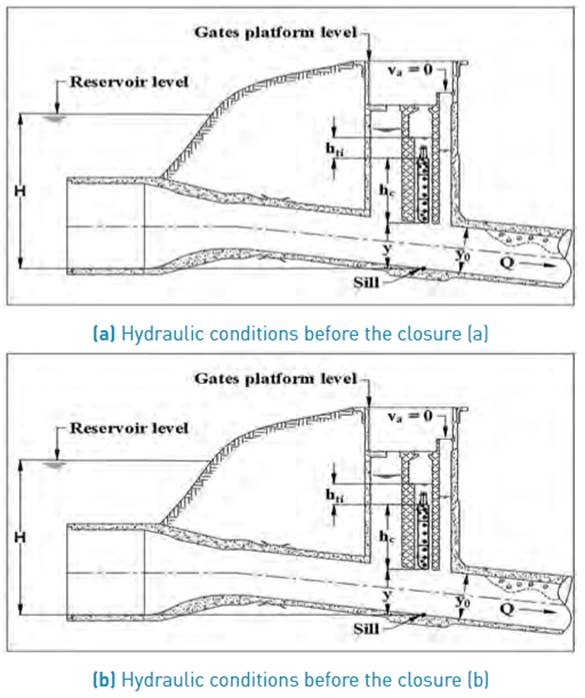
Before the closure of the gate, a piezometric sensor was installed at the top of the gate to measure the pressure due to the water column acting on it. shows data of the head on the top surface of the gate due to the water column over it measured during the closure.
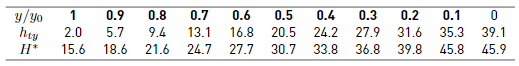
Where y/y 0 : Opening of the gate (ad), h ty : Head on the top surface of the gate due to the water column over it (m), H * : Head on sill due to the water column into the well of the gate (m).
The increase of the water column into the well of the gate could be considered as a slope line between the parameters h ti = 2 m (h ty at y/y 0 = 1) and h tf = 39.1 m (h ty at y/y 0 = 0). This line represents the head on the top surface of the gate. Figure 6. shows the variation of the water column into the well of the gate during the closure.
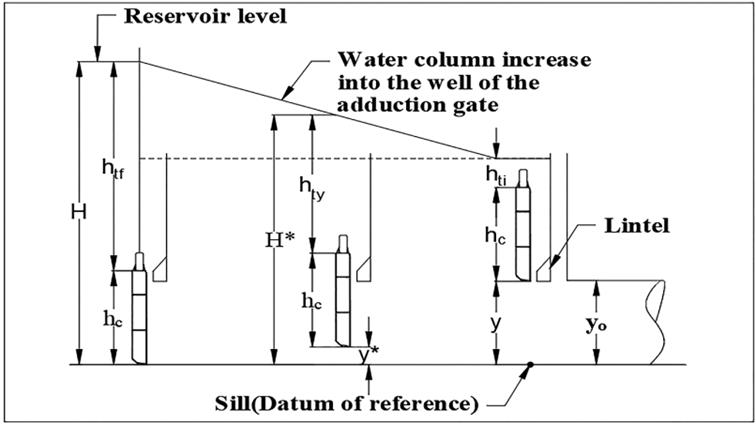
If y=h c (at 100% Opening, i.e., @ y/y 0 =1) and taken the sill as a “Datum of reference,” then the slope of this pressure line could be calculated by Equation (8):
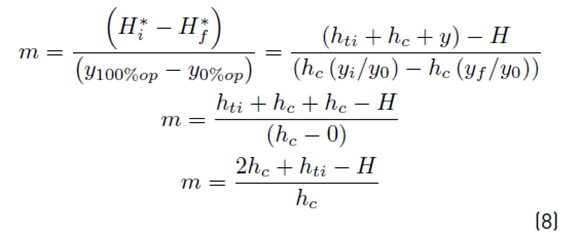
The pressure into the well of the gate during the closure (H*) could be calculated using the equation (8) and the following expression:
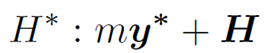
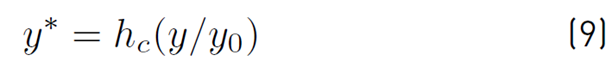
But y* is the Opening of the gate during the closure (m) and Equation (9) shows propose for calculating
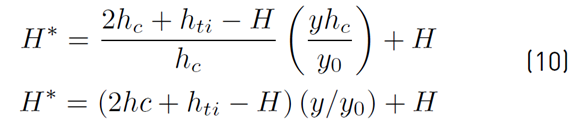
Using Equation (10), the head on sill due to the water column into the well of the gate during the closure could be calculated.
Using these expressions and with the data obtained during the closure, Suárez and Vera constructed Equation (11) to calculate the downpull force for this kind of closure, i.e., under free-surface flow conditions:
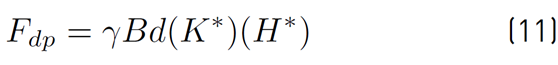
Where K * : coefficient of downpull proposed by Suarez and Vera = 1.5
Finally, Figure 7. shows the hydraulic progression during the closure of the gate.
2.4. Vibrations analysis
Excitation frequencies
Based upon some authors [32-37], the literature in the design of a submerged gate, it is important to consider the mechanical vibrations induced by the flow. When the gate closes, the fluid-structure interaction generates excitation frequencies that might eventually be coupled with some mode of vibration of the gate-stems assembly and enter resonance, which could be extremely dangerous during the closure of the gate.


3. Instrumentation
3.1. General remarks
Several sensors were installed on the gate and on the pressure and aeration wells of the intake structure for instantaneous monitoring of the operation. An acquisition and processing data system was designed to help mitigate risks during the critical closure operation. Moreover, this also provided an opportunity for subsequent data analysis, which is herein, reported, and may reduce the uncertainty of future downpull force predictions, thus helping future safer closure operations.
3.2. Data acquisition and processing systems
A system was developed to adequately monitor and record the critical variables involved during the closure. The most important one is hydrostatic pressure through water levels in the gate and aeration wells. Further, air velocity, acceleration of the gate in three orthogonal directions, and pressure in the annular chamber of the servomotor are also monitored. These variables were grouped into two categories based on the nature of their variations: dynamic and quasi-static variables. The quasi-static signals are composed of frequencies less than 2 Hz, while the frequency content of the dynamic signals can be extended up to 500 Hz. This classification helped and guided the specific development of the hardware and software components.
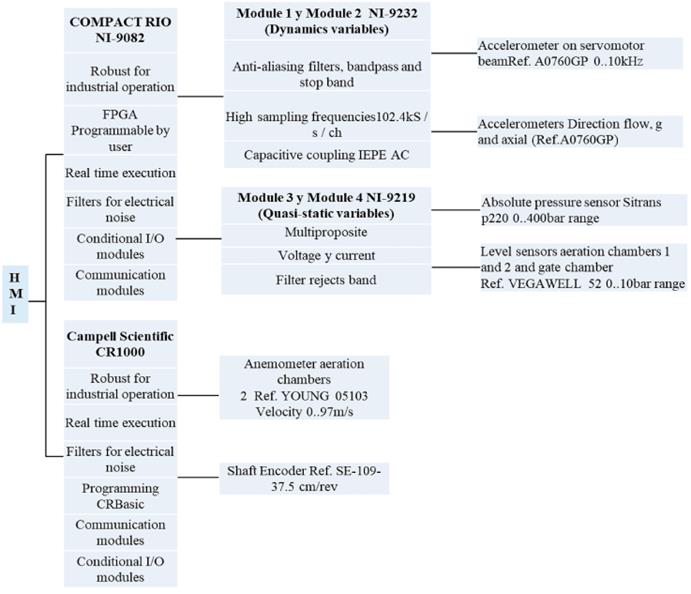
3. 3 Hardware
A distributed architecture was adopted with two data acquisition systems duly configured and synchronized. The first one is the Campbell Scientific CR1000 recorder that received and conditioned the quasi-static signals of the anemometers and the “shaft encoder” used to measure the position of the gate. This device can filter electrical noise generated by other equipment connected to the network. The sampling of this equipment was carried out in real-time, utilizing an RS232 protocol to 19200 bauds every 500 ms.
The second is the National Instruments cRIO NI-9082 industrial system with modules for the acquisition and signal conditioning of quasi-static signals and other modules for dynamic signals. The first type of module received signals from three accelerometers located on the gate in the direction of flow, gravity, and transverse directions. The conditioning of these signals included AC couplings and anti-alias filters. Samples were collected simultaneously from accelerometers at a rate of 1024 samples s-1 that allowed investigation of the vibratory phenomena up to 512 Hz.
The second type of module is connected to the pressure of the servomotor and the water levels in the gate and aeration wells. All these signals were in the range +/- 25mA. It should be noted that the sampling frequency was set to 9.09091 Hz with a 60 Hz reject-band filter (frequency of the low voltage network) [Figure 8].
4. Results
The gate of tunnel 2 was successfully closed on January 16, 2019, against 300 m3/s of free flow and the gate of tunnel 1 on February 5, 2019, while passing at 425 m3/s.
The main results obtained from these closures are summarized.
4. 1 Aeration
The closure of the gate of tunnel 2 was carried out with the level of the reservoir at 388.50 masl, when the water was flowing at a rate of 300 m3/s through tunnel. The maximum velocity of the air through the aeration well was 30 m/s at 90% of the closure of the gate (i.e., 10% opening).
The typical behavior of the aeration was affected as the well of aeration was ruptured when the closure was at 77% of the closure, as a result of the increase of the size in the rock hollow of tunnel 1, below the top elbow of concrete at the conduction, downstream of the gate. From that moment, the air that enters through the aeration well of gate 1 began leaving through the aeration well of gate 2 and expelling water and rock particles at high speed, which posed a great risk to the people who were closer to the maneuver. The mountain that had been monitored with anti-seismic sensors experienced very high vibrations, reaching the highest levels established for a safe closing operation.
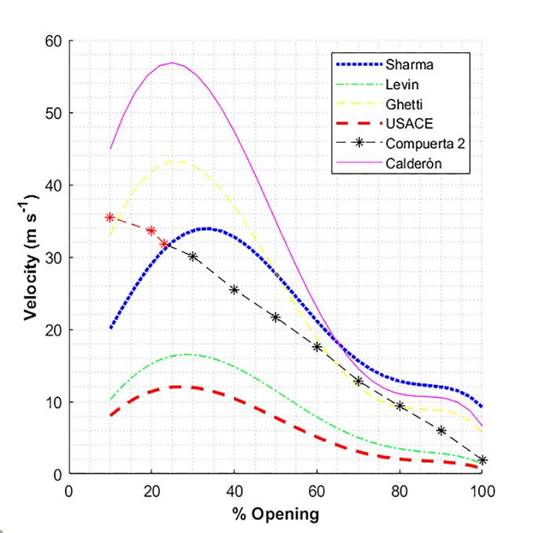
Figure 9 shows some estimated curves and the data of aeration measured during the closing.
4. 2 Operation force of the gate
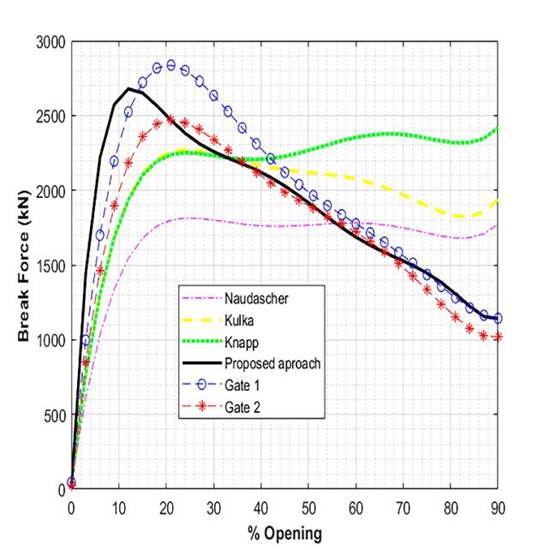
The estimated forces of the gate based on previous studies are shown in Figure 10.
Further, the sampled forces during the closure operation of the gates N°1 and N°2 and the newly proposed equations (8) and (9) are also included.
4.3. Fluid-structure interaction
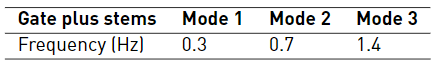
The excitation frequencies in the direction of the gravity vector were calculated and are presented in Table 6.
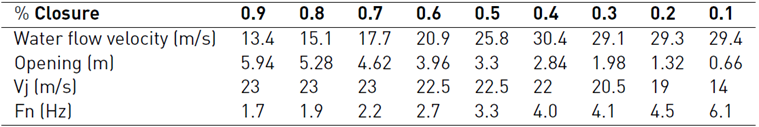
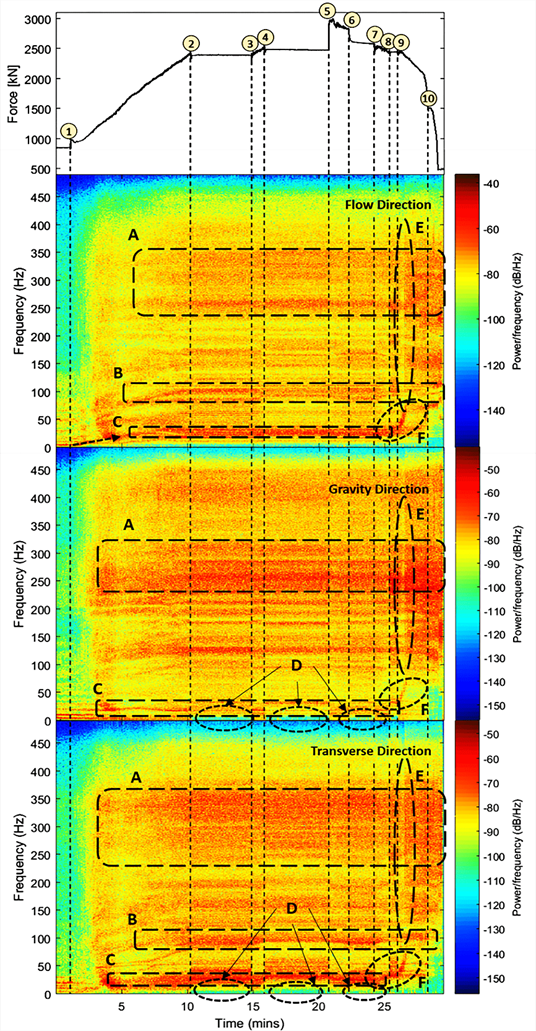
Figure 11. shows a frequency analysis of the sampled forces in the gate N°2.
Numerical marks included in the figure correspond to:
Start of the closure of the gate.
At 9.1min, the gate was at 61% of the closure, and it was necessary to stop the operation because the connection between the pressure wells 1 and 2 was noticed, i.e., a huge rock hollow has been created between both wells.
At 13.5 min, the decision was made to continue with the closure despite the connection between the pressure wells.
At 14.9 min, the gate was at 71% of the closure; the operation was stopped again due to the interference between the hoisting system of steel cables and the servomotor of the gate.
At 19.4 min, the decision was made to open the gate by 30 cm to solve this interference.
At 21.2 min, the gate returns to 66% of the closure. The hoisting system of steel cables was positioned in front of the servomotor of the gate.
At 23.1 min, the closure operation was restarted again.
At 24.3 min, the gate was in 77% of the closure, and it was necessary to stop the operation again due to strong transients and trepidation in the aeration well of gate N°2, which produced the sudden change in the flow direction of the air, expelling air with earth and rocks and water coming from the connection between the pressure wells and the rock hollow.
At 25 min, it was decided to continue the closure operation.
At 27.2 min, the gate was in 97% of the closure, but a strange behavior of the gate occurred due to interference between the steel cables and the lintel of the gate.
Finally, at 28.4 min the closure operation of gate N°2 was finished.
The alphabetical marks shown in the figure show a selection of inferences associated with the hydraulic phenomena presented during the closure operation, based on the data obtained by the instrumentation system installed in gate N°2:
A range of frequencies between 230 and 350 Hz was noted, which are related to some harmonic modes of vibration of the gate structure. These can be estimated by hydrodynamic phenomena. This behavior developed from the moment the gate contacted the surface of the flow and remained constant until the complete closure.
An exciting frequency is observed below 100 Hz, which conforms with the adhered mass of water (see mode 4 in Table 2].
The excitation of a frequency near 29 Hz was observed, which concurs with the natural frequency of the servomotor beam (see in Table 5]. This frequency showed a change when the gate first gets in contact with the free surface of the flow (backflow) due to the shift in the adhered mass.
It was observed that when the gate was stopping (see point 3 indicated in the figure), frequencies below 10 Hz have disappeared. These frequencies appear to be caused by other vibrating modes similar to the produced by the movement of the gate seals in contact whit its seal plate.
A slight attenuation of the vibrations was observed in 97% of the closure, due to the subsequent effect of the transient occurred in the aeration well N°2 (see marks 8 and 9) and the impact that produced the entry of air from the well N°1 through the rock hollow.
An increase of the frequency is indicated in Table 2, and it was observed due to the decrease of the mass adhered during the approach of 100% of the closure and due to the interference between the steel cables and the lintel of the gate.
5. Results analysis
The analysis was done based on the collected data is presented, considering the calculations and estimations made before executing the closure of the gate N°2:
The pressure data obtained from the variation of headwater into the well of the gate (H * ) and the hydraulic pressure at the annular chamber of the servomotor (see Figure 10] during the closure operation was fundamental and instrumental to determine the downpull factor (K * ).
It was possible to estimate more accurate curves of the hydrodynamic force involved in the closure of the two gates under a free-surface flow condition using the parameter H * in the equation (9) instead of the pressure of the reservoir (H).
Based on the results presented in figure 9, it can be deduced that the aeration associated with the closure of gate N°2 showed a behavior very similar to that estimated with the Ghetti and DiSilvio equation up to 50% of the closure. Further, aeration was affected between 50% and 100% of the closure due to the connection between the pressure wells and the rock hollow.
From the results presented in figure 10, it can be figured out that the lifting force at servomotor for a closure of a fixed-wheel gate against free-surface flow could be estimated in a more conservative way using the Naudascher method but calculating this force with the real headwater into the well of the gate. To obtain a more accurate estimation of this lifting force, equations (8) and (9) proposed by Suarez and Vera could be used.
6. Conclusions
The following are some conclusions and recommendations that could be drawn from the results of the investigation:
The methodologies used to calculate the hydrodynamic forces for this type of gate are based mainly on experiments carried out in hydraulic models designed on a reduced scale. Contrarily, the result obtained in the gate analyzed is a real case where the gate was instrumented; in such a way that comparable values were obtained with the forecasts obtained using those methodologies.
Due to the connection that appeared between the rock hollow and the pressure wells 1 and 2, the behavior of the aeration was moderately affected regarding the expected behavior. Nonetheless, the methodology of Sharma allowed establishing adequate decision criteria in terms of the maximum typical velocity for this type of gates.
During the closure of the gates, many excited frequencies were observed, but none increased its amplitude during the whole operation, which allows inferring that the dampening of the gate was satisfactory using coil springs installed on the rear wheels of the counter-guides.
Some frequencies related to the cavitation phenomenon could be associated with the spectrogram, which allows confirming that the restriction is typically associated with a gate of this type as it is commonly known that it is not advisable to partially operate these gates, either temporarily or long periods.
The instrumentation, software, and hardware suitable for the closure operation were essential components to ensure the successful closure of both gates, as they allowed keeping control of the movements required in each of the adverse situations that arose.
The setting test of the calculated curves was relevant as it indicated to the teamwork that all the analytically performed curves and the previous conditioning of the oil-hydraulic system would be above the real, due to very conservative factors that designers and gates calculators considered and used.
During the reopening of the gate, behavior similar to that of closing was observed and, as expected, with higher operating forces around 5% under the same hydrodynamic conditions.
It is concluded that the maximum lifting force occurred approximately at 77% of the closure for the two gates (roughly 23% opening). This behavior is closer to the hydrodynamic analysis proposed by Naudascher et al. (1994) and concurs with the typically accepted percentage where the maximum hydrodynamic force in fixed-wheel gates should occur.

