


 English (pdf)
 Article in xml format
 Article references
 Send this article by e-mail
 Cited by SciELO
  Cited by Google
  Similars in
SciELO
Similars in
SciELO  Similars in Google
 Permalink
1. Introduction
The 21st century has been characterized as one of the greatest times for scientific innovation[1,2], where industries such as aerospace, nuclear, automotive, and energy entail new research scenarios. Moreover, the new engineering components demand requirements that include high specific, mechanical, and thermal properties for reducing fuel consumption and instrument weight, and increasing the safety factor [3]. For these reasons, nanocomposite materials arose as a viable solution, allowing a new era for materials science.
Considering the above mentioned, several authors proposed a new manufacturing technique for nanocomposites materials known as the sandwich process that includes intercalated layers of metal lamina and polyvinyl alcohol with carbon nanotubes (PVA/CNT), allowing an increase of 100% in the elastic modulus regarding monolithic materials [4]. On the other hand, some authors explore the manufacturing conditions in the ball-milling process, demonstrating the possibility of obtaining uniform dispersion and alignment of CNTs in an aluminum matrix [5].
However, the lack of knowledge about the prediction of the mechanical properties in composite materials represents a challenging aspect of the component design, manufacturing process optimization and the scaling of experimental works to industrial applications. In general, these problems involve a high cost and time consumption to obtain specific mechanical properties in a composite material [6]. Some of the solutions that have been implemented are based on mathematical approaches that include matrix and reinforcement parameters for the determination of mechanical properties such as effective tensile strength, elastic modulus and shear strength [7].
For these reasons, some authors propose using mathematical relations named Rule of Mixtures, where the effective strength of the nanocomposite material can be determined as a volume-average of the tensile strength of the constituent materials, namely, matrix and reinforcement [8] (Equation (1)]. Moreover, other works consider the effect of reinforcement orientation, using a Shear Lag Model (Equation (2)]; this model considers a perfect interface bonding between matrix and reinforcement where the aspect ratio and orientation of the reinforcement generates a change in the composite effective tensile strength [9]. Additionally, the Halpin and Tsai model (Equation (3)] has been used to explain the nanocomposite materials’ behavior; this model contemplates that the increase of aspect ratio of reinforcement and the ratio between reinforcement and matrix tensile strength leads to an increase in nanocomposite effective tensile strength [10].
Where
 re the effective tensile strength based on the Rule of Mixture, the Shear Lag model and Halpin and Tsai model, respectively; V
r
and Vm are the volume fractions of the reinforcement and the matrix, respectively; ϑr and ϑm are the tensile strength of the reinforcement and matrix, respectively. Finally,
re the effective tensile strength based on the Rule of Mixture, the Shear Lag model and Halpin and Tsai model, respectively; V
r
and Vm are the volume fractions of the reinforcement and the matrix, respectively; ϑr and ϑm are the tensile strength of the reinforcement and matrix, respectively. Finally,
 and η are the effective aspect ratio of the reinforcement, geometry relation determined as ξ = 2l/d (land d are the reinforcement length and diameter, respectively), and a relation specified as η = [(ϑr/ϑm) − 1] / [(ϑr/ϑm) + ξ]. For more details about the meaning of these parameters, see [8-10].
On the other hand, Leidner and Woodhams Model (Equation (4)] explains the effective tensile strength of the nanocomposite material with the inclusion of the interface interaction between matrix and reinforcement; for this interaction, the interface thickness and the shear modulus of the matrix have an important influence on such mechanical property [11]. Furthermore, Kelly-Tyson Model (Equations (5) and (6)], considers the maximum stress transfer of the reinforcement to the matrix, also, this characteristic is compared with the reinforcement length at which the fracture strength of the reinforcement is reached [10]. Also, the Zhang Chen Model (Equation (7)] includes information on the Burgers vector and shear modulus of the matrix for the effective tensile strength; this model explains that the manufacturing temperature and the thermal expansion coefficients of matrix and reinforcement imply an increase in nanocomposite mechanical properties [9].
Where
 stand for the effective tensile strength obtained by Leidner and Woodhams model, Kelly-Tyson model and Zhang Chen model, respectively; ϑi , C, S, l and l
c
a are the tensile strength in the composite interface, level of stress transfer between matrix and reinforcement, the stress concentration parameter, the reinforcement length and the critical reinforcement length (reinforcement length at which the fracture strength of the reinforcement is equal to the maximum stress transferred to the reinforcement), respectively: The coefficient “A” includes the effects of manufacturing temperatures, test temperatures, and thermal expansion coefficients, while coefficient “B” introduces a relation between Burgers vector and shear modulus of the matrix, and diameter and the volumetric fraction of the reinforcement. For more details about the meaning of these parameters, see [9-11].
stand for the effective tensile strength obtained by Leidner and Woodhams model, Kelly-Tyson model and Zhang Chen model, respectively; ϑi , C, S, l and l
c
a are the tensile strength in the composite interface, level of stress transfer between matrix and reinforcement, the stress concentration parameter, the reinforcement length and the critical reinforcement length (reinforcement length at which the fracture strength of the reinforcement is equal to the maximum stress transferred to the reinforcement), respectively: The coefficient “A” includes the effects of manufacturing temperatures, test temperatures, and thermal expansion coefficients, while coefficient “B” introduces a relation between Burgers vector and shear modulus of the matrix, and diameter and the volumetric fraction of the reinforcement. For more details about the meaning of these parameters, see [9-11].
The requirement of increasing the prediction accuracy for effective tensile strength has led some authors to consider the inclusion of all strengthening mechanisms generated for the nano-reinforcement in the matrix. For this reason, several authors define that the behavior of the nanocomposite’s effective tensile strength depends on the matrix tensile strength, maximum load transfer between reinforcement and matrix, the interaction between the reinforcement and matrix dislocation, and thermal mismatch caused by the differences of thermal expansion coefficients of constituent materials [12]. These characteristics can be considered in several ways. For example, the Arithmetic Summation Method (Equation (8)) presents the nanocomposite’s effective tensile strength as the addition of the parameters mentioned above (matrix tensile strength, maximum load transfer between reinforcement and matrix, the interaction between the reinforcement and matrix dislocation, and thermal mismatch). On the other hand, the Quadratic Summation Method (Equation (9)] specifies that the summation of the squares of the strengthening mechanism is proportional to the square of the nanocomposite’s effective tensile strength. The Compounding Method (Equation (10) and Equation (11)] determines that all the strengthening mechanisms relate to each other and with the yield strength.

Where
 are the effective tensile strength obtained by Arithmetic Summation Method, Quadratic Summation Method, and Compounding Method; respectively
 ;
;
 and
and
 are the maximum load transfer between reinforcement and matrix, the interaction factor between matrix dislocations and reinforcement, and the thermal mismatch caused by the difference on thermal expansion coefficients, respectively [12].
With the objective to implement a comparative assessment between the mathematical models abovementioned, this work develops a new taxonomy that allows classifying the models taking into account the following factors: required parameters, necessities of experimental tests, mathematical robustness, among others. The taxonomy proposes to classify the models into three generations, which are evaluated and compared in the present work considering precision, computational cost and the demands on material characterization. Finally, the comparative assessment provides relevant information about the accuracy of the models in predicting tensile strength. Additionally, it is observed how the inclusion of geometric variables of the reinforcement (diameter, length, aspect ratio), and stretching mechanisms, among others, affect the response of the effective tensile strength in nanocomposite materials.
2. Materials and methods
2.1 Taxonomy for the effective tensile strength models
The classification of analytical models provides the possibility to compare each other following the next criteria: physical phenomena, input variables, and the requirements of material characterization; precision and computational cost are other relevant criteria. The developed taxonomy suggests the classification of the existing models into three families: First Generation, Second Generation, and Third Generation, as can be observed in Figure 1. The flowchart specifies the main features (conditions, modifications, phenomena analysis, strengthening mechanism) and some examples of analytical models for each family. Accordingly, the First-Generation family comprises the models that provide the basis to describe the mechanical behavior of nanocomposites and the starting points of calculation of effective properties in material science, such as the Rule of Mixtures, Shear Lag model, and Halpin and Tsai model. Models of the Second Generation include modifications of the First-Generation models to improve the prediction accuracy by using other additional mechanical properties, phenomenological variables, and fitting constants, such as the shear modulus, interface interactions factors between matrix and reinforcement, and reinforcement geometry, among others; Zhang Chen, Leidner and Woodhams and Kelly-Tyson models are incorporated in this second family. Finally, Third Generation models account for other aspects such as manufacturing characteristics (process temperatures, reinforcement concentration, and test conditions), a combination of stretching mechanisms, and additional phenomenological factors accounting for the interaction between matrix and reinforcement (difference of thermal expansion coefficients, load transfer from reinforcement to the matrix, among others); models like Arithmetic Summation Method, Quadratic Summation Method and Compounding Method take place in this third family.
2.2 Comparative assessment of analytical models
For the development of the computational algorithms and the comparative assessment between the analytical models, three analysis phases are considered, see Figure 2. The flowchart explains the interaction between the phases, the taxonomy developed, and the importance of computational models in the determination of nanocomposites’ effective tensile strength. The first phase is the identification of the main models of each generation, for which they are determined the input variables, reinforcement concentration ranges, model assumptions and different physical phenomena that explain the changes in the nanocomposites’ effective tensile strength. The second phase is the selection of benchmark works for comparison purposes where it is important the search for experimental studies that contain the input variables identified in phase one and the effective tensile strength of the nanocomposite; also, it is relevant that the selected researches include a phenomenological analysis about the increase of tensile strength in nanocomposites since this information allows a comprehensive examination of the model input parameters and the relative error obtained. Finally, the last phase is the comparative assessment of the results obtained by the analytical models and results of experimental benchmark works.
3. Results and discussions
3.1 Accuracy and robustness assessment of analytical models
The analytical models considered in the present work are run with data from Table 1. The comparative assessment uses the experimental research of Feijoo et al. [13] , where the nanocomposite is a Metal Matrix Composite (MMC) of 7075 aluminum alloy reinforced with multiwall carbon nanotubes (MWCNTs). The selected work presents the main characteristics of the manufacturing process, properties of the matrix and reinforcement, and test conditions, allowing the identification of the input variables that each model requires [Table 1]. In such a work, nano-reinforcement weight content ranges between 0.5 wt% and 1 wt%; also, nanocomposites were developed by powder metallurgy assisted with high energy ball milling (HEBM) to improve the nano-reinforcements dispersion, and additionally, hot powder extrusion (HPE) at 500°C was employed for mechanical consolidation. The Microstructural characterization was carried out by X-Ray diffraction and Scanning Electron Microscopy (SEM). The mechanical characterization included Vickers micro-hardness measurements (HV0.2) and tensile tests performed at room temperature with an MTS tensile testing machine.
For the accuracy assessment of the analytical models, the range between 0 wt% of MWCNTs to 2 wt% MWCNT was used; additionally, the analysis was performed considering the classification described in section 2.1. The experimental results were used in two nanocomposite compositions as presented in the research of Feijoo et al. [13], where the samples of AA7075-0.5 wt% MWCNTs and AA7075-1 wt% MWCNTs were tested. The comparative assessment is represented in Figure 3, with the First-Generation Models represented in Figure 3a, Second-Generation Models in Figure 3b, and Third- Generation Models in Figure 3c. To understand the accuracy difference between the generation models, the results are included in Table 2.
In Figure 3a, it is observed that the differences between experimental results and analytical results of First Generation models are remarkable, where the relative error is in the range of 44.7% to 47.2% and 38.5% to 44.5% for 0.5 wt% MWCNTs and 1 wt% MWCNTs, respectively. This behavior can be caused by the high dependency of input variables on wt% MWCNTs; additionally, it is correct to say that, under these First-Generation models, it is necessary a high amount of reinforcement for a high increase in the effective tensile strength.
The Second-Generation models [Figure 3b) have relative errors between 10.1% to 44.9% and 11.3% to 39% for 0.5 wt% MWCNT and 1 wt% MWCNT, respectively. Particularly, the Zhang Chen model is the most accurate one of the Second-Generation family; this model includes input parameters accounting for the manufacturing conditions, mechanical properties of the matrix, and other geometric characteristics. On the other hand, the Kelly-Tyson and Leidner-Woodhams analytical models have similar accuracy to the First-Generation models.
For the Third-Generation models represented in Figure 3c, the relative error ranges are between 24% to 47% for 0.5 wt% MWCNT, and 10.6% to 103.8% for 1 wt% MWCNTs. From this family, the Arithmetic Summation Method is the most accurate model, whereas the Compounding Method is the least accurate one. With this accuracy assessment, it is observed that in the Third Generation Models the inclusion of the stretching mechanism, as presented in the Arithmetic Summation Method or Quadratic Summation Method, leads to results close to reality.
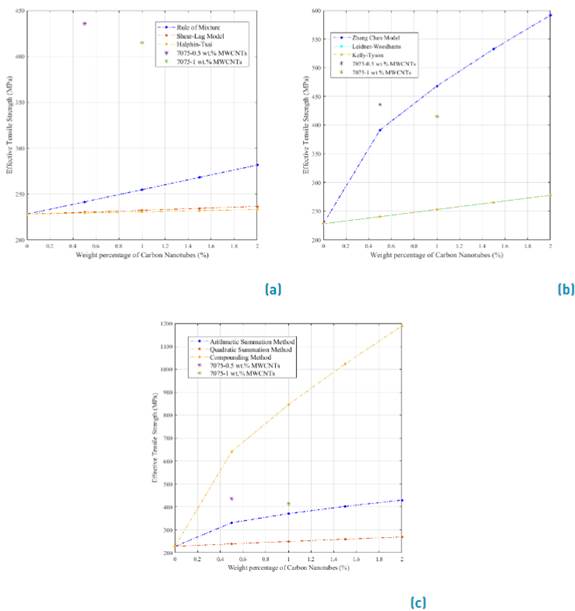
Figure 3 Computational models results, a) First-generation models, b) Second-generation models, C) Third-generation models
Table 2 Effective tensile strength for computational models and experimental research (MPa Units)[13].
To evaluate the consistency of the abovementioned results, some works devoted to the validation of analytical models are briefly mentioned. For the First-Generation models, some authors such as Law et al. [15] demonstrated that applying the Rule of Mixtures into a composite of polycarbonate matrix reinforced with short carbon fiber (0 wt% to 20 wt%) can generate a relative error of around 67% regarding experimental results. Additionally, the Halpin and Tsai model was applied by Zhou et al. [16] ] in an MMC of AZ31B magnesium alloy reinforced with carbon nanotubes (0 wt% to 4 wt%), obtaining a relative error of up to 43%. These results confirm that First-Generation models can lead to important sub-prediction of the tensile strength of nanocomposites for the weight contents considered here.
In the Second-Generation models, the application of the Kelly Tyson model by Gusev et al. [17] for an MMC of A356 aluminum alloy reinforced with nanofibers (0 wt% to 1.1 wt%) led to relative errors up to 31%, which is in the same order of magnitude as the results achieved here for such a model. Finally, Zhang et al. [18] used Third Generation models for an MMC of an aluminum matrix reinforced with CNTs (1 wt% to 8 wt%) and obtained maximum relative errors of 8%, confirming that models of this family can be very accurate.
A discussion about the robustness of the models can be built considering the required input variables, which are summarized in Table 3. Some variables correspond to physical, mechanical, or thermal properties of the constituent materials, which are determined by experiments having different kinds of errors; therefore, the larger the number of input parameters required, the higher the error carried on the model. According to Table 3, Third Generation models (ASM, QSM, and CM) and Z-C model imply almost the same number of input parameters (CM requires an additional parameter, namely, yield strength of the matrix), whereas the remaining models demand a smaller number of parameters, however, in general, these models are less accurate than the former ones. Accordingly, considering a trade-off between the number of parameters required and the relative errors previously obtained, ASM and Z-C remain the most appropriate models in accordance with the experimental work considered here. At this point, it is important to emphasize that all models considered in the present work have relevant assumptions directly affecting their robustness, such as the homogeneous dispersion and the nano-reinforcement orientation parallel to the applied force.
To compare the computational time of the evaluated models, considering that this can be short for one run, twenty successive runs are deemed for each model, obtaining the results shown in Table 4. In general, models requiring more parameters demand more computational time; however, this increment is justified, even for a large number of runs, considering the improvement in accuracy.
3.2 Behavior of effective tensile strength with nanotube weight content
For the comparative assessment of the analytical models, the range between 0 wt% MWCNTs to 5 wt% MWCNTs was used. A comprehensive analysis was performed considering the classification proposed above and the methodology of sections 2.1 and 2.2. The results of the relation between the weight percentage of carbon nanotubes (axis x) and the effective tensile strength of the nanocomposite (axis y) are shown in Figure 4, with the First-Generation Models represented in Figure 4a, Second-Generation Models in Figure 4b and Third-Generation Models in Figure 4c.
For the First-Generation Models, a linear increase of the effective tensile strength with the weight content of nano-reinforcements (wt%) can be observed, being the slope different for each model, with the most aggressive increase in the tensile strength occurring for the Rule of Mixtures (simplest analytical model). On the other hand, the Shear Lag and Halpin and Tsai models predict considerably smaller tensile strengths than ROM.
Kelly-Tyson, Leidner-Woodhams and Zhang Chen models conform to the Second-Generation models [Figure 4b). For the Zhang Chen model, a non-linear increase of the effective tensile strength with wt% can be noticed. However, Kelly-Tyson and Leidner-Woodhams models keep a similar behavior of tensile strength to the one obtained for First Generation models, namely, a linear increase with wt%. It is important to mention that the results of the last two models are very close to each other.
Finally, Figure 4c shows the behavior of the Arithmetic Summation Method, Quadratic Summation Method, and Compounding Method or Third Generation models family. The results show that the three analytical models have a non-linear behavior, with the Arithmetic Summation Method and Quadratic Summation Method presenting asymptotic tendencies. These two models consider the influence of stretching mechanisms on the effective tensile strength of nanocomposite. On the other hand, the Compounding Method proposes an interaction between the stretching mechanism and the matrix yield strength, where the second one can cause the exponential increase of the effective tensile strength in nanocomposite materials.
Table 3 Required parameters for the analytical models used in the prediction of the effective tensile strength in nanocomposites
Note: ROM, S-L, H-T, K-T, L-W, Z-C, ASM, QSM, and CM are the Rule of Mixtures model, Shear Lag model, Halpin and Tsai model, Kelly-Tyson model, Zhang Chen model, Arithmetic Summation Method, Quadratic Summation Method and Compounding Method, respectively.
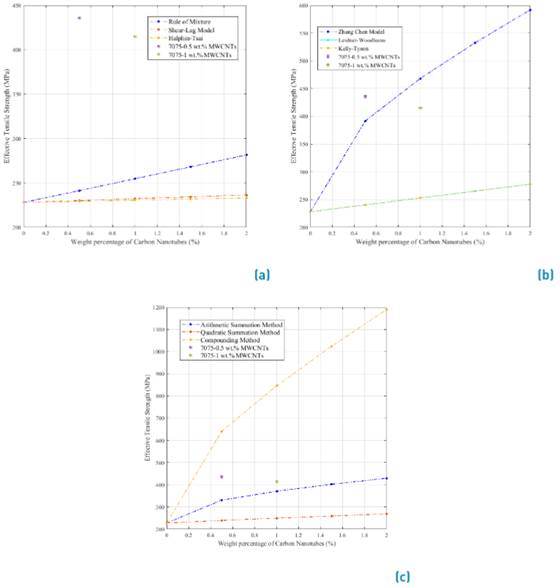
Figure 4 Analytical models results, a) First generation models, b) Second generation models, C) Third generation models
4. Conclusions
The proposed taxonomy demonstrated versatility for the classification, comparison, and selection of the main analytical models in the prediction of the effective tensile strength in nanocomposite materials. In addition, the identification of the input parameters, assumptions, and main physical phenomena allowed the development of a comparative assessment between the three families of analytical models. Similarly, the accuracy assessment through the experimental research determined a minimum relative error of 44.7%, 10.1%, and 10.6% for First-Generation, Second-Generation, and Third-Generation models, respectively. Furthermore, the analysis of robustness demonstrates the importance of the required parameters and their obtention for the characterization of the analytical models, also validating the influence of the experimental variables and adjustment variables in the evaluation of the model’s behavior.
Finally, it was observed that the number of input variables, their interactions, and their dependence cause linear and non-linear behaviors. However, the main difference in accuracy in the three generations of analytical models has been caused for the assumptions such as the homogeneous dispersion and idealization of the nano-reinforcement orientation parallel to the applied force. These considerations can be modified in future research.

