


 Inglés (pdf)
 Articulo en XML
 Referencias del artículo
 Enviar articulo por email
 Citado por SciELO
  Citado por Google
  Similares en
SciELO
Similares en
SciELO  Similares en Google
 Permalink
Introduction
Cocoa (Theobroma cacao L.) and its derivatives can be considered commodities with health benefits due to their high content of polyphenols and antioxidants (Oliveira et al., 2021). Nevertheless, cocoa has been identified as an important source of cadmium (Cd), which is a transition metal without biological function and of recognized toxicity in humans that affects the kidneys and calcium absorption in bones (Járup & Akesson, 2009; Satarug, 2018).
Cadmium is released naturally in soils through the weathering of rocks, where it is usually found in concentrations of less than 0.2 mg kg-1 (Gramlich et al., 2017). However, anthropogenic activities such as mining, agrochemical industry (fertilizers, pesticides), in addition to its considerable mobility in soil, significantly increase its content. Cadmium absorption by cocoa plants occurs through the roots and is conducted through its vascular system to finally reside in the leaves and fruits (Checa et al., 2019; Vanderschueren et al., 2020).
The raw material for the cocoa industry comes mainly from Africa, Central and South America. For the latter, numerous studies have shown that cocoa beans (nibs and shells) have relatively high concentrations of cadmium (Bertoldi et al., 2016; Argüello et al., 2019; Rodríguez Albarrcín et al., 2019; Bravo et al., 2021). In the Americas, Colombia has the potential as a bean exporter with increasing production. In the period 2020-2021, production reached 70205 t of dry beans, corresponding to its highest historical record (Fedecacao, 2021). Around 95% of exported beans were categorized as Fine Flavour Cocoa (FFC). FFC is a market category established by the International Cocoa Organization (ICCO) that recognizes sensory attributes such as flowery, fruity, caramelly, and nutty (Escobar et al., 2020; Escobar et al., 2021).
In general, atomic emission/absorption spectral techniques allow for the quantitative determination of Cd concentrations in cocoa beans, among them: inductively coupled plasma mass spectrometry (ICP-MS), inductively coupled plasma optical emission spectrometry (ICP-OES), graphite furnace atomic absorption spectrometry (GF-AAS), and flame atomic absorption spectrometry (FAAS). These methods for the assessment of Cd concentrations in cocoa are characterized by their robustness and limit of detection (LOD). In ICP-OES, for example, we found LODs near 0.043 mg kg-1 (Rodríguez et al., 2022). However, the large number of supplies, as well as the generation of environmentally aggressive waste, lead to a search for analysis strategies that minimize these factors. By contrast, laser-induced breakdown spectroscopy (LIBS) has become a useful technique for food analysis that is relatively simple and with a minimum production of polluting waste.
LIBS is suitable for the detection of cadmium in agricultural materials and food (Menegatti et al., 2019; Nicolodelli et al., 2019; Senesi et al., 2019). Chemometrics and LIBS have been proposed for the determination of Cd in fruits and vegetables (Yao et al., 2017; Shen et al., 2018). Zhao et al. (2019) determine Cd in lettuce leaves using enhanced LIBS by adding silver nanoparticles (NELIBS); the enhanced signal of the 214.4 nm line allows prediction of Cd concentrations less than 60 kg-1 (Zhao et al., 2019). Yang et al. (2019) proposes a simple and low-cost pre-treatment method for rice grain samples, called solid-liquid-solid transformation that improves the signal to noise ratio for Cd lines in LIBS spectra, obtaining detection limits near 2.8 ng kg-1. Very recently, univariate and multivariate calibration methods, such as partial least squares regression (PLSR), least squares support vector machines (LS-SVM), and extreme learning machines (ELM) in combination with LIBS were proposed for quantitative analysis of Cd in the rice roots (Wang et al., 2021).
Previous studies on the determination of Cd in cocoa beans using ICP-OES were developed by Chavez et al. (2015) and Oliveira et al. (2021). Gramlich et al. (2017) study cadmium uptake in soils and cocoa beans by FASS. Also, in Colombia, the organs of cocoa plants and soil are analysed by ICP-MS for the determination of heavy metals, with emphasis on Cd (Aguirre-Forero et al., 2020).
In this research, a predictive model was proposed to determine Cd concentration in cocoa beans of Colombian origin, based on LIBS, FAAS (as a reference technique) combined with PLSR-1 (partial least squares regression). This took advantage of the agility to generate LIBS spectra that together with the Cd concentrations determined by FAAS and the chemometric procedures allowed the construction of the model and a reduction in the time of analysis with respect to conventional spectral methodologies. If the procedure proposed in this study is compared with the FAAS technique, the time required to obtain LIBS data is estimated as 1 h (including SLST transformation). In contrast, FAAS requires digestion processes that typically take more than 48 h.
Materials and methods
Samples of cocoa beans of Colombian origin that were dried and ground were collected for one year from different laboratories. Prior to calibration, all samples were homogenized using a mortar.
Determination of cadmium concentration by FAAS: reference method
Sample treatment
Initially 65 samples of cocoa beans of Colombian origin were treated for analysis of the concentration of cadmium by FAAS. The cocoa beans were obtained from different plantations, but the precise geographic location is unknown.
Prior to microwave oven assisted digestion (MWAD), 0.5 g of cocoa beans was immersed in 8 ml of HNO3 (MERCK, 65%), for 48 h, using teflon vessels (adapted from Oliveira et al. (2021)). After this period, 2 ml of H2O2 (30%) was added. Samples were introduced into the microwave digestion system (Multiwave GO Anton Paar, GmbH), according to the following procedure: (a) starting from room temperature to reach 80°C in 5 min, remaining at that temperature for 5 min; (b) from 80°C to 150°C for 5 min and staying at that temperature for 5 min; (c) from 150°C to 180°C for 3 min and remaining at that temperature for 25 min. The teflon vessels were allowed to cool to room temperature and carefully opened. The digestion product was transferred to a 25 ml balloon and filled with HNO3 (0.5%). The washing of the glass and teflon material was carried according to AOAC Official (Jorhem & Engman, 2000).
Atomic absorption analysis
The standard solution was obtained by dissolving 1 g of Cd powder (Cadmium EMSURE* Merck KGaA, Darmstadt, Germany, particle size 0.3-1.6 mm) in 21 ml of HNO3, in a 1:1 ratio (v/v) and then filled to 1 L with deionised water. From this standard solution a calibration curve was constructed with six Cd concentrations: 0.02, 0.5, 1, 1.5, 2, and 3 mg kg-1.
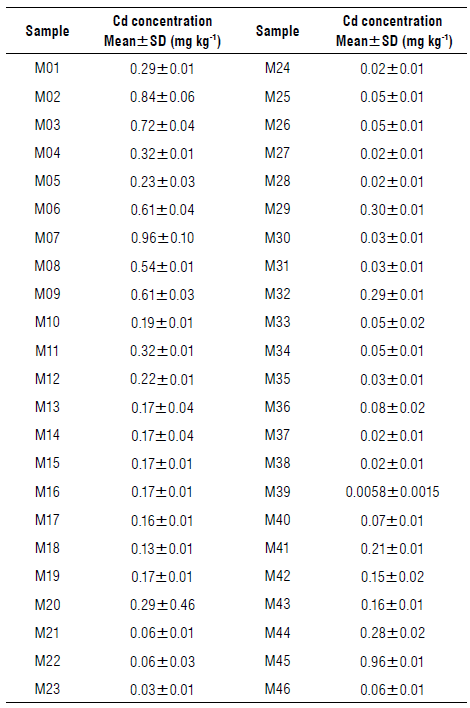
The analysis was performed on a FAAS spectrometer (Thermo Electron Corporation, USA). The wavelength of the radiation emitted by the Cd hollow cathode lamp was 228.8 nm (current 4 mA). The flame was an air/acetylene oxidising flame with a flow rate of 1.2 L min-1 and a flame height of 7 mm. Slit width was 0.5 mm. Each concentration was determined by triplicate and its average value (± standard deviation) is shown in Table 1.
Detection of cadmium in cocoa beans by LIBS
Determination of cadmium in pellets
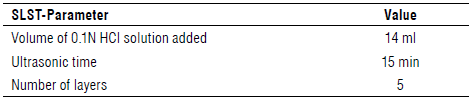
In LIBS, the most common process for the analysis of samples is the formation of pellets after its homogenization (Sezer et al., 2017; Yang et al., 2018; Senesi et al., 2019). Pellets were produced from 500 mg of cocoa beans, previously macerated, by applying 2 t cm-2 of pressure for 2 min using a hydraulic press (Carver Inc., USA). However, it was only possible to determine Cd in pellets previously contaminated with a high concentration (>15 mg kg-1) of this element. To detect Cd in samples with lower concentrations, it was necessary to implement the SLS transformation, proposed by Yang et al. (2019) that is described in the next section. SLST is a commonly used procedure for the quantification of heavy metals in food samples. In cocoa beans, Cd is bound in the chemical forms with other elements (among others: CdCl2, CdOH+, CdCl3 - and organic ones). At low concentrations of Cd, it is difficult to extract it by laser. For this reason, the addition of 0.1 N HCl allows the release of Cd+2 and the formation of soluble salts with the Cl- ion (Yang et al., 2019).
Solid-Liquid-Solid Transformation (SLST)
To 1 g of macerated cocoa beans, 14 ml of 0.1 N HCl solution was added. The solution was submitted to an ultrasonic bath for 15 min. From the supernatant, 200 were taken, deposited on a glass sample holder, and allowed to dry at a temperature of 70°C. In this way, a layer of the material was obtained; the process was repeated to a total of five layers (Yang et al., 2019).
The experimental parameters were as follow: added volume of 0.1 N HCl solution (10, 12, 14, and 16 ml), and the following ultrasonic bath times using a Branson ultrasonic cleaner 1510, Japan of 5, 10, 15, and 20 min were studied according to the criterion of maximising the area under the spectral curve of the (concatenated) array of the 214.44 nm and 226.50 nm emission lines of the LIBS spectra. Unlike the volume of solution added and the ultrasonic time, the number of layers did not exhibit a maximum (the area under emission line). On the contrary, from the second layer, it grew monotonically as the number of layers increased. Given that more layers mean longer sample preparation time, five layers resulted in a good compromise between sample preparation time and signal intensity.
The emission line of Cd 214.44 nm, Figure 1A-C depicted the behaviour of these experimental parameters. Similar characteristics followed for the Cd 226.50 nm emission line. Table 2 shows the experimental parameters used for the SLS transformation.
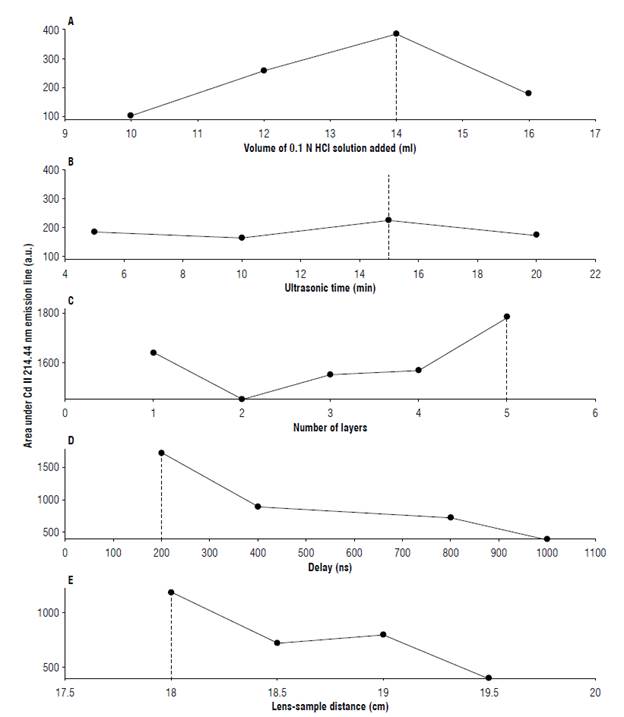
FIGURE 1 Exploration of experimental and instrumental parameters used in the solid-liquid-solid transformation (SLST) and LIBS setup: area under emission lines (214.44 nm) in arbitrary unit (a.u.) vs. (A) Volume of HCl 0.1 N solution added, (B) ultrasonic time, (C) number of layers, (D) delay, and (E) lens-sample distance.
Optimization of instrumental parameters for LIBS
LIBS spectra were recorded using a Q-switched Nd:Yag laser (Q-smart, Quantel, Inc., USA) operating at 1064 nm. Adopting the same optimization criterion as in the SLST, we proceeded to set the LIBS instrumental parameters, namely, the delay and lens-sample distance. For a five-layer sample, delays of 200, 400, 800, and 1000 ns were tested with a lens-sample distance of 19.5 cm and 100 shots. Keeping the delay and number of shots constant (200 ns and 100 shots, respectively), the lens-sample distance was varied in the range 18 cm to 19.5 cm. Finally, the number of laser shots on the sample was between 10 and 200, at delay (200 ns) and lens-sample distance (19.5 cm). To ensure that each laser impact covered a different region on the sample, the glass sample holder was supported on a turntable (with stepper motor). The selected parameters were as follow: a delay of 200 ns, integration time of 5 us, lens-sample distance of 18 cm and number of shots of 200, pulse duration 5 ns, a repetition rate 10 Hz. As the number of shots increased so did the area under the emission line; however, the sample size limited this number to 200. The laser energy was 150 ml/pulse. The behaviour of the area under the emission line 214.44 nm against the delay time and the sample lens distance is shown in Figure 1 D-E.
The plasma emission was focused through a quartz lens (focal length, 50 mm) and collected with a quartz optical fiber and introduced into a 0.5 m Czerny-Turner spectrograph (Shamrock 500i, Andor Technology, USA). A two thousand and four hundred grooves/mm diffraction grating (spectral resolution 0.075 nm, dispersion 0.83 nm mm4, and blazed 250 nm) was used to disperse the emission spectrum that was projected on the image plane of the spectrograph and recorded on an intensified charge-coupled device (ICCD) detector with an array of 1024 x 256 pixels (iStar DH720, Andor Technology, USA). The characteristics of the LIBS spectra acquisition setup are shown in Table 3.
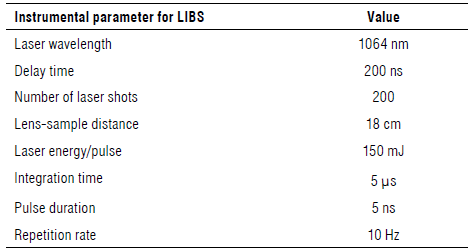
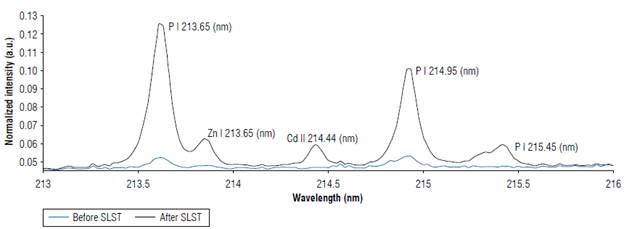
Figure 2 shows the LIBS signal of cocoa bean sample 21 (0.06±0.01 mg kg4) before and after SLS transformation. The increase of the signal in the Cd II emission line 214.44 nm is evident.
PLSR model development
PLSR-l is a well-known chemometric technique for the implementation of predictive models (Otto, 2007). It is characterized by its simplicity and the possibility of obtaining good performance without over-fitting. In developing a prediction model, a compromise must be maintained between the number of latent variables (predictors) and the degrees of freedom (ASTM E1655-05, 2012).
In a PLS-1 predictive model, the relationship between the predictors x, and the estimated response, y, is established according to Equation 1:
where y corresponds to an estimated concentration of Cd in cocoa beans; b is the vector of coefficients of the regression in the partial least squares sense (including the independent term); and x is a vector consisting of 33 intensity values (concatenated, with baseline correction and normalised by the area under the spectral curve) of the emission lines 214.44 nm and 226.50 nm. The concatenated array is formed by uniformly sampling over 17 and 16 points the intervals [214.3,214.7] and [226.4,226.7] (Fig. 3). Although in FAAS the 228.88 nm emission line is the reference for the measurements, it was not considered for the development of the predictive model due to interference with the iron emission lines.
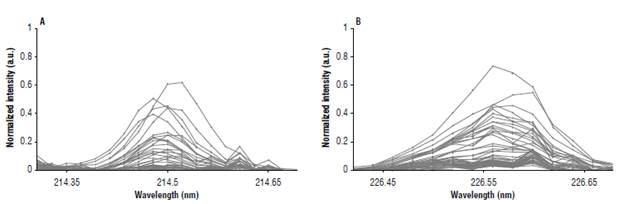
FIGURE 3 LIBS signal normalized by the area under the spectral curve of the Cd II 214.44 nm (A) and Cd II 226.50 nm (B) emission lines. Thirty-three (33) equally spaced points are concatenated to form an array that constitutes the input signal in the predictive model. Normalized intensity in arbitrary unit (a.u.).
The multivariate calibration was performed with Monte Carlo cross-validation (MCCV) to ascertain the complexity of the model, i.e., the number of latent variables (LVs) of the PLS model (Xu & Liang, 2001). This cross-validation strategy requires splitting the samples into two sets, one with n c samples for training (testing or calibration), and the other with n cv for validation. In all cases, the training set contained the samples with the highest and lowest Cd concentration values. Therefore, the regression model is only valid for interpolating values in that range.
The criteria used to define the number of LVs were the following: the square root of the standard error of calibration (SEC) and cross-validation (SECV), defined according to Equations 2 and 3:
where d
x
= n
x
-(k+l) (with x, c or cv for calibration or cross-validation samples, respectively) corresponds to the degrees of freedom, and k is the number of latent variables (LVs). In Equations 2 and 3, ŷi is the estimated value of Cd concentration corresponding to the i-th sample with a measured value ŷi. Another criterion used to determine the number of LVs was the correlation between two successive
Other figures of merit, which allowed us to evaluate the performance of the calibration model developed were as follows: the F-test with degrees of freedom, (fc-1) (numerator) and (n c -k) (denominator) given by Equation 4:
where
The range error ratio, RER, defined according to Equation 5, was calculated as follows:
with y MAX and y MIN being the maximum and minimum values of Cd concentration in cocoa beans (range for cross-validation sample set), respectively, determined by FAAS.
The confidence limit at a level of 95% for the performance of the model was calculated as ŷ¡ ± t.SEC.√(2 + h i¡ ), where t is the student's t value for d c degrees of freedom. For each training sample, with an estimated value ŷ¡, h¡¡, is a scalar taken in order from the main diagonal of the matrix T x T', where scores T are the coordinates of the sample in the principal components space (ASTM E1655-05, 2012). Finally, as usual, the coefficients of determination for both the set of calibration, R 2 C and cross-validation R 2 CV are reported.
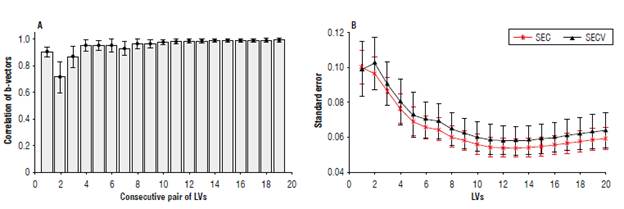
FIGURE 4 Criteria for selecting the dimension (number of latent variables, LVs) of the calibration model. A) corresponds to the correlation of two consecutive
Results and discussion
The limit of detection (LOD) for FAAS analysis resulted in 0.056 mg kg4. This figure of merit was calculated according to the expression: LOD=C Uank +3 σ, where C blank corresponds to an average concentration of ten blanks with σ =0.0019 mg kg4 (standard deviation). Except for the addition of cocoa, the blanks were subjected to the treatment previously described in the sample treatment section. A recovery percentage of 98% was obtained, which means that the sample treatment process and the analytical measurement is acceptable. From the initial set of 65 samples, those whose FAAS analysis resulted in a negative concentration were discarded (negative value means, in this case, Cd concentration below of limit of detection). In addition, due to the small number of samples with concentrations above 1 mg kg4, the predictive model was limited to this value, taking 46 samples for its development.
The concentration of Cd in cocoa beans using LIBS and FAAS was carried out by applying PLS-1 implemented on Matlab R2019b (MathWorks, Inc.) using the statistically inspired modification of the partial least-square (SIMPLS) algorithm (De Jong, 1993; Otto, 2007; Faber & Ferré, 2008). A total of 1000 partitions generated the same number of models for each of the first 20 LVs. Each partition consisted of 60% of the samples for training (28 samples) and the remaining 40% for validation (18 samples). Usually, the number of LVs in the model is selected according to a minimum in SECV (Fig. 4B) that is suggested in this case to be between 12 and 13 LVs.
To respect the degrees of freedom of the calibration mode, this quantity of LVs requires a larger number of samples than those available. For this reason, we use the criterion given by the correlation of two consecutive
A moderately optimistic model could be proposed by selecting a partition with SECV greater than (or equal to) SEC, and with the smallest distance to the line of identity in the SECV-SEC plane (Fig. 5). It is an empirical fact that when SECV and SEC are calculated for different partitions, using
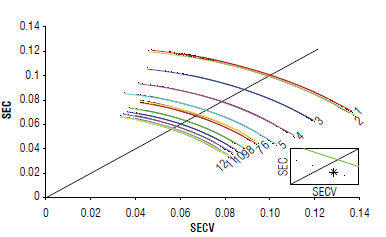
FIGURE 5 In the standard error of cross-validation (SECV)-standard error of calibration (SEC) plane, averages over 1000 partitions are placed on arc segments. For the number of latent variables defined, a partition is selected that satisfies the condition SECV is greater than or equal to SEC. With this partition, the performance metrics for the predictive model are estimated.
For the selected partition, in the eighth LV, the SEC has a value of 0.05±0.0066 mg kg4 with the SECV 0.12±0.0092 mg kg4. Similarly, the coefficient of determination for calibration and cross-validation samples, R 2 C and R 2 CV are 0.97±0.0093 and 0.79±0.0042.
The F Cal (calculated F) was 99.23, which must be compared with the F Tab (0.95,7,20), (tabulated F, with a confidence margin of 95%, N c =28 and k=8). Since F Cal > F Tab =3.0l, we can argue that the model appropriately fits the data. On the other hand, the selected partition has a RER of 7.92± 2.92, therefore the proposed model can be considered for screening. The performance metrics for the proposed model are summarised in Table 4.
TABLE 4 Parameters describing the performance of the proposed calibration model.
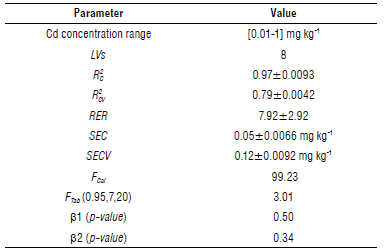
LVs, latent variables; R 2 c and R 2 CV fijare the coefficient of determination for calibration and cross-validation; range error ratio (RER); SEC, standard error of calibration; SECV, standard error of cross-validation; FCa/ and Ftab are the F-test statistic values, calculated and tabulated, respectively; p-values for linear (β 1) and quadratic (β2) coefficient distributions.
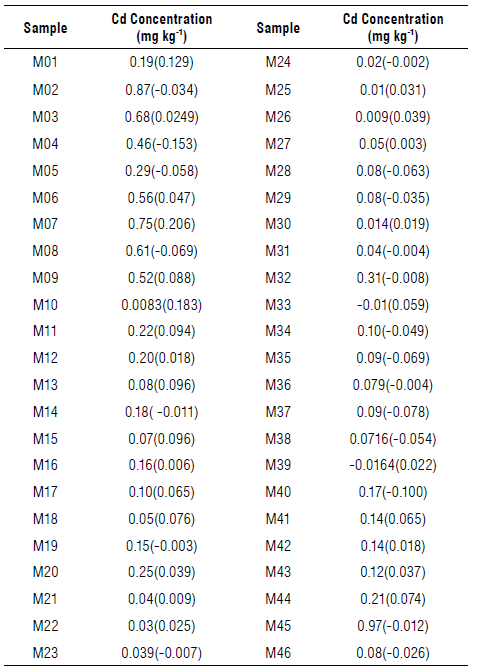
Figure 6 depicts the performance of the proposed calibration model. Note that a small fraction of the samples falls outside the 95% confidence bands (dashed lines). For more details, this information (including residuals, written in brackets) is shown in Table 5. The correlation shows that the model responds to the performance indicators explained in the previous paragraph, following the procedure suggested for the evaluation of trends in residuals of multivariate calibration models by permutation test (Filgueiras et al, 2014). A total of 50.000 permutations allows us to obtain distributions of the linear (β1) and quadratic (β2) coefficients, with p-values ((β1=0.50 and (β2=0.34) greater than 0.05, indicating the absence of linear and quadratic trends, or equivalently, a random behaviour of the residuals with respect to the reference values. Finally, Figure 7 shows the histogram of the residuals for both calibration and cross-validation samples, note that the peak is close to zero.
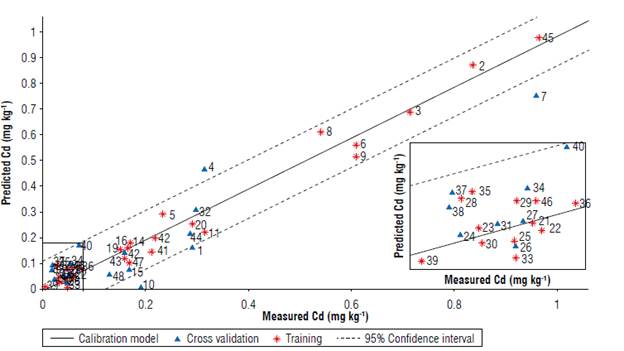
FIGURE 6 Correlation of measured values of Cd concentrations and values predicted by the PLSR-1 model. Dashed lines constitute the 95% confidence band. Samples with measured concentrations close to 0.1 mg kg-1 are presented in the box.
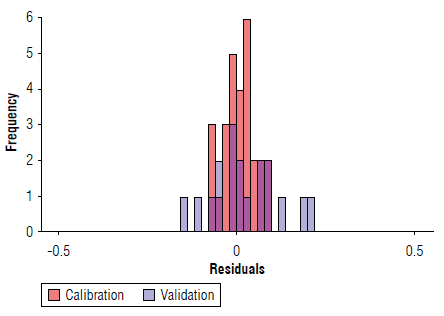
FIGURE 7 Histogram of the residuals for the selected partition. The maximum of the distribution is close to zero.
Conclusions
In this research, a PLS-1 predictive model was developed to determine the concentration of Cd in cocoa beans from a LIBS spectra. The performance metrics (RER) allow classifying the model as suitable for screening, mainly in the range of 0.2 to 1 mg kg-1. The Monte Carlo cross-validation strategy allowed the selection of a sample partition that yielded a model with adequate correlation, a linear behaviour, which was evident from the diagnostic figures of merit (R2, residuals and standard errors) and inference tests (F-test). Moreover, it was possible to implement the SLS transformation for the analysis of cocoa beans using LIBS, which significantly improved the signal-to-noise ratio of the spectrum allowing the development of this predictive model with relative experimental simplicity and few chemical reagents, reducing the time compared to other methodologies. The enhancement factor in the predicted concentrations, before and after SLS transformation, was estimated to be around two orders.

