


 Inglés (pdf)
 Articulo en XML
 Referencias del artículo
 Enviar articulo por email
 Citado por SciELO
  Citado por Google
  Similares en
SciELO
Similares en
SciELO  Similares en Google
 Permalink
Introduction
Methane (CH4) and nitrous oxide (N2O) are the most important greenhouse gases (GHG), exceeding the 100-year global warming potential of carbon dioxide (CO2) by factors of 28 and 265, respectively (Myhre et al., 2013). Flooded rice soils represent an important source of global CH4 emissions (Shang et al., 2011). Moreover, it is increasingly recognized that rice-based cropping systems can emit substantial amounts of N2O (Zou et al., 2009; Wang et al., 2011), although with a smaller contribution in terms of global warming potential (Linquist et al., 2012).
In Brazil, more than 80% of the rice production comes from wetland areas, where the basic cultivation system is irrigation by flooding (Marrenjo et al., 2016). The anaerobic soil conditions in this type of management lead to CH4 generation as the final product of the organic matter decomposition by methanogenic microorganisms (Dalal et al., 2008). Nitrous oxide, on the other hand, results from denitrification, the primary cause being the higher soil moisture content (Tan et al., 2018). However, the emission of N2O from flooded rice may be lower than in other types of ecosystems since under prolonged soil flooding conditions the N2O may be reduced to a great extent to N2 (Zou et al., 2007).
Most of the studies assessing GHG emission rates in flooded rice systems are still based on manual chamber measurements, usually limited by low sampling frequencies, with only one or two measurements per day or week (Sander & Wassmann, 2014). However, previous studies have shown that, in flooded ecosystems, CH4 fluxes fluctuate regularly at diurnal timescales (Ma et al., 2021). This may lead to overestimated or underestimated quantifications of the CH4 and N2O fluxes, depending on the time of day and stages of rice growth when the measurements are made. Therefore, knowledge of the diurnal patterns is very important to adequately determine the average gas emission values and to limit uncertainties concerning flux estimates on seasonal scales.
Experiments aiming to evaluate the diurnal variations in CH4 and N2O fluxes have been already carried out during different rice crop growth stages, but there were some inconsistencies regarding the time that best represented the average flux. According to Brye et al. (2017), the optimum time to determine mean CH4 emissions is generally around late morning to mid-day. Weller et al. (2015) found that the best times to determine the mean diurnal CH4 emissions were from 7:00-9:00 a.m. or 5:00-7:00 p.m. These authors also showed that the diurnal CH4 emissions were affected by air, floodwater and soil temperatures. The importance of temperature in CH4 and N2O emissions has already been demonstrated by other authors (Das & Adya, 2012; Gaihre et al., 2016). Diurnal variations in N2O emissions have also been found and may also differ according to the rice growth stages (Wang et al., 2017).
Data on the diurnal variation of greenhouse gases in rice production systems are scarce in Brazil and mostly related to CH4 fluxes and to specific varieties (Costa et al., 2008; Lima et al., 2018). However, due to the variation that these results may have as a function of the climatic, soil type and handling conditions (Gaihre et al., 2014; Dai et al., 2019), more experiments should be carried out in different rice ecosystems to better interpret possible differences in emission patterns.
The CH4 and N2O fluxes in flooded rice fields were measured to identify diurnal patterns and to develop guidelines for timing flux measurements. In the Southeast region of Brazil, the rice crop is generally cultivated in one season, followed by a fallow period with no other commercial cultivation. The importance of measuring gas emissions in this period has been recognized by many authors (Weller et al., 2016; Maboni et al., 2021). Considering the rice cultivation and associated fallow period as a farming system, the objective of this study was to verify the diurnal CH4 and N2O flux variations during three stages of the rice development and during the post-harvest and fallow periods, to identify the average flux times. Also, the influence of the air, soil and water temperatures on CH4 and N2O emissions was investigated.
Materials and methods
Experimental site and field design
The study was carried out in 2018 in a rice paddy field in Pindamonhangaba, São Paulo State, Brazil (22o55' S, 45o30' W). The climate is of the Cwa type, according to the Köppen classification, with an average highest temperature above 22oC and an average lowest temperature below 18oC. The study area has been used for flooded rice cultivation for decades. The soil is classified as Haplic Gleysol (Embrapa, 2013), with 39.4 ± 2.5% of sand, 24.9 ± 2.4% of silt, and 35.6 ± 0.3% of clay, bulk density = 1.3 ± 0.3 g cm-3, total porosity = 38.0 ± 1.6%, total carbon = 12.9 ± 0.8 g kg-1, and total nitrogen = 1.4 ± 0.1 g kg-1.
The experiment was carried out using continuous water management and the IAC-400 rice variety (average cycle = 115 d). The straw had been incorporated into the soil after the previous harvest. On January 12th, 2018, the area was flooded and drained 4 d later and maintained under this condition until sowing was carried out on January 25th, 2018. Eight lines were used, each 10.4 m long, with spacing of 0.2 m x 0.3 m. Emergence occurred on January 31st, 2018. When the plants reached approximately 8 cm in height, a water blade of 6 cm was established. Due to problems of unequal plant growth, more seedlings were transplanted on February 19th, 2018. The field was then flooded to an average water blade of 15 cm. The area was sprayed with the herbicides Basagran (500 ml ha-1), Ally (0.66 ml ha-1) and Ricer (40 ml ha-1) on February 23rd, 2018, and with Nominee (30 ml ha-1), Ricor (20 ml), Basagran (30 ml ha-1), and oil (20 ml ha-1) on March 23rd, 2018.
Fertilization was carried out twice, on March 5th and March 21st, 2018. On the first occasion (13 d after the V4 stage), 250 kg of NPK ha-1 were applied using the NPK formulation 10-10-10 and on the second occasion (one day before the panicle differentiation) the same amount of NPK ha-1 was applied using the formulation 20-05-20. Urea, simple superphosphate, and potassium chloride were used as sources of N, P, and K, respectively. Flowering occurred on April 17th, 2018 (77 d after emergence) and maturation occurred on May 23rd, 2018. Drainage was carried out on May 4th, 2018, and harvest was carried out on June 4th, 2018.
Measurement of the CH4 and N2O fluxes
The static closed chamber method was used for gas collection and flux calculation as described by Lima et al. (2018). Four chambers were positioned following a transect in an area of 88.8 m2 containing the transplanted rice. Each measurement period (total of five) was considered as a 24 h-campaign. Gas sampling was carried out every 2 h at 0, 10, 20, and 30 min intervals, starting at 9:00 a.m. and ending at the same time on the next day, except for the C3, which started at 11:00 a.m. and ended at this same time on the next day, due to operational issues. The gas samples were analyzed using a Thermo Scientific chromatograph model Trace 1310, equipped with an automatic injector TriPlus RSH, and FID and ECD detectors.
Methane and nitrous oxide fluxes were calculated from the linear increase in gas concentration inside the chamber during the gas sampling, using the equation:
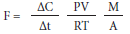
where F represents the flow of CH4 (μmol m-2 h-1) and N2O (μmol m-2 h-1), P is the mean atmospheric pressure in the chamber (assumed to be 1 atm), M is the gas molecular mass (CH4 = 16.04 g mol-1, N2O = 44.013 g mol-1), A is the chamber basal area (m2); R is the universal gas constant (8.31441 J mol-1 K-1), T is the temperature inside the chamber during degrees Kelvin sampling (K), V is the chamber volume (L), and ΔC/Δt is the change in gas concentration (ΔC) during the sampling time (At) (mg L-1min-1). The CH4 and N2O emission rate was converted to mg of CH4 m-2 h-1 and μg of N2O m-2 h-1.
The 24 h gas sampling campaigns were carried out for the stages R2, R5, R8, and for the post-harvest and fallow (Tab. 1), defined in this study as C1, C2, C3, C4, and C5, respectively.
Environmental variables
The hourly data for the minimum and maximum temperatures (Tmax and Tmin) were obtained from an automatic weather station located about 6 km away. While sampling the gases, the air temperature (Tair) inside the chamber was measured and applied in the calculation of the gas fluxes. The maximum and minimum temperatures of the floodwater (Tfw) and of the soil (Ts) at a depth of 5 cm were also registered.
Statistical analysis
Measurements of the CH4 and N2O emissions were carried out using four chambers installed in the rice cultivation area, each of them considered a repetition. The mean standard error for the gas emissions was estimated for each sampling time for the five 24 h-campaigns using the PROC CORR procedure of the SAS program (SAS, 2011). Correlations between the CH4 and N2O fluxes and environmental parameters were estimated using the Pearson's correlation method (P<0.05).
Results and discussion
The results related to the temperatures measured during each campaign are shown in Table 2. It did not rain during the measurement days (Fig. 1).
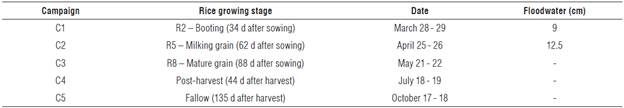
TABLE 2 Maximum (Tmax) and minimum (Tmin) air temperatures, maximum (Tfw max) and minimum (Тfw min) floodwater temperatures and maximum (Ts max) and minimum (Ts min) soil temperatures at 5 cm depth, during each campaign.
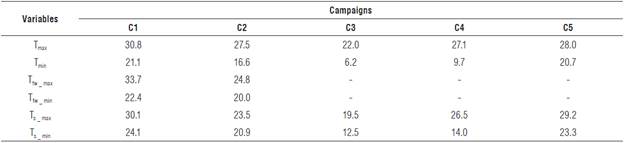
C1= R2 stage; C2= R5 stage; C3= R8 stage; C4= post-harvest (PH); C5= fallow period (FP).
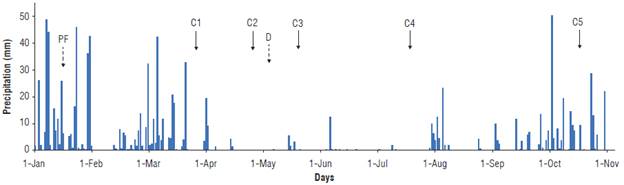
FIGURE 1 Distribution of precipitation throughout the experimental period. The solid arrows represent the campaign dates. Dotted arrows: PF = preliminary flooding, D = final drainage.
The methane fluxes during the CI campaign were stable and near the average flux value (9.4 ± 1.0 mg CH4m-2h-1) (Fig. 2), except at 5:00 p.m. when a peak was observed with a value of 13.4 mg CH4 m-2 h-1 This late peak occurred within the range of time reported by Lima et al. (2018), between 2:00 p.m. and 5:00 p.m. These results also corroborate those obtained by Ma et al. (2021) where the CH4 fluxes reached a peak at 2:00 - 4:00 p.m. during the reproductive stage. No significant correlations were observed between the CH4 fluxes and Tmax, Tmin, Ts and Tfw. These results are contrary to those obtained by other authors (Wassmann et al., 2018; Dai et al., 2019) and could indicate that other factors not evaluated in this study could be affecting the CH4 emissions.
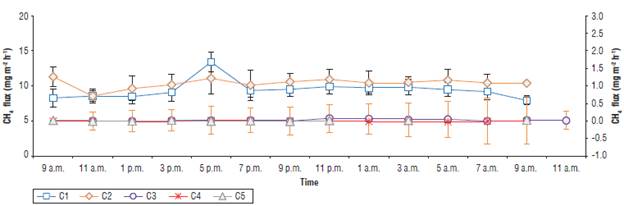
FIGURE 2 Diurnal CH4 emission rates in the five 24-h campaigns. Bars indicate the standard deviation of the mean. The left Y axis presents the scale of the values for C1 and C2, while the right Y axis presents the scale of the values for C3, C4, and C5. C1 =R2 stage; C2=R5 stage; C3=R8 stage; C4=post-harvest (PH); C5=fallow period (FP).
During the C2 campaign the CH4 fluxes remained near the average value of 10.2 ± 1.4 mg CH4m~2h_1 (Fig. 2) with no clear diurnal pattern. Similarly, Wassmann et al. (2018) showed that during wet seasons, the CH4 fluxes of the reproductive and ripening stages remained within a stable range and no diurnal patterns were observed. According to Gaihre et al. (2014), the lack of a distinct diel variation may be due to a smaller change in soil temperature, which at C2 was within the range of 20.9°C and 23.5°C (Tab. 2). In this campaign, as in CI, no correlations were obtained between the CH4 fluxes and the Tmax, Tmin, Ts and Tfw values.
During the C3 campaign the CH4 emission rates were very low, although in this campaign the soil was still soaked (Fig. 2). The low temperatures may also have affected the microbiological activity and consequently the CH4 emissions during the C3 campaign, since temperature is a major factor regulating that activity (Schütz et al., 1990). In addition, on reaching plant maturity, the CH4 transport capacity decreases due to a probable collapse of the aerenchyma lacunae and resultant blockage of the aerenchyma channels (Aulakh et al., 2000). Furthermore, the carbon supply from plant photosynthates is also reduced at the end of the growing season (Martinez-Eixarch et al., 2018).
In the C4 and C5 campaigns, the CH4 emissions were also low in all sampling times. Likewise, Maboni et al. (2021) reported low CH4 fluxes, with values around zero, during the fallow period. During the C3, C4, and C5 campaigns, the CH4 fluxes were not only very low but also stable throughout the 24 h period. In this case, the time of sampling would be irrelevant.
The N20 fluxes were very low during the CI campaign (Fig. 3), with an average estimated diurnal emission of 1.0 ± 5.7 μg N20 m-2h-1. In general, N20 emissions are negligible in continuously flooded rice. Once an anaerobic condition is installed in the soil, most of the N20 produced in the soil is reduced to N2 (Hou et al., 2000; Liang et al., 2013) and the diffusion of N20 is hindered by the water layer (Hua et al., 1997). Higher fluxes were observed during the C2 campaign, with an average of 26.9 ± 9.3 μg N20 m~2h_1, and values close to this mean were observed at 5 p.m. and from 9 p.m. to 7 a.m. The N20 fluxes were positively correlated with Tmax and Tmin and with the Tfw during the CI and C2 campaigns, but not with Ts (Tab. 3). A positive correlation between the N20 fluxes and the water temperature was also obtained by Denmead et al. (1979).
During the C3 campaign the N20 fluxes varied from a maximum of 33.5 ± 6.9 μg N20 rn2 h-1 registered at 9:00 a.m. to a minimum of 9.4 ± 2.1 ugN20 m-2 h-1 at 11:00 a.m. The mean flux, estimated as 21.2 ± 7.2 μg N20 m~2h_1, was observed at 7:00 a.m., 1:00 p.m. and 9:00 p.m. A similar result to this diurnal pattern was reported by Wang et al. (2017), who found maximum emission between 9:00 a.m. and 12:00 a.m. during the maturation stage. In this campaign (C3), the mean maximum and minimum temperatures were the lowest registered amongst all the campaigns (14.2°C and 12.ГС, respectively), as well as the soil temperature (mean of 16.3°C), which could have affected the activity of the denitrifying microorganisms, although no correlations were found between the N20 emissions and temperature (Tab. 3). The soaked condition of the soil could have compensated the low temperature effect, creating favorable conditions for the occurrence of the fluxes registered. Future studies should test this hypothesis.
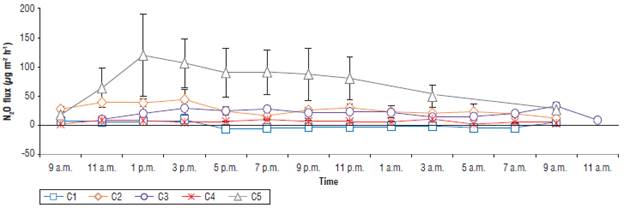
FIGURE 3 Diurnal N20 emission rates at three stages of rice development, at post-harvest and at the fallow period. Bars indicate the standard deviation of the mean. C1 = R2 stage; C2=R5 stage; C3=R8 stage; C4=post-harvest (PH); C5=fallow period (FP).
TABLE 3 Pearson's correlation coefficients (л) between the N20 fluxes and the maximum and minimum air temperatures (Tmax, Tmin), floodwater temperature (Tfw), and soil temperature (Ts).
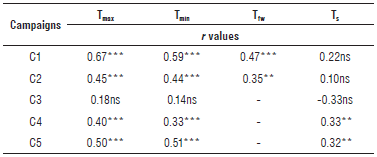
C1 = R2 stage; C2=R5 stage; C3=R8 stage; C4=post-harvest; C5=fallow period. *** P-value ≤ 0.01, "P-value ≤ 0.05, *P-value ≤ 0.10, ns - not significant.
During the C4 campaign, the N2O fluxes were very low, possibly due to the low temperatures and dry soil conditions (Fig. 1). Positive, although low, correlations were obtained between the N2O fluxes and Tmax Tmin and Ts, (Tab. 3). There was also a probable reduction in the available forms of nitrogen in the soil after harvest, affecting microbial activity. The average flux rate was estimated at 6.7 ± 2.61 μg N2O m-2 h-1, with values close to this occurring at 5:00 p.m. (7.2 μg N2O m-2 h-1), at 9:00 p.m. (7.1 μg N2O m-2 h-1), 11:00 p.m. (6.8 μg N2O m-2 h-1), 1:00 a.m. (6.5 μg N2O m-2 h-1) and 3:00 a.m. (6.6 μg N2O m-2 h-1) (Fig. 3).
During the C5 campaign, the average N2O flux increased to 73.7 ± 33.3 μg N2O m-2 h-1 with the values closest to this being obtained at 11:00 a.m. and at 11:00 p.m. The maximum flux was observed at 1:00 p.m. (119.9 μg N2O m-2 h-1) and the minimum at 9:00 a.m. This increase in the N2O fluxes was probably due to an increment in organic residues, possibly originating from the decomposition of rice straw, from the humid soil conditions after abundant rain in the previous days and from higher air temperatures, as confirmed by the significant positive correlation between the N2O fluxes and the mean maximum and minimum air temperatures (Tab. 3). The presence of C sources associated with high soil moisture is a condition that favors the activity of denitrifying microorganisms and, consequently, N2O emissions (Pérez et al., 2010). Kajiura et al. (2018) showed that N2O emissions during fallow periods (7-9 months) could be around 5-fold higher than those occurring during growing seasons.
Conclusions
Considering the average flux values recorded in this study, the sampling of CH4 under the specific conditions of the study area and at the observed stages would be possible at any time of the day, except at 5:00 pm, during the C1 campaign. The most appropriate times for sampling the N2O fluxes at the R2, R5 and R8 stages and PH would be from 9:00 p.m. to 1:00 a.m. and around 11:00 a.m. For the fallow period the most appropriate time would be at 11:00 p.m. and at 11:00 a.m. Stages R2 (C1) and R5 (C2) emitted more CH4, while higher N2O emissions were found in the fallow period (FP) (C5), with median flows at the R5 (C2) and R8 (C3) stages and lower flows at the R2 stage (C1) and at post-harvest (C4).
The results showed the importance of determining the best time for sampling gases, in order to avoid underestimates and overestimates of the mean fluxes. This trial should be repeated including other stages of plant growth to better characterize the diurnal CH4 and N2O flux patterns throughout the growing season. It must be emphasized that these results are specific for the area studied and could be influenced by the type of soil, field management, climate, rice cultivar, and environmental conditions.

