


 English (pdf)
 Article in xml format
 Article references
 Send this article by e-mail
 Cited by SciELO
  Cited by Google
  Similars in
SciELO
Similars in
SciELO  Similars in Google
 Permalink
I. Introduction
Recently, different methods of pattern recognition have been used to estimate the activity of biological molecules. For instance, Quantitative Structure-Activity Relationship (QSAR) methodologies are widely used to predict the activity of synthetic and natural antimicrobial peptides. QSAR correlates the physicochemical properties (descriptors) computed from sequence or peptide structure with the peptide biological activity using a mathematical function [1]. Datasets used in the field are characterized by the high dimensionality in the descriptors, and their small sample size.
Some of the methods that have been used to predict antimicrobial peptides include Partial Least Squares [2,3], Artificial Neural Networks [4], Multiple Linear Regression [5,6], and Support Vector Regression (SVR) [7-9], among others. Performance assessment of these methods is typically limited to few metrics obtained with fixed validation sets, measuring the distance of prediction from the real output, but providing little evidence on whether the used methods have found a real correlation. Traditionally used metrics include the root mean square error (RMSEext), the correlation coefficient of multiple determination (R2ext), the Pearson correlation coefficient (Rext), and R2 pred. (R2 predictive) for the fixed validation set [10]. The convention Xext, as used in related literature, indicates that metric X was used with the validation set (or external validation set).
Metrics to measure the performance of the training set are not always the same as the ones used for validation, and include RMSE, R, R2, Cross-validated correlation coefficient (Leave One Out, ), and y-randomization [10]. This, along with the great variability of the performance results both reported in the literature and observed experimentally by ourselves, lead us to believe that it is necessary to obtain a more comprehensive understanding of the machine learning methods behavior when applied in the field, as a necessary step before targeting good performance. In order to acquire this understanding, we propose a methodology that integrates feature learning and selection methods by using performance metrics, providing us with stronger foundations to support our decisions and investments with the lab resources at hand. The proposed methodology includes stacked autoencoders, genetic algorithms, learning curves, permutation tests, and bootstrapping. Using this methodology, we obtained predictors with good generalization capability, stable correlations between descriptors and activity, and competitive performance with respect to literature.
This paper is structured as follows. Section 2 presents a brief description of previous work. Section 3 describes the used datasets, and provides a general overview of the workflow. Section 4 explains the devised experiment. Section 5 describes the obtained results, and provides some insights into their interpretation. Finally, the last section draws the conclusions.
II. Blackground
Different algorithms and descriptors have been traditionally used to predict the activity of antimicrobial peptides. For example, Zhou et al. [7] used approximately 1500 descriptors, which were reduced to 711 after preprocessing, together with Genetic Algorithms (GA), Particle Swarm Optimization (PSO), and Support Vector Regression (SVR). However, they only used two metrics (R and RMSE) in the model assessing phase, and according to the literature, it is convenient to use additional metrics such as R2 and R2pred [10].
In another study, Borkar et al. [2] used Genetic Function Approximation and Partial Least Square with 43 descriptors; however, the true performance is not clear because the results of the reported metrics are based on the activity prediction in a logarithmic scale. In another study, Wang et al. [5] showed good results with the training set; however, with the test set the performance is low. Torrent et al. [4] created a model with 8 descriptors, and reported only R2 for the validation set, which does not guarantee the good behavior of the model [11]. An important aspect in some of these studies is that the training and test sets are explicit, that is, a single data split is made, and every case indicates which data are used for each split, which clearly bias the results. Consequently, our work takes a resampling approach, where data are split several times to ensure the statistical robustness of the results.
III. Materials and methods
This section describes the procedure by which we created our datasets for experimentation, and describes the novel methods we apply: Stacked Autoencoders for automatic learning of new representations for peptides, Learning Curves for assessing the generalization capabilities of our models, and Permutation Tests to assess their statistical significance. Since Support Vector Machines and Genetic Algorithms are more commonly used in the field, we refer the reader to [8,12] for further information.
A. Dataset and descriptors
The dataset used is this study is CAMELs, which has 101 sequences of peptides, each one composed of 15 amino acids, and whose antimicrobial activity has been reported as the mean antibiotic potency [13]. From the peptides primary structure, it is possible to compute a wide range of descriptors. Therefore, we started off from the properties described by Zhou et al. [7], who used the web tool PROFEAT [14] to compute ten groups of properties (Table 1); however, due to PROFEAT technical problems, we used instead a Python library called propy [15].
Table 1 Ten groups of descriptors extracted from the dataset. Columns ΄Initial΄ and ΄Final΄ represent the number of descriptors before and after the preprocessing, respectively [9]
Additionally, since the order of amino acids plays an important role in the peptides function [16], we computed the Composition Moment Vector descriptor (CMV) [17] that measure the order and frequency of amino acids in the sequence. In total, we considered 11 descriptor groups.
B. Stacked Autoencoders (SAE)
According to Camacho et al. [9], a stacked autoencoder is a "neural network with two or more layers of autoencoders that are used in an unsupervised manner. The main idea with SAE is to capture high order features from the data. Training is conducted using the approach called greedy-wise, i.e. each hidden layer is trained separately and the output of each one is used as input for the next layer [18]. If training succeeds to reconstruct the input data at the output layer, the hidden layer will contain a new representation of the input data which will be more compact if the hidden layer has less neurons than the input layer, or more sparse if it has more neurons."
In the case of an autoencoder with two hidden layers, we first trained an autoencoder with only the first layer [19] (Fig. 1a). Then, we kept the obtained weights, add the second layer, and performed another training process in this setup (Fig. 1b). This can be seen, first as obtaining an intermediate representation by training only the first layer, and then, feeding it to the second layer to obtain a final representation.
Fig. 1 Stacked autoencoder with 2 hidden layer. a) contains 6 input neurons and four neurons in the hidden layer. Note this is a compressing autoencoder. It contains (6+1)*4+(4+1)*6 = 58 connections [18].
C. Learning Curves (LC)
A learning curve is a graphical representation of the performance of a machine learning method trained with increasing data. For a given metric, performance is measured in the train and test part of a dataset, increasing the size of the dataset split from, typically, 10 % to 90 % in steps of 10 % (e.g., 10 % is used for training, and 90 % for testing, then, 20 % for training and 80 % for testing, until 90 % is used for training and 10 % for testing). This process is conducted n times by sampling with replacement, and then the average and standard deviation are calculated for that particular train/test split percentage [20]. Learning curves allow us to assess the generalization capabilities of the method in hand, identifying scenarios such as high variance (overfitting) or high bias (under fitting) [19], and supporting our decisions to improve the performance of our experiments (acquire more data, reduce or augment the complexity of our algorithm, etc.) (Fig. 2).
Fig. 2 Three typical learning curves for accuracy metric. The dotted line represents the accuracy in the validation part of the data, the solid line on the training part. The size of the training data increases in each curve as in the right direction. a) shows a typical case of overfitting (adding data does not help increasing validation performance). b) shows a typical case of high bias (the model cannot perform well even with training data). c) shows a good performing model, were both training and validation performances finally converge to high values as data is added.
D. Permutation Test (PT)
The permutation test is a procedure to evaluate the reliability of a performance metric using a notion of statistical significance; in other words, it measures the probability that the observed metric is a result of chance. A significant predictor should reject the null hypothesis that the data and labels are independent [22] through a small p-value. This procedure takes the original data, randomly permutes the labels, trains the predictor, and computes the metric. The process is repeated k times, and thus, a distribution of the metric values is obtained. The p-value is computed according to definition 1 in [23]:
where  is the data with their respective labels, ( is the function learned by the predictor algorithm,
  is the set of all possible original dataset permutations, e((, D') is the error of the predictor with permuted labels, and e((, D) is the error with original data.
E. Processing workflow
The processing workflow was composed of five stages:
a) Preprocessing: all descriptors are preprocessed by standardizing their values, and removing entries with the same value for all peptides (standard deviation of zero).
b) Unsupervised Feature Learning: to create the new representation of the data, preprocessed descriptors with different configurations of autoencoders (AE) and stacked autoencoders (SAE) are trained and run [19].
c) Feature selection: genetic algorithms to select the most useful descriptors are used.
d) Supervised prediction: different configurations of a Support Vector Regression (SVR) task are run on the descriptors to effectively predict antimicrobial activity of the initial peptides.
e) Assessing the performance: the performance of the models with different metrics using learning curves and permutation tests are verified.
IV. Experimental setup
A. Experimental configurations
Starting off from the 11 groups of descriptors for each peptide obtained with propy and CMV, we designed five general experimental setups, and run each descriptor group through each setup after following the workflow described above [9]. Below, we describe the five setups.
Original: to obtain a baseline against which to measure the behavior of further setups, we performed a Support Vector Regression directly on each group of physicochemical properties without further processing or feature learning (Fig. 3).
Fig. 3 Graphical representation of the methodology used in this work. The Train/test and Validation set were taken from Zhou et al. [7]. CMV: Composition Moment Vector. Dqso: Quasi sequence order. LC: learning curve. PT:permutation test.
GA: We optimized each group of descriptors using Genetic Algorithms (GA) (Fig. 3). In GA, a chromosome is a representation of the solution of a problem (different chromosomes or possible solutions may be generated); in this case, each chromosome is formed by a binary vector with one bit per feature, where 1 represents the selected feature, and 0 the nonselected. Then, a fitness function is used to evaluate each chromosome and determinate the best. In this study, we took the fitness function from Zhou et al. [7]:
where p is a weight coefficient that controls the tradeoff between precision of the regression model and number of selected descriptors, RMSE is Root Mean Square Error, n is the number of selected descriptors, and N is the total of descriptors. Throughout the evolution, the chromosomes are subject to selection, crossing, and mutation. For each chromosome, we trained and tested a SVR with 5-fold cross-validation, after the optimization of free parameters, and computed the average RMSE across the cross-validation folds. A total of 200 K Support Vector Regressions were trained and tested only for this experiment setup. The parameters of genetic algorithm were taken from Shu et al. [3], where the population was 200, the maximum number of generations were 200, the crossover frequency was 0.5, and the mutation was 0.005. We used Pyevolve as the genetic algorithm framework.
Regarding the architecture of the autoencoders, we followed the same experimental setup as in [9], which is herewith reproduced for completeness:
"AE: We trained different configurations of autoencoders (AEs) to learn a new set of features which were then fed to a Support Vector Regression task. In each AE configuration we vary the number of neurons in the hidden layer from 20 to 1000 neurons. This allows for configurations producing both compact and sparse representations with respect to the number of descriptors in each group. When the number of neurons in the hidden layer was between 20 and 500 it was varied with a step of 20, and it was between 500 and 1000 it was varied with a step of 50. This resulted in 35 AE configurations which were used for each group of descriptors. Each one of these configurations contains several thousand connections that need to be trained. For instance an AE with 500 neurons in the hidden layer for descriptor group Ddcd with 106 descriptors contains around 106K connections.
SAE2: For each AE configuration we created a two layer stacked autoencoder by adding an additional hidden layer with half the neurons, producing therefore another 35 configurations. As explained, each configuration was trained layer-wise. Sizes of SAE2 configurations ranged between 800 connections and 1.6 million.
SAE4: Likewise SAE2 but the number of neurons in the second hidden layer was obtained by dividing the number of neurons in the first hidden layer by 4 yielding, again, another 35 configurations. Sizes of SAE4 configurations ranged between 600 connections and 1.1 million."
Since we have 11 descriptor groups, in total we run 1177 experimental configurations: 385 for AE, SAE2, and SAE4, 11 for Original, and 11 for GA.
B. Validation and supervised training
For supervised training, first, we split the data into a subset for training and another for validation, according to Zhou et al. [7], and then, optimized the free parameters of the Support Vector Regression task (Fig. 3, step 5). For this, we created a grid varying (C,( ε,), and for each combination of parameters, we used the train data split to train a SVR with 5-fold cross-validation, and with the average score of R 2 ext , we chose the parameters yielding the maximum score (Fig. 3, step 6). Our parameter grid contained 1872 parameter combinations, which were run with each configuration described in Section 3.1. Therefore, we trained 4,382,752 Support Vector Regression, cross validation processes, and selected one for each one of the 1177 Original, GA, AE, SAE2, and SAE4 configurations.
With the best parameter combination (C, (, ε) for each configuration, we trained a SVR with the full training split (no cross-validation), and tested it with the validation data split to obtain the final performance (Fig. 3, step 7). The performance metrics used for the validation set were RMSE ext , R ext , and R 2 ext (R 2 predictive) [11]. For each experimental configuration, we took the group of descriptors with the best performance in each one, and applied the two methods aforementioned:
LC: The learning curve (LC) was computed from the entire dataset, using the SVR with the best combination of parameters obtained through the experimental setups described above (Fig. 3, step 8). This process was conducted 30 times by sampling with replacement.
PT: The permutation test (PT) was applied on different train/test (these sets were taken when we applied bootstrapping to the full dataset, which is divided into train/test and validation r times). This process was conducted 10 times (r = 10), and it randomly permuted the labels 100 times (k = 100) for each r. (Fig. 3, step 9). We used the best combination of parameters obtained through the experimental setups described above.
V. Results
Table 2 summarizes the results obtained using the experimental setup described in the previous section, and those referenced in the literature. The results are shown along with the descriptor group, and GA, AE or SAE configuration with which they were obtained.
Table 2 Comparative results for different algorithms used to predict the activity of antimicrobial peptides. The best configuration is represented when the RMSEval score is close to zero, and R2 val Rval and R2 pred are closer to one
Initially, we implemented the original setup (i.e., without further processing or feature learning), and the set with the best performance was Composition Moment Vector (CMV) (Table 2); however, the performance was poorer than GA, SAE2, and SAE4. Then, we applied the methodology described in the methods section. The GA setup was used on each group of descriptors, and the best performance was obtained with Dqso. This result is better than the one reported by Zhou et al. [7], and the computation time is also less (without a parallelism strategy, contrary to Zhou et al. [7]. For AE configurations, the best groups of original descriptors were consistently Dctd (with 147 original descriptors) obtained with 900 hidden neurons, performing better than in literature reports only in the R2 ext metric. However, SAEs performed consistently better than results in the literature with different sets of descriptor groups, mostly Dqso and Dctd. The complete set of experiments took about 48 compute hours, using a computer with 4GB RAM, and a processor Intel Core i3 2.4 GHz. The computing time for each set of descriptors, and AE or SAE configuration varied greatly depending on the number of connections of the specific configuration.
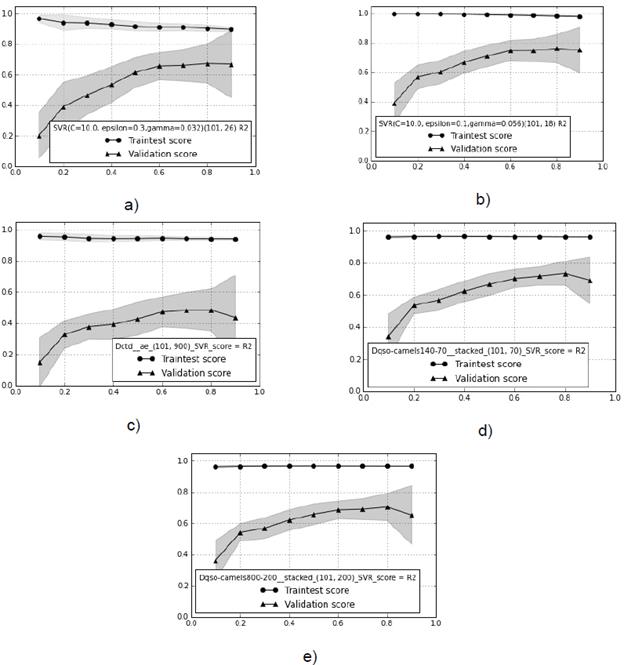
Fig. 4 Learning curves with the best descriptors for each experimental setup, and the score corresponding to R2 ext metric. a) Composition Moment Vector. b) GA with Quasi Sequence Order. c) AE and Composition, Transition and Distribution descriptors. d) SAE2 with Dqso. e) SAE4 with Dqso. The train test score is the performance parameter calculated from the union of the train and test set (the same dataset used to optimize the free parameters in the model).
The next step was assessing the setup configurations shown in Table 2, using learning curves and permutation tests. We computed the learning curve with the R 2 ext metric on each experimental setup (Original, GA, AE, SAE2, and SAE4) (Fig. 4).
Figure 4b shows the best behavior as the validation score progressively converges to high values, with the train score showing the lowest bias and overfitting. Therefore, we can confidently state that performance stabilized at 0.84 in the R2 metric. Figures 4a, 4d, and 4e show slightly worse performance, where data addition did not remove the gap between train and validation. This constitutes a clear case of methods being unable to generalize on data not seen during training (overfitting). This behavior is observed more drastically in figure 4c. Note that best performance (Fig. 4b) is obtained with GA. Fixing the behavior of the rest of the cases would probably require adding more data.
Subsequently, we used permutation tests on the same selected models. Figure 5 shows the results obtained on each experimental setup for Original, GA, AE, and SAE4, respectively. The permutation test shows whether the performance in the models was a result of chance (this problem is common when there are high dimensionality descriptors, and small sample sizes [22]. Each black square represents the original error of each bootstrapping, and the circles show the average of the permutation error with one standard deviation (the vertical line that crosses the circle). If the squares fall well below the circles, we can reject the null hypothesis, however, if that is not the case (or the error is similar), we cannot reject the null hypothesis with significance level (=0.01. Figure 5 shows that the null hypothesis is indeed rejected, which means that the predictors found a dependency between the data and the labels.
Fig. 5 Permutation test for each iteration of bootstrapping with experimental setup. a) Original. b) GA. c) AE. d) SAE2. e) SAE4.
Table 3 shows the p-value obtained for each experimental setup, where Err (in Original Label) represents the error average with original labels, and Std the standard deviation computed with 10 bootstraps. The Err (in Permutation Test) represents the error average with permuted labels, and Std the standard deviation computed out of 1000 permutations (r x k, with r=10, k=100). In each experimental configuration, the predictors are significant under the null hypothesis with a confidence level of 95 % (Table 3).
Table 3 Average error with original label, permutation test, and P-VALUE for each experimental setup
In order to verify in which ranges the results varied when we randomly changed the train/test and validation, we conducted an additional test with 10 bootstraps (random splits), following the same methodology than in figure 3. We found that the models using GA and SAE2 had low variability, and that changing the data in the train/test would result in good performances (Table 4). Moreover, the validation set indicated by Zhou et al. [7] seems to bias the results because the performance reported with this set is outside of the ranges shown with the bootstrapping.
Additionally, we measured the frequency of parameters for SVR, and found that C, (, and ε are most frequently equal to 10, 0.32, and 0.1, respectively.
Table 4 Bootstrapping on different experimental setups used in this work. Split Zhou indicates the results obtained by Zhou et al. [7] wiyh a specified train/test and validation set bootstrapping corresponds to the results obtained in this work using the same split
VI. Conclusions
In this study, we used traditional metrics for evaluating models to predict the antibiotic activity of peptides, and we used additional methods for assessing their statistical stability: learning curves, bootstrapping, and permutation tests. Furthermore, we constructed different experimental configurations using GA, AE and SAE to select or obtain additional descriptors of the peptides, obtaining better performance than other studies in the literature.
When feeding new features to a supervised machine learning method, we showed how learnt representations (by SAE) or selected features (by GA), consistently provided satisfactory results as compared with recent studies. This indicates the importance of the feature learning, and selection of the original set of descriptors from which the learning process starts. We believe this approach can be explored in other areas of protein prediction that share data characteristics, and problem complexity.
According to the learning curves, AE configurations show overfitting, suggesting an increase in the number of samples in the original datasets necessary to improve the performance. In the case of GA, SAE2, and SAE4, overfitting is only very mildly observed, showing the generalization capability of these models. With permutation test we found a real dependency between descriptors and activity with all models, showing that our models are statistically stable; furthermore, this suggests the necessity of exploring similar descriptors or combinations of CMV, Dctd, and Dqso.
Using a single data split, as proposed in other works, clearly biases the performance, supporting our approach of randomly and repeatedly splitting the dataset, and of verifying metrics with cross-validation or bootstrapping. Finally, we identified descriptor groups that consistently behave better: Composition Moment Vector and Quasi Sequence Order descriptors, which show evidence that the order and frequency of amino acids in the sequence play an important role in the peptides activity. This could help designing better candidate peptides in the future.

